The detection of Ne v emission in five blue compact dwarf galaxies
Abstract
We report the discovery of the high-ionisation [Ne v] 3426Å emission line in the spectra of five blue compact dwarf (BCD) galaxies. Adding the three previously known BCDs with [Ne v] emission, the entire sample of such galaxies now contains eight objects. The detection of this line implies the presence of intense hard ionising radiation. Such radiation cannot be reproduced by models of high-mass X-ray binaries or massive stellar populations. Other mechanisms, such as AGN and/or fast radiative shocks, are needed. We consider that fast radiative shocks is the most likely mechanism. The observed [Ne v] 3426/He ii 4686 flux ratios in all eight galaxies can be reproduced by radiative shock models with shock velocities in the 300 – 500 km s-1 range, and with the shock ionising contribution being 10% of the stellar ionising contribution. However, we cannot rule out that this 10% part is produced by an AGN rather than by radiative shocks.
keywords:
galaxies: abundances – galaxies: irregular – galaxies: evolution – galaxies: formation – galaxies: ISM – H ii regions – ISM: abundances.1 Introduction
Blue compact dwarf (BCD) galaxies are actively star-forming dwarf galaxies in the local universe. They have a heavy element mass fraction in the range 1/30 – 1/2 (e.g., Izotov & Thuan, 1999), assuming a solar oxygen abundance 12 + log O/H = 8.69 (Asplund et al., 2009). Thus, BCD massive stellar populations have properties intermediate between those of massive stars in solar-metallicity galaxies and those of the first stars. The hardness of the ionising radiation in BCDs has long been known to increase with decreasing metallicity (e.g., Campbell et al., 1986). BCDs constitute then excellent nearby laboratories for studying high-ionisation emission in a very metal-deficient environment.
The presence of hard radiation in BCDs is supported by the fact that strong nebular He ii 4686 emission is often seen in their spectra, with a flux that increases with decreasing metallicity of the ionised gas (Guseva et al., 2000; Thuan & Izotov, 2005). Besides He ii emission, high ionisation emission lines of heavy elements ions are also seen in the spectra of some BCDs. Fricke et al. (2001) and Izotov et al. (2001) first detected the high-ionisation [Fe v] 4227 emission line in the BCDs Tol 1214277 and SBS 0335052E, respectively. The presence of this line, just as that of the He ii 4686 line, requires ionising radiation with photon energies in excess of 4 ryd (54.4 eV) if ionised by radiation. Izotov et al. (2001) discovered [Fe vi] – [Fe vii] emission in SBS 0335052E, implying that this BCD contains intense hard radiation, given that the ionisation potential of Fe5+ is 5.5 ryd and that of Fe6+ is 7.3 ryd. Later, Izotov et al. (2004a) and Thuan & Izotov (2005) discovered [Ne v] 3426 emission in the three BCDs Tol 1214277, SBS 0335052E and HS 08374717. This line is often seen in Seyfert 2 galaxies, powered by the hard non-thermal radiation of an active galactic nucleus (AGN). Furthermore, Genzel et al. (1998) and Armus et al. (2007) have also detected the mid-infrared (MIR) [Ne v] 14.3 m and 24.3 m emission lines in several massive galaxies, and have attributed them also to the presence of an AGN. On other hand, no MIR [Ne v] emission line has ever been detected in a BCD. In particular, all the three above BCDs with a detected [Ne v] 3426 emission line were observed with ISO and Spitzer (Thuan et al., 1999; Houck et al., 2004; Wu et al., 2006; Hunt et al., 2010), but no MIR [Ne v] emission line was seen, probably because of the faintness of the lines and the insufficient sensitivity of the ISO and Spitzer space observatories. The existence of the [Ne v] 3426 emission line requires the presence of hard radiation with photon energies above 7.1 ryd, i.e. in the extreme UV and soft X-ray range. Such hard ionising radiation is confirmed by the detection of [Ne iv] (the ionisation potential of Ne3+ is 4.7 ryd) and [Fe vi] – [Fe vii] emission in Tol 1214277 (Izotov et al., 2004b).
While the presence of hard radiation is well established in some BCDs, the origin of this radiation is much less clear, in spite of several attempts to account for it (e.g., Garnett et al., 1991; Schaerer & Vacca, 1998). Several mechanisms for producing hard ionising radiation have been proposed, such as AGN (Izotov & Thuan, 2008), Wolf-Rayet stars (Schaerer, 1996), high-mass X-ray binaries (Garnett et al., 1991) and fast radiative shocks (Dopita & Sutherland, 1996). However, no mechanism has emerged clearly as the leading candidate, in particular because of the lack of a large database to confront models with observations. Despite the importance of understanding the high-ionisation phenomenon to interpret the spectra of primordial star-forming galaxies when these are discovered in the future, very few observations of high ionisation emission lines in metal-deficient BCDs exist. The He ii 4686 emission line has been detected in several hundred BCDs (Guseva et al., 2000; Thuan & Izotov, 2005; Shirazi & Brinchmann, 2012), while [Ne v] emission has been seen in only three BCDs (Izotov et al., 2004a; Thuan & Izotov, 2005). The scarcity of data concerning [Ne v] emission is partly due to the faintness of this high-ionisation line (3% of H). Its detection requires large telescope equipped with spectrographs operating efficiently in the near-UV range. To increase the number of known BCDs with [Ne v] 3426 emission, we have embarked in a program to obtain high signal-to-noise spectra in the blue wavelength region of a sample of BCDs with the 6.5m MMT. These BCDs were selected from the Data Release 7 (DR7) of the Sloan Digital Sky survey (SDSS) (Abazajian et al., 2009) to have spectra showing relatively strong He ii 4686 emission. We describe the observational data in Section 2, and how element abundances are derived in Section 3. We discuss possible mechanisms for the hard radiation in Section 4. Our conclusions are summarised in Section 5.
| Name | R.A. | Dec. | ||
|---|---|---|---|---|
| J2000.0 | J2000.0 | mag | mag | |
| J09050335 | 09:05:31.09 | 03:35:30.38 | 17.6 | 18.4 |
| J09205234 | 09:20:56.08 | 52:34:04.32 | 15.7 | 16.8 |
| J10163754 | 10:16:24.53 | 37:54:45.97 | 15.9 | 15.1 |
| J10440353 | 10:44:57.80 | 03:53:13.15 | 17.5 | 16.0 |
| J10501538 | 10:50:32.51 | 15:38:06.31 | 18.2 | 19.4 |
| J10535016 | 10:53:10.82 | 50:16:53.21 | 19.9 | 11.4 |
| J12301202 | 12:30:48.60 | 12:02:42.82 | 16.7 | 14.4 |
| J13230132 | 13:23:47.47 | 01:32:51.95 | 18.1 | 16.7 |
| J14232257 | 14:23:42.88 | 22:57:28.79 | 17.9 | 17.7 |
| J14263822 | 14:26:28.18 | 38:22:58.67 | 18.2 | 16.6 |
| J14480110 | 14:48:05.36 | 01:10:57.71 | 16.4 | 18.8 |
| J15450858 | 15:45:43.55 | 08:58:01.35 | 16.9 | 19.0 |

| Line | J0905+0335 | J0920+5234 | J1016+3754 | J1044+0353 | J1050+1538 | J1053+5016 |
|---|---|---|---|---|---|---|
| 3188 He i | 3.240.71 | 4.430.71 | 1.820.39 | 3.440.30 | … | 2.070.46 |
| 3203 He ii | 1.780.57 | … | … | 0.820.17 | … | … |
| 3426 [Ne v]b | 0.55 | 0.25 | 0.580.15 | 0.610.15 | 0.23 | 0.17 |
| 3712 H15 | 1.420.38 | 2.910.41 | 1.470.16 | 1.770.18 | 1.840.26 | 2.610.31 |
| 3727 [O ii] | 104.241.73 | 128.982.02 | 63.960.98 | 30.860.51 | 119.781.88 | 145.592.24 |
| 3750 H12 | 3.060.38 | 3.830.35 | 2.250.16 | 3.350.16 | 3.600.29 | 3.340.25 |
| 3770 H11 | 3.470.39 | 4.540.32 | 3.030.17 | 4.030.16 | 4.070.29 | 4.280.25 |
| 3797 H10 | 5.040.40 | 5.560.32 | 4.160.18 | 5.630.17 | 5.780.29 | 5.290.24 |
| 3820 He i | 0.660.23 | 1.030.13 | 0.730.10 | 0.770.06 | 1.080.16 | 0.590.11 |
| 3835 H9 | 6.870.39 | 7.870.30 | 6.380.18 | 7.610.19 | 7.860.29 | 7.430.25 |
| 3868 [Ne iii] | 46.620.82 | 42.840.69 | 36.940.57 | 35.680.57 | 55.550.90 | 48.520.76 |
| 3889 He i+H8 | 21.120.52 | 19.870.41 | 19.770.34 | 21.110.36 | 20.490.42 | 19.580.37 |
| 3968 [Ne iii]+H7 | 30.990.66 | 28.010.51 | 26.830.43 | 27.460.45 | 33.850.60 | 30.470.52 |
| 4026 He i | 1.320.20 | 1.730.14 | 1.150.08 | 1.750.09 | 1.750.15 | 1.240.11 |
| 4068 [S ii] | 1.130.24 | 1.130.11 | 0.620.08 | 0.730.08 | 1.520.17 | 1.520.12 |
| 4076 [S ii] | 0.520.24 | 0.380.11 | … | … | … | 0.400.10 |
| 4101 H | 27.260.56 | 26.020.47 | 26.280.41 | 26.390.42 | 27.130.49 | 26.160.44 |
| 4227 [Fe v] | … | … | … | 0.470.06 | … | … |
| 4340 H | 49.320.85 | 47.250.74 | 48.180.71 | 47.610.72 | 46.910.75 | 47.180.72 |
| 4363 [O iii] | 11.840.34 | 9.700.20 | 11.880.20 | 13.970.23 | 12.230.27 | 9.960.20 |
| 4388 He i | … | … | 0.360.08 | 0.630.10 | 0.530.11 | 0.360.08 |
| 4471 He i | 3.890.25 | 3.700.15 | 3.220.10 | 3.800.10 | 3.500.14 | 3.660.12 |
| 4658 [Fe iii] | 0.770.19 | 0.850.10 | 0.490.07 | 0.400.06 | 0.950.11 | 0.370.06 |
| 4686 He ii | 1.920.22 | 0.970.10 | 2.100.09 | 2.010.08 | 1.590.14 | 1.780.10 |
| 4711 [Ar iv]+He i | 1.630.17 | 1.220.12 | 1.490.09 | 2.160.09 | 1.360.13 | 1.170.09 |
| 4740 [Ar iv] | 1.460.19 | 0.630.10 | 0.870.08 | 1.340.06 | 0.910.12 | 0.680.08 |
| 4861 H | 100.001.55 | 100.001.47 | 100.001.43 | 100.001.45 | 100.001.47 | 100.001.46 |
| 4921 He i | 0.970.19 | 1.220.12 | 0.780.06 | 1.100.06 | 1.300.13 | 0.930.08 |
| 4959 [O iii] | 175.432.66 | 181.472.65 | 146.092.09 | 141.582.05 | 216.013.14 | 198.092.87 |
| 5007 [O iii] | 526.296.55 | 541.117.86 | 428.876.11 | 415.165.98 | 644.119.34 | 586.888.47 |
| 5015 He i | … | … | 2.240.08 | … | … | 2.070.11 |
| (H) | 0.000 | 0.000 | 0.000 | 0.020 | 0.180 | 0.000 |
| (H)c | 75.87 | 201.20 | 474.50 | 327.50 | 182.87 | 253.80 |
| EW(H), Å | 116.4 | 139.1 | 96.7 | 257.8 | 198.5 | 127.8 |
| EW(abs), Å | 0.0 | 1.4 | 0.0 | 0.8 | 0.0 | 0.9 |
aEmission-line fluxes are in 100()/(H).
bA 1 upper limit is given when the [Ne v] 3426 emission line is not detected.
cObserved H flux in 10-16 erg s-1cm-2.
| Line | J1230+1202 | J13230132 | J1423+2257 | J1426+3822 | J14480110 | J1545+0858 |
|---|---|---|---|---|---|---|
| 3188 He i | 2.751.11 | … | 4.150.59 | 4.150.77 | 2.830.56 | 3.330.22 |
| 3203 He ii | 2.870.81 | … | … | … | … | 1.090.16 |
| 3426 [Ne v]b | 0.790.36 | 0.39 | 0.910.31 | 0.31 | 0.20 | 0.510.16 |
| 3712 H15 | 1.290.38 | … | 1.360.29 | 1.360.32 | 2.510.53 | 1.930.15 |
| 3727 [O ii] | 118.381.91 | 21.820.73 | 83.151.38 | 85.741.42 | 97.031.61 | 69.971.08 |
| 3750 H12 | 2.340.36 | 3.360.80 | 2.700.34 | 2.610.32 | 3.630.51 | 3.350.15 |
| 3770 H11 | 3.170.37 | 4.120.70 | 3.120.32 | 3.450.37 | 4.190.45 | 4.080.15 |
| 3797 H10 | 4.090.38 | 5.510.70 | 5.070.34 | 4.960.36 | 5.910.47 | 5.350.16 |
| 3820 He i | 0.930.21 | 1.560.45 | … | 0.600.17 | … | 0.960.08 |
| 3835 H9 | 6.520.38 | 7.180.69 | 6.520.32 | 6.560.35 | 7.430.45 | 7.190.18 |
| 3868 [Ne iii] | 41.530.73 | 55.351.13 | 42.470.73 | 47.700.81 | 53.280.91 | 41.560.65 |
| 3889 He i+H8 | 19.930.50 | 19.060.77 | 20.710.47 | 19.640.47 | 19.850.48 | 19.000.32 |
| 3968 [Ne iii]+H7 | 27.890.57 | 33.380.90 | 28.870.56 | 29.870.60 | 31.300.63 | 29.270.47 |
| 4026 He i | 1.390.22 | 1.440.26 | 1.930.19 | 1.720.19 | 1.800.21 | 1.590.09 |
| 4068 [S ii] | 1.340.19 | … | 1.180.18 | 0.800.12 | 0.990.17 | 0.850.06 |
| 4076 [S ii] | … | … | … | … | … | 0.240.04 |
| 4101 H | 26.360.55 | 26.080.73 | 27.420.51 | 25.500.52 | 26.010.53 | 26.330.42 |
| 4227 [Fe v] | … | … | 0.470.14 | … | … | 0.330.05 |
| 4340 H | 49.500.82 | 47.790.94 | 46.890.75 | 48.750.81 | 47.060.78 | 47.350.71 |
| 4363 [O iii] | 11.040.29 | 20.800.52 | 13.520.28 | 12.350.29 | 9.510.26 | 13.330.22 |
| 4388 He i | 0.570.21 | … | … | … | … | 0.440.08 |
| 4471 He i | 3.550.19 | 3.800.30 | 3.520.15 | 3.890.24 | 3.510.19 | 3.600.10 |
| 4658 [Fe iii] | 0.800.16 | … | 0.730.12 | 0.890.16 | 1.000.15 | 0.870.07 |
| 4686 He ii | 3.810.20 | 1.370.33 | 3.230.15 | 2.440.19 | 0.860.13 | 2.040.08 |
| 4711 [Ar iv]+He i | 1.530.21 | 4.710.31 | 1.840.13 | 1.820.16 | 1.800.18 | 1.880.07 |
| 4740 [Ar iv] | 0.920.24 | 3.980.39 | 1.210.14 | 1.250.18 | 0.950.14 | 0.970.06 |
| 4861 H | 100.001.51 | 100.001.69 | 100.001.49 | 100.001.52 | 100.001.52 | 100.001.45 |
| 4921 He i | 0.800.15 | 0.930.28 | 0.950.13 | 1.220.21 | 1.000.19 | 0.790.07 |
| 4959 [O iii] | 155.062.30 | 225.183.59 | 169.712.50 | 189.252.82 | 214.473.19 | 177.262.56 |
| 5007 [O iii] | 455.526.67 | 635.969.94 | 514.057.52 | 548.038.07 | 625.419.24 | 530.306.24 |
| 5015 He i | 1.900.17 | … | … | … | … | … |
| (H) | 0.000 | 0.000 | 0.400 | 0.000 | 0.135 | 0.110 |
| (H)c | 107.70 | 63.32 | 133.80 | 80.16 | 337.70 | 235.80 |
| EW(H), Å | 84.5 | 264.7 | 129.0 | 106.8 | 134.7 | 211.8 |
| EW(abs), Å | 0.0 | 0.4 | 0.0 | 0.0 | 1.1 | 0.6 |
aEmission-line fluxes are in units 100()/(H).
bA 1 upper limit is given when the [Ne v] 3426 emission line is not detected.
bObserved H flux in 10-16 erg s-1cm-2.
| Property | J0905+0335 | J0920+5234 | J1016+3754 | J1044+0353 | J1050+1538 | J1053+5016 |
|---|---|---|---|---|---|---|
| (O iii) (K) | 16103237 | 14498150 | 17851196 | 19928243 | 14875165 | 14153138 |
| (O ii) (K) | 14924200 | 13931133 | 15718156 | 16272176 | 14187144 | 13685123 |
| O+/H+ (104) | 0.0960.004 | 0.1480.005 | 0.0500.001 | 0.0220.001 | 0.1300.004 | 0.1770.053 |
| O2+/H+ (104) | 0.4860.019 | 0.6500.019 | 0.3140.009 | 0.2400.007 | 0.7240.023 | 0.7520.021 |
| O3+/H+ (106) | 1.1470.134 | 0.8470.091 | 0.9410.047 | 0.5420.027 | 1.5630.141 | 1.8380.112 |
| O/H (104) | 0.5940.019 | 0.8060.020 | 0.3740.009 | 0.2680.007 | 0.8690.023 | 0.9470.022 |
| 12 + log(O/H) | 7.770.01 | 7.910.01 | 7.570.01 | 7.430.01 | 7.940.01 | 7.980.01 |
| Ne++/H+ (105) | 1.0200.042 | 1.2670.041 | 0.6160.018 | 0.4560.014 | 1.5220.051 | 1.5440.048 |
| ICF | 1.0587 | 1.0632 | 1.0515 | 1.0342 | 1.0539 | 1.0677 |
| log(Ne/O) | 0.740.02 | 0.780.02 | 0.760.02 | 0.750.02 | 0.730.02 | 0.760.02 |
| Fe++/H+ (106) | 0.1480.037 | 0.1940.023 | 0.0830.012 | 0.0630.010 | 0.2080.025 | 0.0890.015 |
| ICF | 8.4843 | 7.4619 | 10.2202 | 16.8769 | 9.2241 | 7.3197 |
| log(Fe/O) | 1.670.11 | 1.740.05 | 1.640.07 | 1.400.07 | 1.660.05 | 2.160.07 |
| Property | J1230+1202 | J13230132 | J1423+2257 | J1426+3822 | J14480110 | J1545+0858 |
| (O iii) (K) | 16659239 | 19485323 | 17440217 | 16046205 | 13503167 | 17009169 |
| (O ii) (K) | 15209198 | 16190239 | 15558175 | 14893174 | 13189151 | 15373138 |
| O+/H+ (104) | 0.1030.004 | 0.0160.001 | 0.0670.002 | 0.0790.003 | 0.1340.005 | 0.0580.002 |
| O2+/H+ (104) | 0.3900.014 | 0.3900.015 | 0.3940.013 | 0.5150.018 | 0.9120.033 | 0.4310.011 |
| O3+/H+ (106) | 2.1070.126 | 0.5730.141 | 1.6800.091 | 1.4930.127 | 1.0470.166 | 1.1020.049 |
| O/H (104) | 0.5140.015 | 0.4110.016 | 0.4780.013 | 0.6090.018 | 1.0560.033 | 0.5010.011 |
| 12 + log(O/H) | 7.710.01 | 7.610.02 | 7.680.01 | 7.780.01 | 8.020.01 | 7.700.01 |
| Ne2+/H+ (105) | 0.8290.032 | 0.7450.030 | 0.7510.025 | 1.0540.038 | 1.9630.078 | 0.7850.022 |
| ICF | 1.0809 | 1.0215 | 1.0570 | 1.0499 | 1.0463 | 1.0451 |
| log(Ne/O) | 0.760.02 | 0.730.02 | 0.780.02 | 0.740.02 | 0.710.02 | 0.790.02 |
| Fe2+/H+ (106) | 0.1480.029 | … | 0.1270.021 | 0.1730.031 | 0.2650.040 | 0.1560.012 |
| ICF | 6.8370 | … | 9.7400 | 10.5541 | 10.8730 | 11.7320 |
| log(Fe/O) | 1.710.09 | … | 1.590.08 | 1.520.08 | 1.560.07 | 1.440.03 |
2 MMT observations and data reduction
We have obtained new high signal-to-noise ratio spectrophotometric observations for 12 BCDs with the 6.5 m MMT on the nights of 2010 April 13 and 2011 March 4 – 5. In constructing the observational sample, we have selected from the SDSS DR7 high-excitation H ii regions with strong He ii 4686 emission, i.e. those with (He ii 4686)/(H) 1–2%. This selection criterion is motivated by the fact that the [Ne v] emission in Tol 1214277, SBS 0335052E and HS 08374717 is associated with relatively strong He ii emission. The general characteristics of 12 BCDs are listed in Table 1 in order of increasing right ascension. All observations were made with the Blue Channel of the MMT spectrograph. We used a 15180″ slit and a 800 grooves mm-1 grating in first order. The above instrumental setup gave a spatial scale along the slit of 06 pixel-1, a scale perpendicular to the slit of 0.75 Å pixel-1, a spectral range of 3200 – 5200Å and a spectral resolution of 3 Å (FWHM). The seeing was 1″ during both runs. The total exposure times varied between 45 and 60 minutes. Each exposure was broken up into 3 – 4 subexposures, not exceeding 15 minutes each, to allow for removal of cosmic rays. Three Kitt Peak IRS spectroscopic standard stars, G191B2B, Feige 34, and HZ 44 were observed at the beginning, middle, and end of each night for flux calibration. Spectra of He+Ar comparison arcs were obtained before or after each observation to calibrate the wavelength scale.
The two-dimensional spectra were bias-subtracted and flat-field corrected using IRAF.111IRAF is distributed by National Optical Astronomical Observatory, which is operated by the Association of Universities for Research in Astronomy, Inc., under cooperative agreement with the National Science Foundation. We then use the IRAF software routines IDENTIFY, REIDENTIFY, FITCOORD, and TRANSFORM to perform wavelength calibration and correct for distortion and tilt for each frame. Night sky subtraction was performed using the routine BACKGROUND. The level of night sky emission was determined from the closest regions to the galaxy that are free of galaxian stellar and nebular line emission, as well as of emission from foreground and background sources. Then, the two-dimensional spectra were flux-calibrated using observations of standard stars. One-dimensional spectra were finally extracted from each two-dimensional frame using the APALL routine. The emission-line fluxes were measured using the IRAF SPLOT routine. The line flux errors listed include statistical errors derived with SPLOT from non-flux calibrated spectra, in addition to errors introduced in the standard star absolute flux calibration. Since the differences between the response curves derived for the three standard stars are not greater than 1%, we set the errors in flux calibration to 1% of the line fluxes. The line flux errors will be later propagated into the calculation of abundance errors. The line fluxes were corrected for both reddening (Whitford, 1958) and underlying hydrogen stellar absorption derived simultaneously by an iterative procedure as described in Izotov et al. (1994). The extinction coefficient (H) for the line flux correction for interstellar dust is derived from the observed decrement of the Balmer hydrogen emission lines.
The corrected line fluxes 100()/(H), extinction coefficients (H), equivalent width EW(H) of the H emission line and equivalent widths EW(abs) of the hydrogen absorption stellar lines are given in Table 2, along with the uncorrected H fluxes.
| Name | Redshift | 12+logO/H | EW(H) | Flux | log (H) | FWHMc | ||||
| Å | Ha | 4686b | 3426b | H | 4686 | 3426 | ||||
| a) This paper | ||||||||||
| J09050335 | 0.03914 | 7.770.01 | 116.4 | 0.760.01 | 1.920.22 | 0.55 | 40.35 | 210 | 235 | … |
| J09205234 | 0.00780 | 7.910.01 | 139.1 | 2.010.03 | 0.970.10 | 0.25 | 39.37 | 176 | 192 | … |
| J10163754 | 0.00391 | 7.570.01 | 96.7 | 4.740.08 | 2.100.09 | 0.580.15 | 39.14 | 188 | 207 | 228 |
| J10440353 | 0.01287 | 7.430.01 | 257.8 | 3.420.05 | 2.010.08 | 0.610.15 | 40.03 | 241 | 239 | 220 |
| J10501538 | 0.08454 | 7.940.01 | 198.5 | 2.280.04d | 1.600.32 | 0.23 | 41.49 | 247e | 325 | … |
| J10535016 | 0.00449 | 7.980.01 | 127.8 | 2.550.04 | 1.790.10 | 0.17 | 38.99 | 170 | 182 | … |
| J12301202 | 0.00408 | 7.700.01 | 84.5 | 1.070.02 | 3.810.20 | 0.790.36 | 38.53 | 180 | 180 | 179 |
| J13230132 | 0.02254 | 7.610.02 | 264.7 | 0.630.01 | 1.370.33 | 0.39 | 39.79 | 242 | 258 | … |
| J14232257 | 0.03287 | 7.680.01 | 129.0 | 3.350.05 | 3.230.15 | 0.910.31 | 40.84 | 201 | 227 | 280 |
| J14263822 | 0.02237 | 7.780.01 | 106.8 | 0.800.01 | 2.440.19 | 0.31 | 39.88 | 198 | 202 | … |
| J14480110 | 0.02733 | 8.020.01 | 134.7 | 4.630.07 | 0.860.13 | 0.20 | 40.82 | 258 | 264 | … |
| J15450858 | 0.03758 | 7.700.01 | 211.8 | 3.030.04 | 2.040.08 | 0.510.16 | 40.91 | 198 | 228 | 190 |
| b) Other galaxies with [Ne v] 3426 emission | ||||||||||
| SBS0335052Ef | 0.01349 | 7.310.01 | 189.7 | 10.20.15 | 2.520.04 | 0.720.06 | 40.55 | 227 | 260 | 371 |
| HS08374717f | 0.04195 | 7.600.01 | 235.0 | 5.260.08 | 1.990.07 | 0.470.13 | 41.25 | 225 | 280 | 246 |
| Tol1214277g | 0.02600 | 7.560.01 | 320.4 | 3.130.05 | 5.000.10 | 2.700.40 | 40.61 | … | … | … |
a Extinction-corrected flux in units 10-14 erg s-1 cm-2.
b Extinction-corrected fluxes in units 100(4686)/(H) and 100(3426)/(H).
cIn km s-1.
dFrom the SDSS spectrum.
eWidth of the H emission line.
fData are from Thuan & Izotov (2005).
gData are from Izotov et al. (2004a).
3 Physical characteristics and element abundances
To determine element abundances, we follow generally the procedures of Izotov et al. (1994) and Izotov et al. (2006a). We adopt a two-zone photoionised H ii region model: a high-ionisation zone with temperature (O iii), where [O iii], [Ne iii], and [Ar iv] lines originate, and a low-ionisation zone with temperature (O ii), where [N ii], [O ii], [S ii], and [Fe iii] lines originate. As for the [S iii] and [Ar iii] lines, they originate in the intermediate zone between the high- and low-ionisation regions. The temperature (O iii) is calculated using the [O iii] 4363/(4959+5007) ratio. To take into account the electron temperatures for different ions, we have used the expressions of Izotov et al. (2006a). Since our observations cover only the blue part of the optical spectrum, the [S ii] 6717, 6731 emission lines usually used to determine the electron number density (S ii) were not available. Therefore, we set (S ii) = 10 cm-3. The low-density limit for abundance determinations should hold as long as is less than 104 cm-3. Ionic and total heavy element abundances for the 12 BCDs observed with the MMT are derived in the manner described in Izotov et al. (2006a). The electron temperatures (O iii), (O ii), ionic and total heavy element abundances, the ionisation correction factors for unseen stages of ionisation are shown in Table 3. The oxygen abundances are given in Table 4. They are generally low, in the range 12 + logO/H = 7.43 – 8.02, corresponding to heavy element mass fractions between 1/19 and 1/5 with the solar calibration of Asplund et al. (2009). The Ne/O and Fe/O abundance ratios are in the range of abundance ratios for BCDs (e.g. Izotov et al., 2006a).

4 Hard ionising radiation and origin of the [Ne v] 3426 emission
4.1 Observed properties
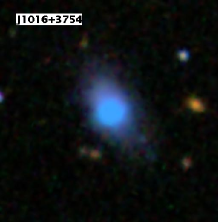
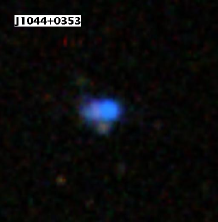
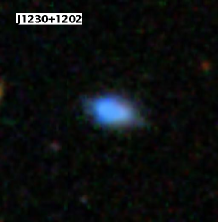
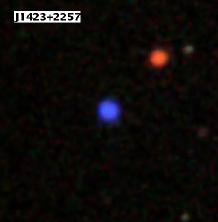
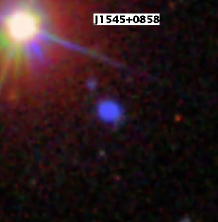
The spectroscopic characteristics of the 12 observed BCDs are shown in Table 4. It contains the galaxy name, the redshift , the oxygen abundance 12 + log O/H, the equivalent width EW(H) of the H emission line, the extinction-corrected fluxes of the H, He ii 4686 and [Ne v] 3426 emission lines, the logarithm of the extinction-corrected H luminosity, and the full widths at half maximum (FWHM) of the H, He ii 4686 and [Ne v] 3426 emission lines. For comparison, we also show data from the literature for the three BCDs known previously to have [Ne v] 3426 emission. For the present sample, Table 4 shows that [Ne v] 3426 emission is present in five out of 12 BCDs, increasing the total number of known BCDs with [Ne v] 3426 emission to eight. The SDSS images of the five BCDs with detected [Ne v] 3426 emission in the present sample are shown in Fig. 1. All of them have a compact structure with a bright H ii region. We note however that all other observed BCDs without detected [Ne v] 3426 emission line also have similar morphology, so morphology is not the discriminant factor. All BCDs with [Ne v] 3426 emission are also dwarf galaxies, as seen by the absolute magnitudes listed in Table 1.
We show in Figure 2 the redshift-corrected spectra of the five BCDs with detected [Ne v] 3426 emission. The three dotted vertical lines show respectively the locations of the [Ne v] 3426, [Fe v] 4227, and He ii 4686 emission lines. The [Fe v] 4227 emission line is clearly detected in the three BCDs J10440353, J14232257, and J15450858. The insets in each panel show the expanded part of the spectra with the [Ne v] 3426 emission line.
Inspection of Table 4 shows that the [Ne v] 3426 line is detected only in BCDs with a He ii 4686/H flux ratio 2%. The situation is the same in the three previously known BCDs with [Ne v] 3426 emission (Izotov et al., 2004b; Thuan & Izotov, 2005). This implies that [Ne v] 3426 and He ii 4686 emission are associated. The [Ne v] 3426/He ii 4686 flux ratio in all eight BCDs is in the range 20 – 50%. There is however one exception in Table 4: the galaxy J14263822 has a He ii 4686/H flux ratio 2%, yet no [Ne v] 3426 emission line was detected. We suggest that the non-detection is simply due to the faintness of the galaxy (it is fainter than all five galaxies with [Ne v] 3426 emission), resulting in a spectrum with a lower signal-to-noise ratio. The BCDs with [Ne v] 3426 emission tend to have lower oxygen abundances, in the range 7.3 – 7.7, implying hotter H ii regions. This is in line with the conclusions of Guseva et al. (2000) and Thuan & Izotov (2005) who found that the nebular He ii line emission is stronger in BCDs with lower metallicity, which would enhance the probability of detecting [Ne v] 3426 emission. On the other hand, there is no clear difference between the equivalent widths EW(H) which measure the age of the starburst, and luminosities (H) of the H emission line of BCDs with [Ne v] 3426 emission and of those without.
We also do not find any difference in the electron number density (S ii) (not shown in Table 4) between the two sets of galaxies. These are derived from the [S ii] 6717/6731 flux ratio in the SDSS spectra, as the MMT spectra do not cover the red wavelength range.
4.2 Origin of the hard radiation
4.2.1 AGN
Izotov et al. (2004b) and Thuan & Izotov (2005) have analysed some possible sources of the hard ionising radiation responsible for the He ii and especially the [Ne v] emission. Although in normal galaxies, [Ne v] emission is usually attributed to the presence of an active galactic nucleus (AGN), those authors rule out such a presence because other emission lines usually associated with AGN activity are not seen. We have run CLOUDY (version v10.00) models (Ferland et al., 1998) with an ionising spectrum which includes both stellar (Leitherer et al., 1999) and AGN (Mathews & Ferland, 1987) ionising radiation. We found that, to account for the observed strengths of both the [Ne v] 3426 and He ii 4686 emission lines, the number fraction of the AGN ionising photons should be 10% of the number of stellar ionising photons. Thus, we cannot rule out the presence of a non-thermal source of ionisation in the studied galaxies.
4.2.2 High-mass X-ray binaries
The energy of the photons that produce Ne4+ ions are in the extreme UV and soft X-ray range. Thus high-mass X-ray binaries (HMXBs) may play a role. Izotov et al. (2004b) have estimated that the X-ray luminosity required to reproduce the [Ne v] emission in the BCD Tol1214–277 at photon energies greater than 0.14 keV should be =1039 – 1040 ergs s-1. Unfortunately, out of the 8 known galaxies with [Ne v] emission, only SBS 0335–052 has Chandra X-ray observations (Thuan et al., 2004). For this BCD, it is found that more than 90% of its 0.5-10 keV flux comes from a point source with a luminosity of 3.51039 ergs s-1. If that point source is composed of a single object, then its luminosity would place it in the range of the so-called ultraluminous X-ray sources (ULXs). However, Thuan & Izotov (2005) did not consider HMXBs as the main mechanism for producing [Ne v] emission. The reason is that there are other BCDs, such as I Zw 18 (Thuan et al., 2004) and Mrk 59 (Thuan et al., 2012) that are known to contain HMXBs, but do not show [Ne v] emission.
4.2.3 Stars
Using photoionisation H ii models, Schaerer & Stasińska (1999) have concluded that both the He ii and [Ne v] emission in BCDs could be explained by the hard ionising radiation produced by WR stars. On the other hand, Thuan & Izotov (2005) have found that stellar radiation, including that of Wolf-Rayet stars, is too soft for producing He ii 4686 emission with a flux above 0.1 – 1% that of H. To resolve this disagreement, we have run a series of CLOUDY models with pure stellar ionising radiation. We have adopted the ionising spectral energy distribution from Starburst99 models with a heavy element mass fraction = 0.001 (Leitherer et al., 1999), corresponding to an oxygen abundance 12+logO/H of 7.6. We find that a detectable He ii 4686 emission line is present only in H ii region models powered by starbursts in the very short age range between 3.4 Myr and 3.6 Myr. Furthermore, the maximum flux of this line is 0.5% that of H, several times smaller than the observed flux. The discrepancy is considerably worse in the case of [Ne v] 3426 emission. Moreover, the broad WR bump at 4650 is present only in the spectrum of J1423+2257. It is absent in the spectra of the other four BCDs with [Ne v] 3426 emission. This is in line with the conclusions of Guseva et al. (2000) and Shirazi & Brinchmann (2012) who also did not find a clear correlation between the presence of WR and nebular He ii emission.
Thuan & Izotov (2005) found that it is possible, in principle, to reproduce the observed He ii 4686 and [Ne v] 3426 emission line fluxes by models of very low metallicity ( 10-7) massive ionising stars (Schaerer, 2002, 2003). However, such models of Population III stars would predict equivalent widths of H emission line that are several times larger than those observed. Thus, neither models of normal stars, of Wolf-Rayet stars, nor of primordial stars are able to reproduce the observed high-ionisation line fluxes.
4.2.4 Fast radiative shocks
One of the most promising explanations for the hard radiation and the high-ionisation emission lines in BCDs is the presence of the fast radiative shocks produced by SNe. Izotov et al. (2004b) and Thuan & Izotov (2005) using the shock models of Dopita & Sutherland (1996) concluded that radiative shocks with velocities of 450 km s-1 can account for the observed fluxes of both the He ii 4686 and [Ne v] 3426 emission lines if the contribution of the shocks to the observed flux of the H emission line is a few percent that of the stars. However, only shocks propagating in an ISM with solar metallicity were considered by Dopita & Sutherland (1996).
Since the work of Thuan & Izotov (2005), a new grid of radiative shock models has been calculated by Allen et al. (2008) for an ISM with solar, Large Magellanic Cloud (LMC) and Small Magellanic Cloud (SMC) metallicities, and a wide range of shock velocities going from 100 to 1000 km s-1. We now examine whether these models are able to reproduce the observed fluxes of the high-ionisation emission lines in our BCDs. However, a direct comparison of the models with the observations is not straightforward because: 1) the dominant source of ionisation in BCDs is stellar emission, which would mask the effect of shocks on the emission line fluxes; 2) most of the shock models were calculated for shocks propagating in a neutral or weakly ionised ISM, while we expect shocks in BCDs to propagate in an ISM fully ionised by massive stellar clusters and containing relatively high-ionisation species like O iii, Ne iii, Ar iv. This is evidenced by the strong emission lines of these ions seen in the spectra of the BCDs studied here (Fig. 2). We would then expect the emission lines of low-ionisation species like [O ii] 3727 not to be affected by shocks, as they may originate in regions different from those where shocks propagate. Therefore, these cannot be used for shock diagnostics; 3) it is likely that the signatures of several shocks with different velocities are seen in the integrated spectra of BCDs. Indeed, Izotov et al. (1996) and Izotov et al. (2007) have shown that the H, [O iii] 4959, 5007, and H emission lines in some BCDs exhibit broad components, with FWHMs of 1000 – 2000 km s-1 and fluxes of 1 – 2% of the narrow component fluxes. This broad emission is likely produced in the adiabatic shocks propagating with velocities of several thousand km s-1 (e. g. Chevalier, 1977). Similar broad components of H, and [O iii] 4959, 5007 are observed in the spectra of some of the BCDs studied in this paper, such as J1044+0353 and J1545+0858 (Fig. 2). On the other hand, the He ii and [Ne v] emission likely arises in the preshock and compressed postshock regions of slower radiative shocks.
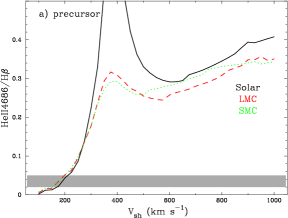
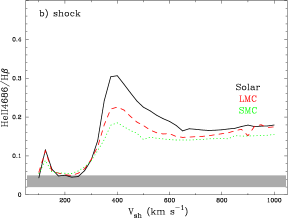
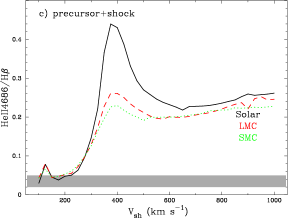
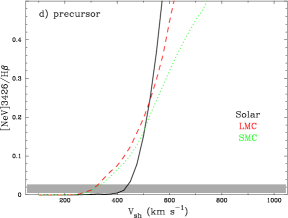
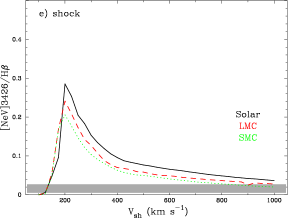
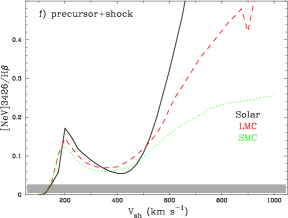
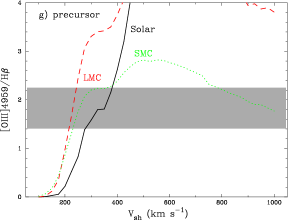
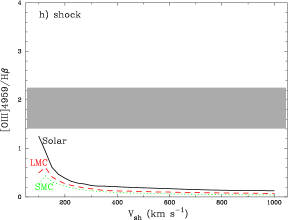
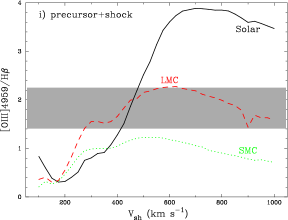
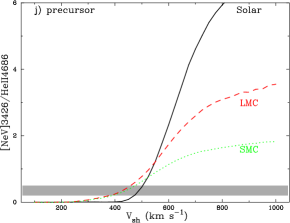
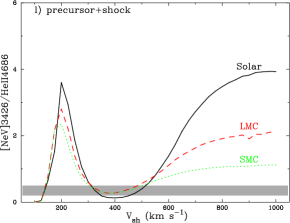
In Fig. 3, we show from top to bottom the predicted (He ii 4686)/(H), ([Ne v] 3426)/(H), ([O iii] 4959)/(H), and ([Ne v] 3426)/(He ii 4686) emission line flux ratios for the precursor, shock and combined precursor+shock models (from left to the right) as a function of the shock velocity . Models with solar, LMC and SMC metallicities are shown by a black solid line, a red dashed line, and a green dotted line, respectively. All models have a number density of the ambient gas = 1 cm-3, as the grid of models of Allen et al. (2008) for different metallicities was calculated only for that density. However, we have checked from the solar metallicity models, which were calculated for a range of , that the dependence of the emission line flux ratios on is weak in the range = 0.1 – 103 cm-3. The shaded regions indicate the range of the observed emission line flux ratios in the BCDs with detected [Ne v] 3426 emission.
Inspection of Fig. 3 shows that the predicted (He ii 4686)/(H) and ([Ne v] 3426)/(H) line ratios are generally considerably larger than the observed ones. Agreement is only possible in the very narrow range of shock velocities, 200 km s-1. To have agreement for higher shock velocities, one would have to assume that the contribution of the shock ionising radiation to the excitation of the H emission line is small, not exceeding 10% that of the stellar ionising radiation. This would be a natural assumption since the studied BCDs contain numerous hot O stars, producing copious amounts of ionising photons. There is another problem with the shock models with 200 km s-1. While the modelled line flux ratios in Fig. 2c, 2f, and 2l are comparable to the observed ratios, implying that shocks can be the only source of ionisation, there is no such good agreement between the predicted and observed emission line ratios of other species. In particular, the predicted [O iii] 4959/H flux ratios (Fig. 2i) are several times lower than the observed ones. In fact, the shock models with the SMC oxygen abundance of 12+logO/H = 8.1 underpredict this ratio over the entire range of shock velocities. For the lower oxygen abundances that are characteristic of our BCDs, the discrepancy would be even worse. Therefore, we conclude that the dominant source of ionisation for the majority of the species in the BCDs studied here is stellar radiation, with the exception of the high-ionisation species which would require a 10% contribution from shock radiation.
The observed ([Ne v] 3426)/(He ii 4686) flux ratio is in the range 0.2 – 0.5 (Table 4). If a single shock is assumed, then this range corresponds to shock velocities of 300 – 500 km s-1 (Fig. 3l). However, the situation is more complicated when there are several shocks superposed on one another. This is to be expected in our BCDs which contain a large number of massive stars and hence many supernova remnants. The modelled He ii 4686/H and [Ne v] 3426/H flux ratios would be both in agreement with the observed ratios if the fraction of the H flux produced by shocks is 10% that produced by stellar ionising radiation, in the case of LMC and SMC metallicities (Fig. 3c and 3f), and if shocks velocities are in the 300 – 500 km s-1 range. These shocks produce an appreciable amount of extreme UV photons, but at higher X-ray energies of 1 kev, the ionising flux is predicted to decrease considerably (e. g., Fig. 2 in Allen et al., 2008). Therefore, no appreciable X-ray emission is expected from our BCDs. Unfortunately, we cannot check this prediction as none of the BCDs in Table 4 have X-ray observations, except for the brightest one, SBS 0335-052E, where weak diffuse X-ray emission, accounting for 10% of the total X-ray emission, was detected. The other 90% come from an ultraluminous X-ray binary, as described before (Thuan et al., 2004).
4.2.5 Preshock and shock regions
As for the preshock (precursor) and shock regions, they contribute comparably to the excitation of He ii and [Ne v] emission, for 300 - 500 km s-1. However, we would expect a width difference in the lines arising from these regions. The preshock region is less disturbed, so the widths of the lines produced in that region should be narrow, of 50 – 100 km s-1. On the other hand, lines produced in the shocked region would be broader. However, the widths of these lines would depend on the characteristic time of thermalisation, resulting in the highest width if the postshock region is thermalised. In any case, the postshock thermal velocities would be lower than the shock velocity.
In Table 4, we show the FWHMs of the H, He ii 4686 and [Ne v] 3426 emission lines. They are all very similar, 200 – 250 km s-1, corresponding to a velocity dispersion = FWHM/2.3 100 km s-1, significantly lower than the shock velocity. However, we point out that the emission lines in the MMT spectra are nearly unresolved, so that the measured widths are mainly instrumental. Izotov et al. (2006b), using higher resolution VLT/GIRAFFE observations of SBS 0335052E, have measured the FWHMs of H and He ii 4686 to be respectively 90 km s-1 and 140 km s-1. This difference in the FWHM is natural, as the H emission line is produced mainly in the undisturbed gas ionised by stars, while He ii 4686 emission arises both in the preshock and postshock ISM. Unfortunately, the observations of Izotov et al. (2006b) do not cover the near-UV range, and hence no high spectral resolution data for [Ne v] 3426 are available.
5 Conclusions
We present MMT spectroscopic observations in the wavelength range 3200 - 5200Å of 12 blue compact dwarf (BCD) galaxies. Our aim was to detect the high-ionisation emission line [Ne v] 3426Å and to study the excitation mechanisms of this emission. Our main results are as follows:
1. The [Ne v] 3426Å emission line was detected in five BCDs. Adding the three BCDs known previously to have [Ne v] emission (Izotov et al., 2004b) (Thuan & Izotov, 2005), there is now a total of 8 BCDs known to possess this property.
2. [Ne v] 3426Å emission was found only in galaxies with low oxygen abundance (12+logO/H = 7.3 – 7.7) and showing relatively strong He ii 4686Å emission ( 2% of the H emission line flux). The [Ne v] 3426/He ii 4686 flux ratio ranges between 0.2 and 0.5. On the other hand, there is no significant correlation of the [Ne v] flux with the equivalent width EW(H) and the luminosity (H) of the H emission line.
3. The [Ne v] and He ii emission in the BCDs cannot be produced by ionising radiation from high-mass X-ray binaries or massive main sequence stars, in agreement with the conclusions from previous studies. Wolf-Rayet stars are also ruled out. Out of five BCDs with detected [Ne v] 3426Å emission, broad WR emission was detected only in one galaxy.
4. The observed [Ne v] 3426/He ii 4686 flux ratio can be reproduced in models with either AGN or radiative shock ionising radiation. In the case of AGN, the number fraction of the AGN ionising photons should be 10% of the number of stellar ionising photons.
Another likely ionising source for the [Ne v] and He ii emission is shocks produced by supernovae. However, comparison with shock models is not straightforward because: 1) we likely observe the superposition of an ensemble of SNe remnants with various shock velocities while shock models are calculated for one given shock velocity; and 2) the main source of ionisation of the lower ionisation species (including hydrogen) is stellar radiation, thus excluding a direct comparison of the observed flux ratios of both high- and low-ionisation species with shock model predictions. Therefore, the only constraint on shock models is the [Ne v] 3426/He ii 4686 flux ratio. We find that the observed range of this flux ratio is consistent with models of radiative shocks if shock velocities are in the 300 – 500 km s-1 range, and if the shock ionising contribution is also 10% of the stellar ionising contribution. This conclusion is in agreement with previous findings by Izotov et al. (2004b) and Thuan & Izotov (2005). Faster shocks, likely adiabatic, with velocities 1000 -2000 km s-1 are also present in our BCDs, as suggested by the low-intensity broad components of the H and [O iii] 4959, 5007Å emission lines seen in some objects.
Acknowledgments
Y.I.I. thanks Dr Grazyna Stasińska for helpful suggestions. T.X.T. thanks the hospitality of the Institut d’Astrophysique de Paris.
References
- Abazajian et al. (2009) Abazajian K., et al., 2009, ApJS, 182, 543
- Allen et al. (2008) Allen M. G., Groves B. A., Dopita M. A., Sutherland R. S., Kewley L. J., 2008, ApJS, 178, 20
- Armus et al. (2007) Armus L., et al., 2007, ApJ, 656, 148
- Asplund et al. (2009) Asplund M., Grevesse N., Sauval A. J., Scott P., 2009, ARAA, 47, 481
- Campbell et al. (1986) Campbell A., Terlevich R., Melnick J., 1986, MNRAS, 223, 811
- Chevalier (1977) Chevalier R. A., 1977, ARAA, 15, 175
- Dopita & Sutherland (1996) Dopita M. A., Sutherland R. S., 1996, ApJS, 102, 161
- Ferland et al. (1998) Ferland G. J., Korista K. T., Verner D. A., Ferguson J. W., Kingdon J. B, Verner E. M., 1998, PASP, 110, 761
- Fricke et al. (2001) Fricke K. J., Izotov Y. I., Papaderos P., Guseva N. G., Thuan T. X., 2001, AJ, 121, 169
- Garnett et al. (1991) Garnett D. R., Kennicutt R. C., Chu Y.-H., Skillman E. D., 1991, ApJ, 373, 458
- Genzel et al. (1998) Genzel R., et al., 1998, ApJ, 498, 579
- Guseva et al. (2000) Guseva N. G., Izotov Y. I., Thuan T. X. 2000, ApJ, 531, 776
- Houck et al. (2004) Houck J. R., et al., 2004, ApJS, 154, 211
- Hunt et al. (2010) Hunt L. K., Thuan T. X., Izotov Y. I., Sauvage M., 2010, ApJ, 712, 164
- Izotov & Thuan (1999) Izotov Y. I., Thuan T. X., 1999, ApJ, 511, 639
- Izotov & Thuan (2008) Izotov Y. I., Thuan T. X., 2008, ApJ, 687, 133
- Izotov et al. (1994) Izotov Y. I., Thuan T. X., Lipovetsky V. A., 1994, ApJ, 435, 647
- Izotov et al. (1996) Izotov Y. I., Dyak A. B., Chaffee F. H., Foltz C. B., Kniazev A. Y., Lipovetsky V. A., 1996, ApJ, 458, 524
- Izotov et al. (2001) Izotov Y. I., Chaffee F. H., Schaerer D.,2001, A&A, 378, L45
- Izotov et al. (2004a) Izotov Y. I., Noeske K. G., Guseva N. G., Papaderos P., Thuan T. X., Fricke K. J., 2004a, A&A, 415, L27
- Izotov et al. (2004b) Izotov Y. I., Papaderos P., Guseva N. G., Fricke K. J., Thuan T. X., 2004b, A&A, 421, 539
- Izotov et al. (2006a) Izotov Y. I., Stasińska G., Meynet G., Guseva N. G., Thuan T. X., 2006a, A&A, 448, 955
- Izotov et al. (2006b) Izotov Y. I., Schaerer D., Blecha A., Royer F., Guseva N. G., North P., 2006b, A&A, 459, 71
- Izotov et al. (2007) Izotov Y. I., Thuan T. X., Guseva N. G., 2007, ApJ, 671, 1297
- Leitherer et al. (1999) Leitherer C., et al., 1999, ApJS, 123, 3
- Mathews & Ferland (1987) Mathews W. G., Ferland G. J. 1987, ApJ, 323, 456
- Schaerer (1996) Schaerer D., 1996, ApJ, 467, L17
- Schaerer (2002) Schaerer D., 2002, A&A, 382, 28
- Schaerer (2003) Schaerer D., 2003, A&A, 397, 527
- Schaerer & Stasińska (1999) Schaerer D., Stasińska G., 1999, A&A, 345, L17
- Schaerer & Vacca (1998) Schaerer D., Vacca W. D. W., 1998, ApJ, 497, 618
- Shirazi & Brinchmann (2012) Shirazi M., Brinchmann J., 2012, MNRAS, 421, 1043
- Thuan & Izotov (2005) Thuan T. X., Izotov Y. I., 2005, ApJS, 161, 240
- Thuan et al. (1999) Thuan T. X., Sauvage M., Madden S., 1999, ApJ, 516, 783
- Thuan et al. (2004) Thuan T. X., Bauer F. E., Papaderos P., Izotov Y. I., 2004, ApJ, 606, 213
- Thuan et al. (2012) Thuan T. X., et al., 2012, in preparation
- Whitford (1958) Whitford A. E., 1958, AJ, 63, 201
- Wu et al. (2006) Wu Y., Charmendaris V., Hao L., Brandl B. R., Bernard-Salas J., Spoon H. W. W., Houck J. R., 1958, ApJ, 639, 157