11email: jlindberg@snm.ku.dk 22institutetext: Niels Bohr Institute, University of Copenhagen, Juliane Maries Vej 30, DK-2100 København Ø, Denmark
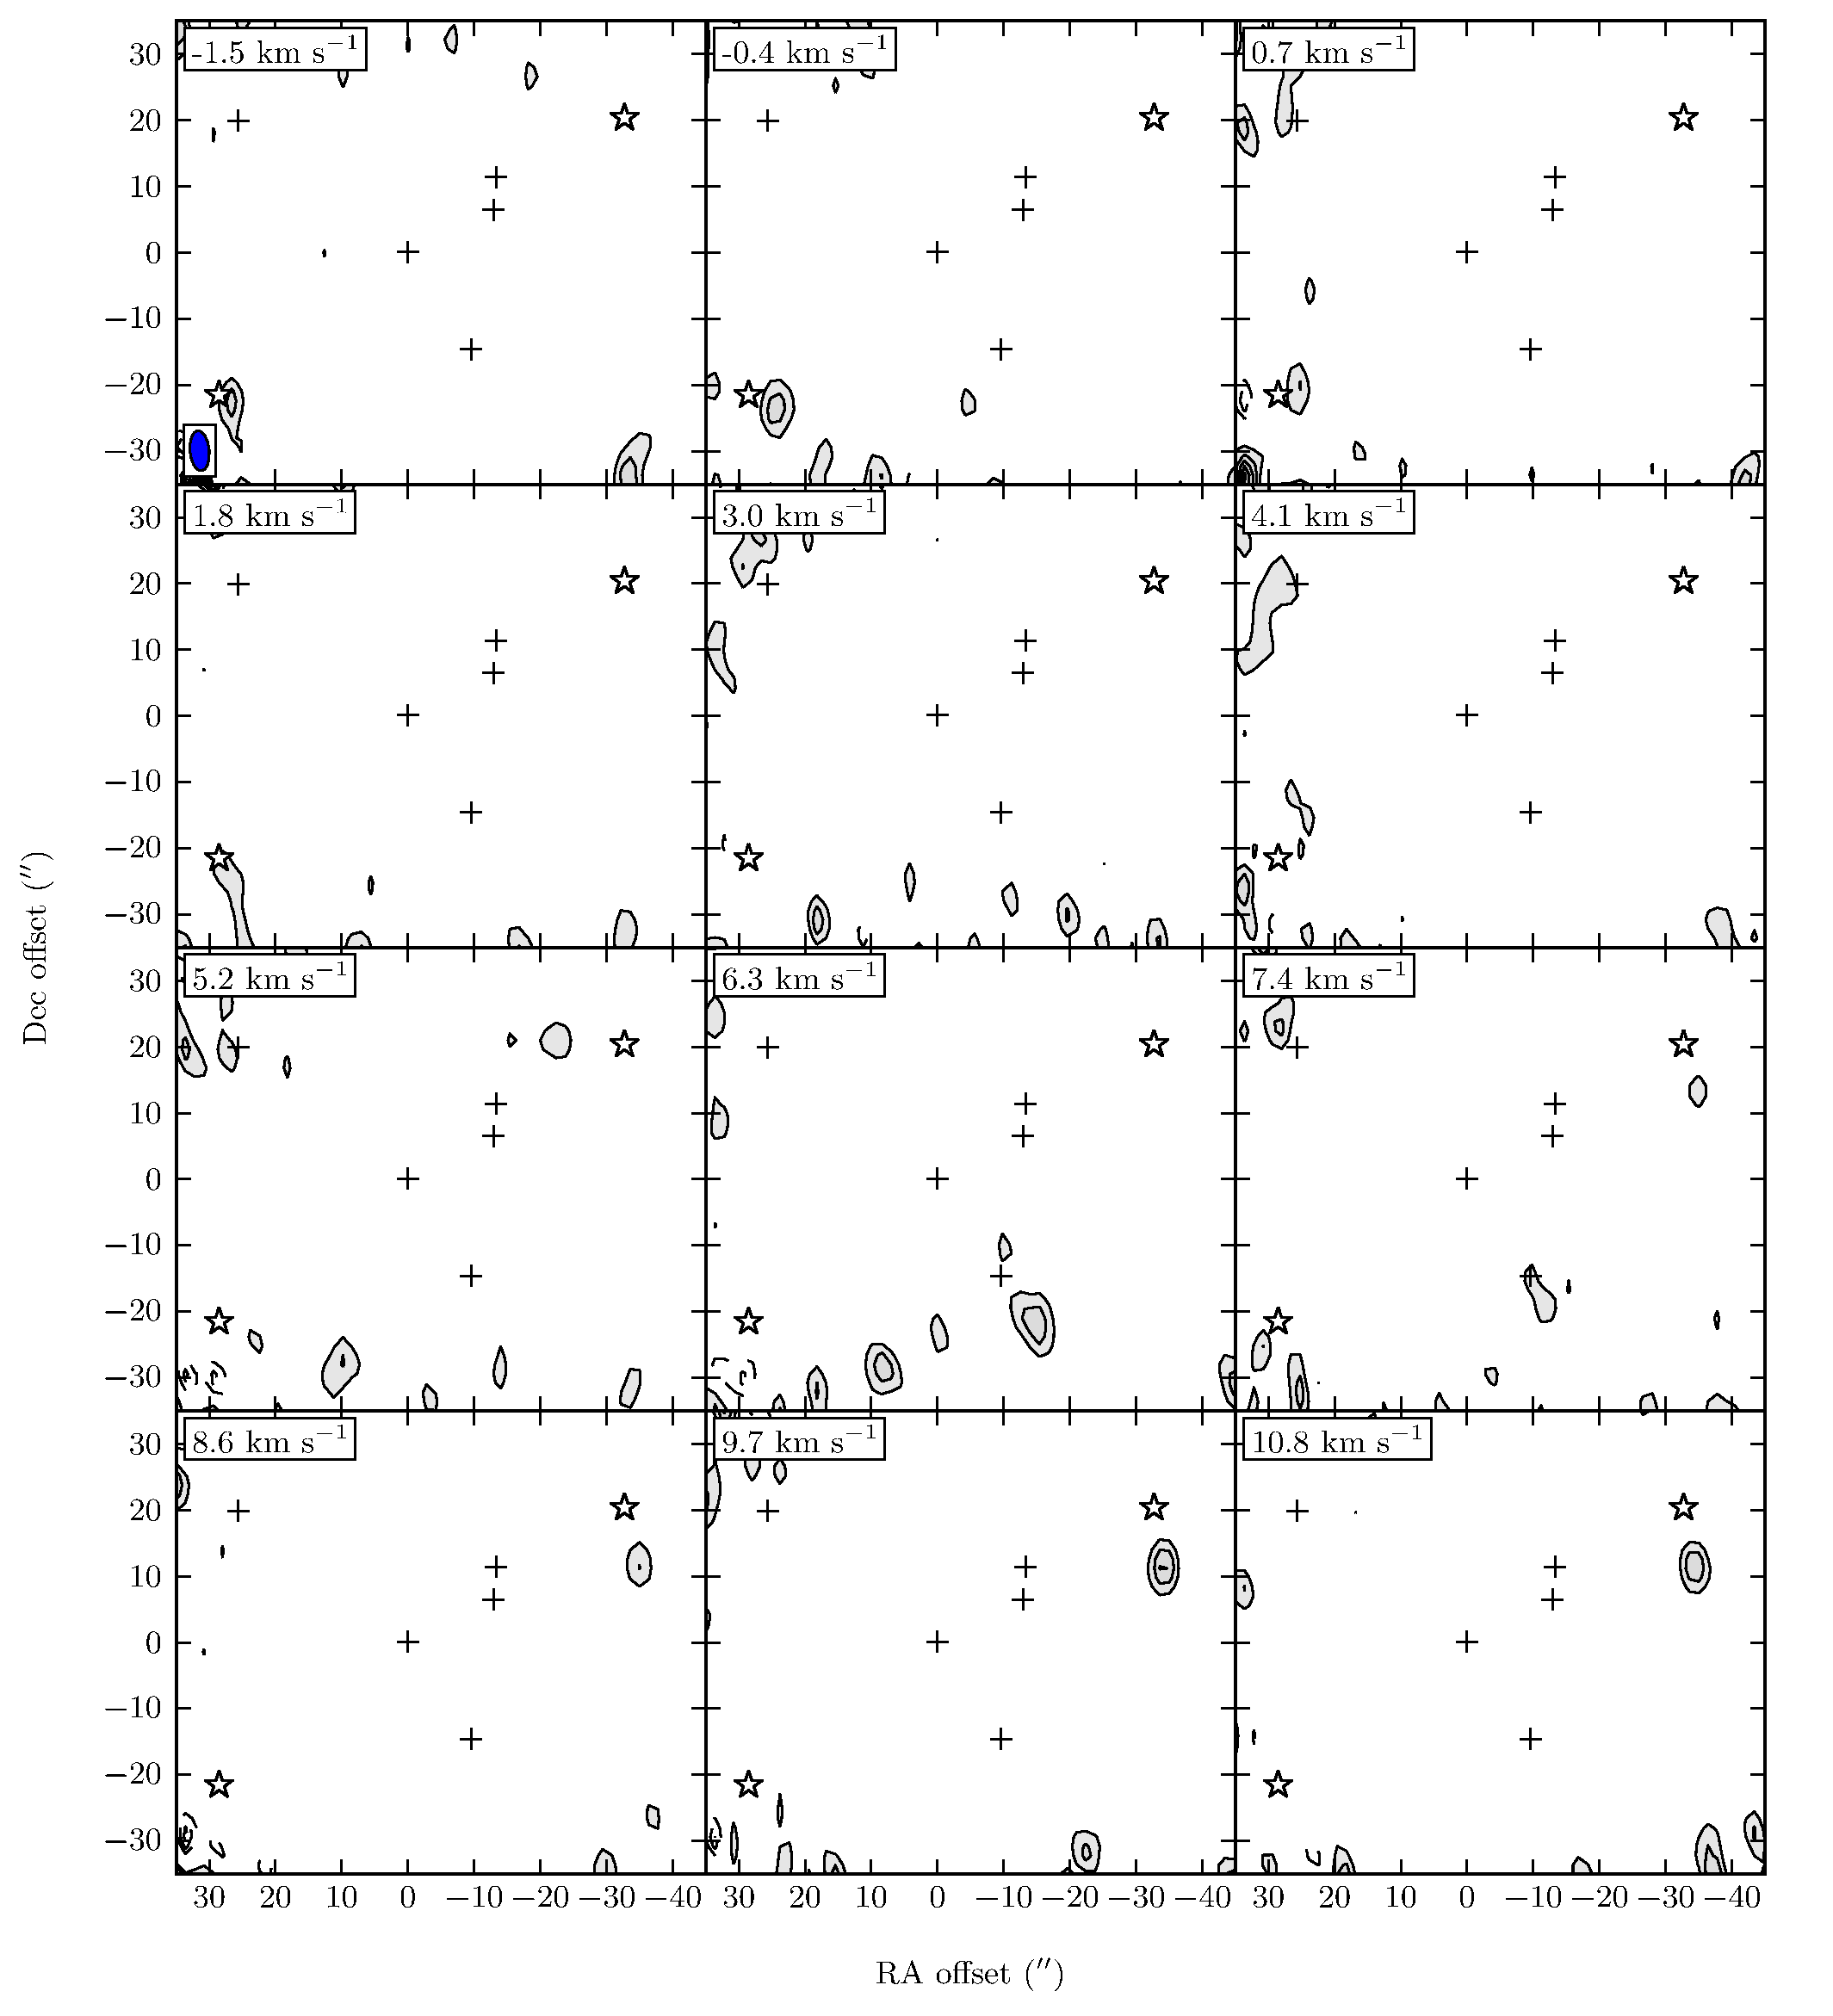
Strong irradiation of protostellar cores in Corona Australis††thanks: Full channel maps (Figs. 16–28) of the combined SMA and APEX data are available in electronic form at the CDS via anonymous ftp to cdsarc.u-strasbg.fr (130.79.128.5) or via http://cdsweb.u-strasbg.fr/cgi-bin/qcat?J/A+A/
Abstract
Context. The importance of the physical environment in the evolution of newly formed low-mass stars remains an open question. In particular, radiation from nearby more massive stars may affect both the physical and chemical structure of these kinds of young stars.
Aims. To constrain the physical characteristics of a group of embedded low-mass protostars in Corona Australis in the vicinity of the young luminous Herbig Be star R CrA.
Methods. Millimetre wavelength maps of molecular line and continuum emission towards the low-mass star forming region IRS7 near R CrA from the Submillimeter Array (SMA) and Atacama Pathfinder Experiment (APEX) are presented. The maps show the distribution of 18 lines from 7 species (H2CO, CH3OH, HC3N, c-C3H2, HCN, CN and SiO) on scales from 3″ to 60″ (400–8 000 AU). Using a set of H2CO lines, we estimate the temperatures and column densities in the region using both LTE and non-LTE methods. The results are compared with 1-D radiative transfer modelling of the protostellar cores. These models constrain which properties of the central source, protostellar envelope, and surrounding radiation field can give rise to the observed line and continuum emission.
Results. Most of the H2CO emission from the regions emerges from two elongated ( AU long) narrow ( AU) ridges dominating the emission picked up in both interferometric and single-dish measurements. The temperatures inferred from the H2CO lines are no less than K and more likely 50–60 K, and the line emission peaks are offset by AU from the location of the embedded protostars. These temperatures can not be explained by the heating from the young stellar objects (YSOs) themselves. Irradiation by the nearby Herbig Be star R CrA could, however, explain these high temperatures. The elevated temperatures can in turn impact the physical and chemical characteristics of protostars, in particular, lead to enhanced abundances of typical tracers of photon dominated regions (PDRs) such as seen in single-dish line surveys of embedded protostars in the region.
Key Words.:
stars: formation – ISM: individual objects (R CrA) – ISM: molecules – radiative transfer – astrochemistry1 Introduction
Low-mass stars form when dense molecular cloud cores undergo gravitational collapse. In the very early stages (Class 0; André et al., 1993, 2000), the young star is obscured by its envelope of gas and dust. This envelope eventually dissipates, and leaves a pre-main-sequence star with a planet-forming disc. One of the interesting questions concerning the star formation process is how important the ambient environment is for the outcome, e.g. in terms of the physical and chemical properties of the emerging protostars and their discs. It is for example well-known that high-mass stars in the environment of young stellar objects (YSOs) can affect both the chemical and physical evolution of the protostars (see e.g. Tielens & Hollenbach, 1985a, b). The most well-known examples of young objects affected by highly luminous stars are the proplyds in the Orion Nebula, which were discovered in Hubble Space Telescope observations (O’Dell et al., 1993). In these sources, the luminous emission from the high-mass stars results in photoevaporation of the protoplanetary discs (Johnstone et al., 1998). In this paper, we focus on the contribution of external irradiation onto more deeply embedded sources in the Corona Australis (CrA) region.
The CrA dark cloud is one of the most nearby active star forming regions at a distance of 130 pc (Neuhäuser & Forbrich, 2008). Through multi-wavelength studies of the CrA region, Peterson et al. (2011) found 116 YSO candidates, the vast majority being Class II and Class III sources. The region around the Herbig Be star R CrA – which is also referred to as the Coronet cluster – contains the highest concentration of newly formed and young stars (Class I and earlier; Peterson et al., 2011). R CrA itself is a Herbig Be star (spectral class B5–B8; Gray et al., 2006; Bibo et al., 1992) with a mass of 3.0 (Bibo et al., 1992) and a luminosity between 100 and 166 (the lower value is a lower limit from SED estimates with incomplete data in the UV range; Bibo et al., 1992). Several dense molecular cloud cores with masses between 2 and 50 were found near the Herbig Be star R CrA in C18O SEST observations by Harju et al. (1993). The IRS7 region is located with its centre between the Herbig Be star R CrA and the T Tauri star T CrA (Taylor & Storey, 1984), 30″ ( 4 000 AU) from each of these stars, and harbours a handful of Class 0/I YSOs.
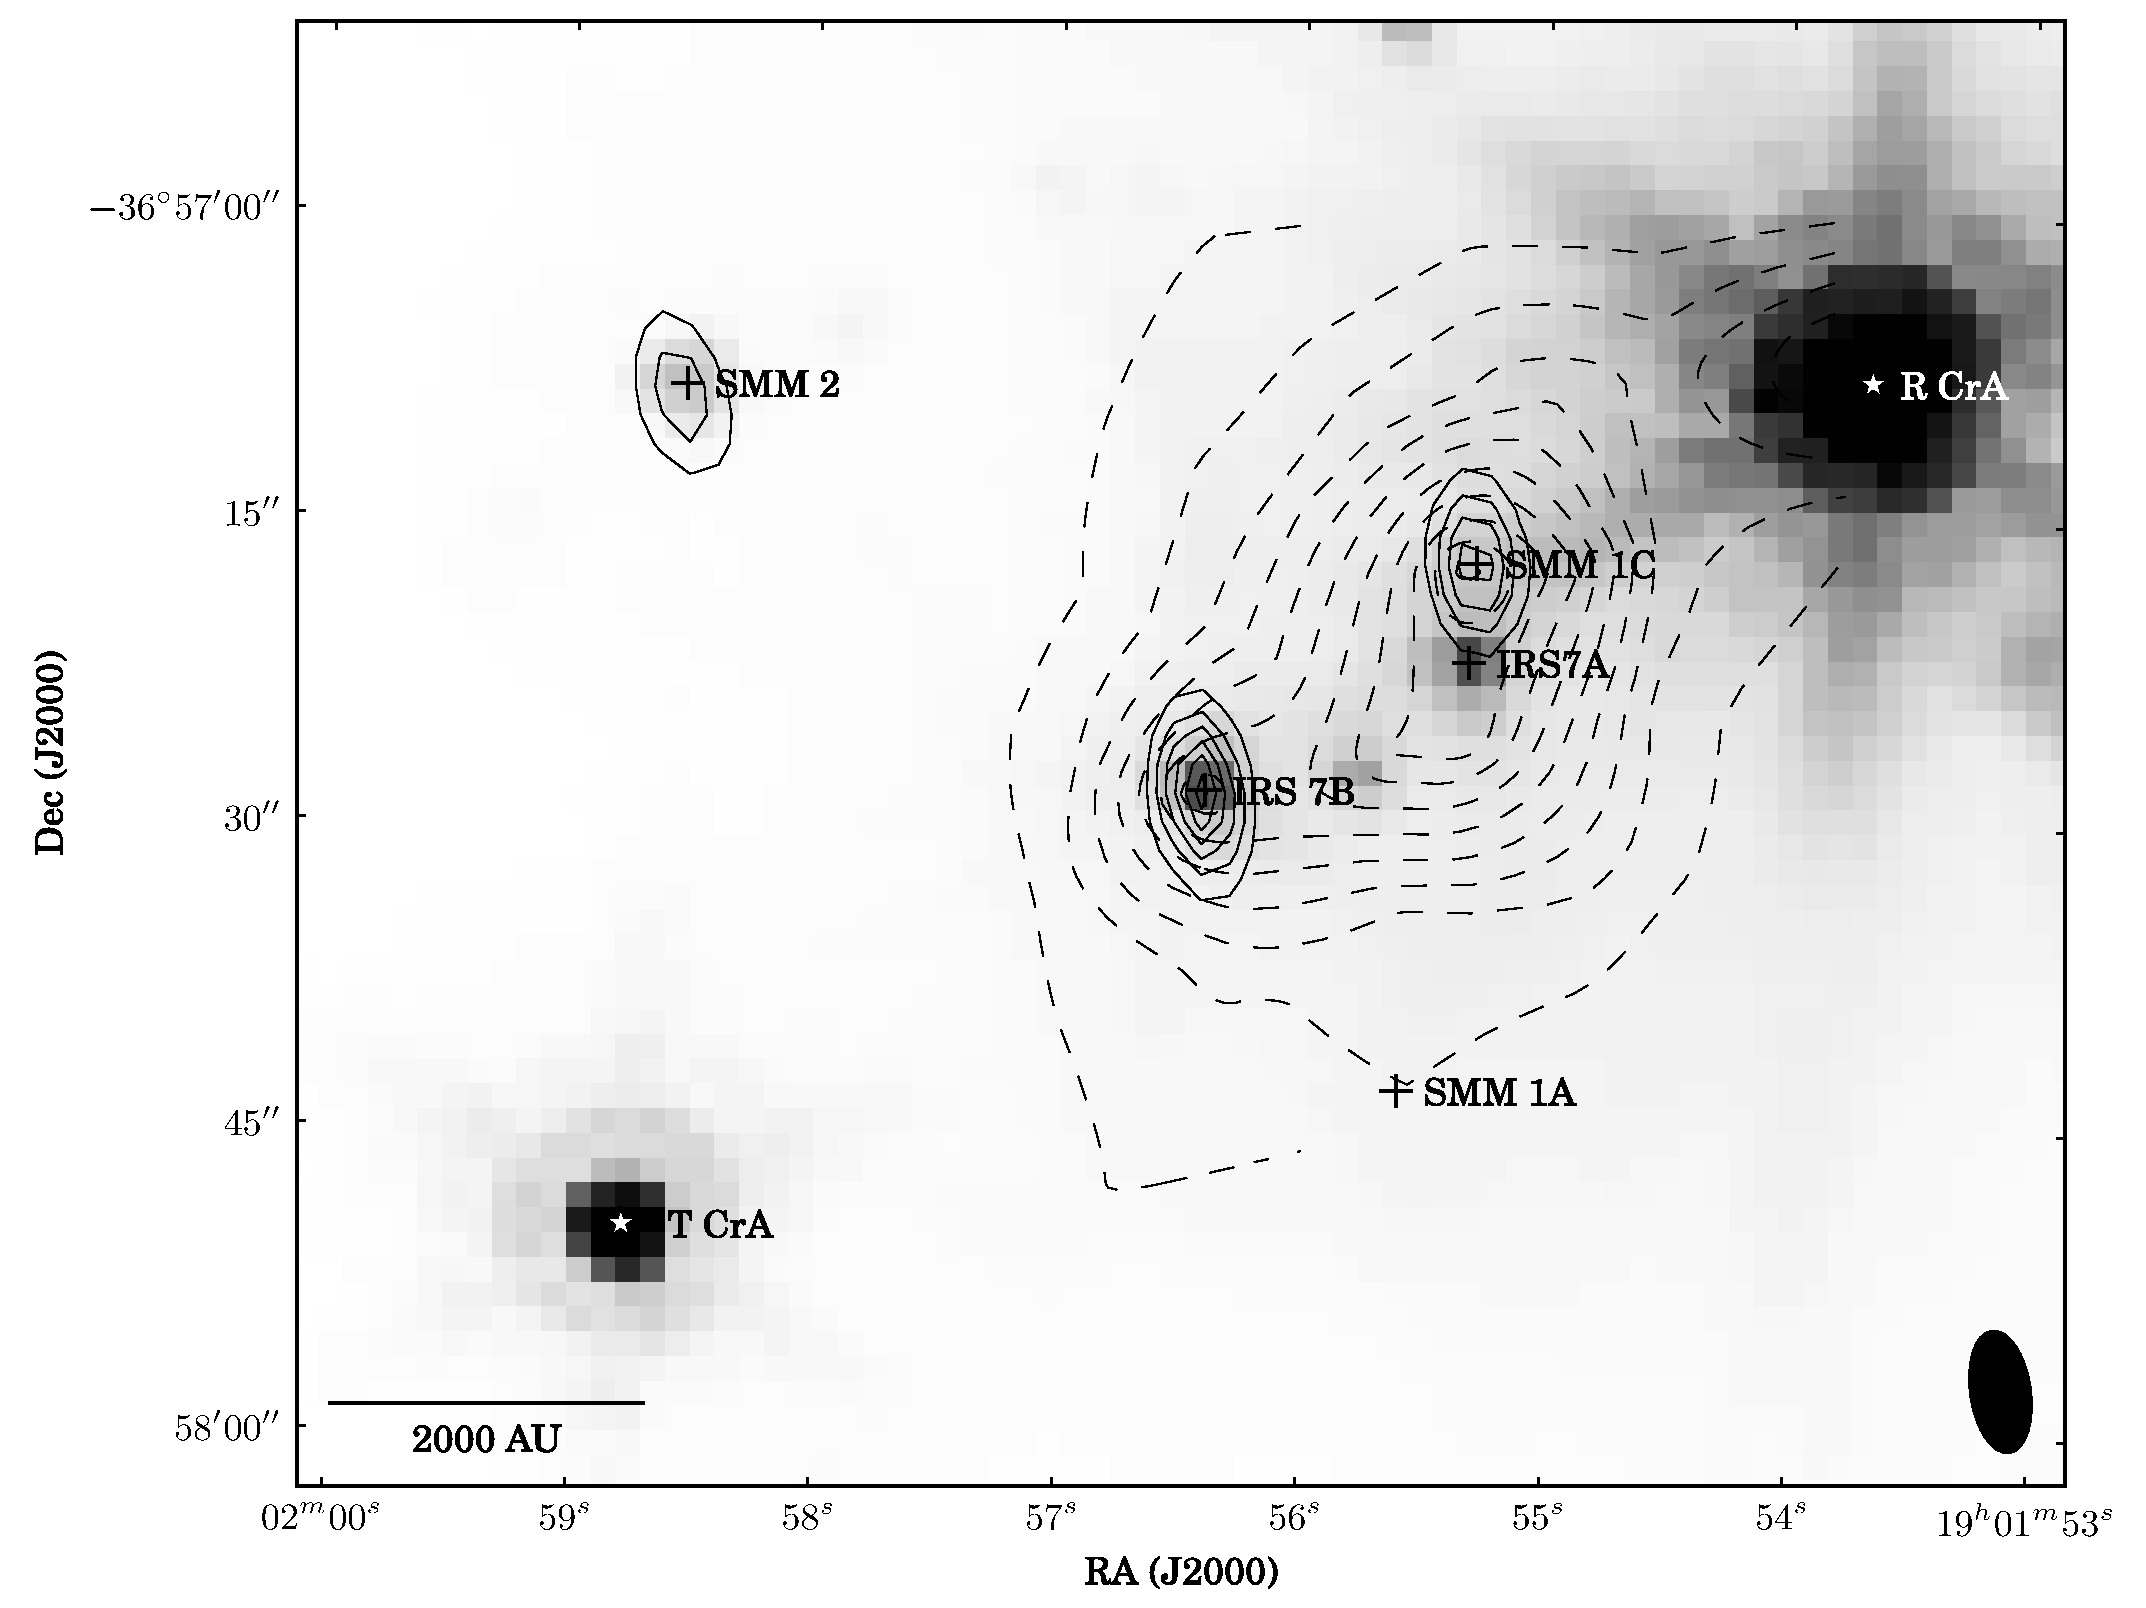
A summary of continuum point sources in the region around R CrA reported in the literature is given in Table 1. The locations of the sources are shown on Spitzer 4.5 µm (Peterson et al., 2011) image data, with Herschel 70 µm (Lindberg et al., in prep.) and SMA 1.3 mm (Chen & Arce, 2010) continuum data overplotted in Fig. 1. Using NIR photometry, Taylor & Storey (1984) found that IRS7 is the most reddened source in the R CrA region, with a visual extinction of more than 25 mag. Through VLA 6 cm observations, Brown (1987) discovered that IRS7 is of binary nature, and separated it into IRS7A and IRS7B, two apparently compact sources with a separation of 10–15″ (2 000 AU). Brown (1987) also detected a faint continuum source north of IRS7A. Miettinen et al. (2008) referred to this as Brown 9, and used 3 cm and 6 cm continuum observations to produce high-resolution high-sensitivity maps of the region. Nutter et al. (2005) studied the region in submillimetre, and detected three peaks within the region around IRS7: SMM 1B coinciding with IRS7B, SMM 1C coinciding with Brown 9, and SMM 1A south of IRS7B. Studies of millimetre continuum emission showed three compact sources, IRS7B (SMM 1B), SMM 1C, and SMM 2 (Groppi et al., 2007; Chen & Arce, 2010; Peterson et al., 2011). Groppi et al. (2007) used Spitzer IRAC data, SCUBA 450 µm and 850 µm, and SMA 1.1 mm data to study the SEDs of IRS7B (SMA1) and SMM 1C (SMA2; not detected in the Spitzer data). They suggested that IRS7B is a transitional Class 0/I object, whereas SMM 1C likely is a Class 0 source. IRS7A shows strong mid-IR emission (Spitzer), but is not detected in the (sub-)millimetre. Based on their IR and sub-millimetre SEDs, Peterson et al. (2011) suggested that IRS7A and SMM 2 are Class I young stellar objects. SMM 1A is suggested to be a prestellar core (Chen & Arce, 2010).
Compared to other typical embedded protostars IRS7B has a fairly rich line spectrum and is of interest as a possible astrochemical laboratory. Detailed studies of the chemistry of IRS7B have been made possible with a new generation of southern hemisphere submillimetre telescopes such as Atacama Pathfinder Experiment (APEX) (Schöier et al., 2006) and Atacama Submillimeter Telescope Experiment (ASTE) (Watanabe et al., 2012). Watanabe et al. performed a full line scan of IRS7B in the 345 GHz submillimetre window using ASTE, and found H2CO and CH3OH, two molecules typical for a chemistry dominated by evaporation of icy grain mantles at temperatures higher than 90–100 K (see e.g. Bottinelli et al., 2004a, b; Ceccarelli et al., 2007), but also species indicative of a warm carbon-chain chemistry (CCH and c-C3H2; Sakai et al., 2009a, b). Watanabe et al. suggest that IRS7B could be an intermediate-type source between the typical “hot corinos” and “warm carbon-chain chemistry sources”. However, a different possibility could be that the observed chemical composition is a result of photodissociation caused by bright FUV radiation from the nearby star R CrA further underscoring the importance of understanding the properties of the protostar’s environment.
In this paper we present high angular resolution millimetre maps of the line emission in the region surrounding R CrA IRS7 and aim to quantify the possible physical and chemical impact of the irradiation by the Herbig Be star R CrA. The paper is laid out as follows: Sect. 2 describes the details of the observations and reduction techniques. Sect. 3 shows the results of these observations. These results are then analysed with LTE and non-LTE modelling in Sect. 4. Finally, Sect. 5 discusses the implications of the derived physical and chemical properties.
| Source name | RA | Dec | Other namesa𝑎aa𝑎aReferences: (1) Peterson et al. (2011), (2) Groppi et al. (2007), (3) Choi et al. (2008), (4) Miettinen et al. (2008), (5) Forbrich et al. (2006), (6) Nutter et al. (2005), (7) Chen & Arce (2010). | Coordinate referenceb𝑏bb𝑏bThe coordinates come from SMA and Spitzer continuum reported in Peterson et al. (2011). |
|---|---|---|---|---|
| (J2000.0) | (J2000.0) | |||
| SMM 1C | 19:01:55.29 | 36:57:17.0 | SMA 2 (1,2), B9 (3), Brown 9 (4) | SMA |
| IRS7A | 19:01:55.32 | 36:57:21.9 | IRS7W (5), IRS7 (2,6) | Spitzer |
| IRS7B | 19:01:56.40 | 36:57:28.3 | SMM 1B (6,7), SMA 1 (2), IRS7E (5) | SMA |
| SMM 2 | 19:01:58.54 | 36:57:08.5 | CrA-43 (1), WMB 55 (3,6) | Spitzer |
| R CrA | 19:01:53.67 | 36:57:08.0 | – | Spitzer |
2 Observations
2.1 SMA 1.3 mm observations
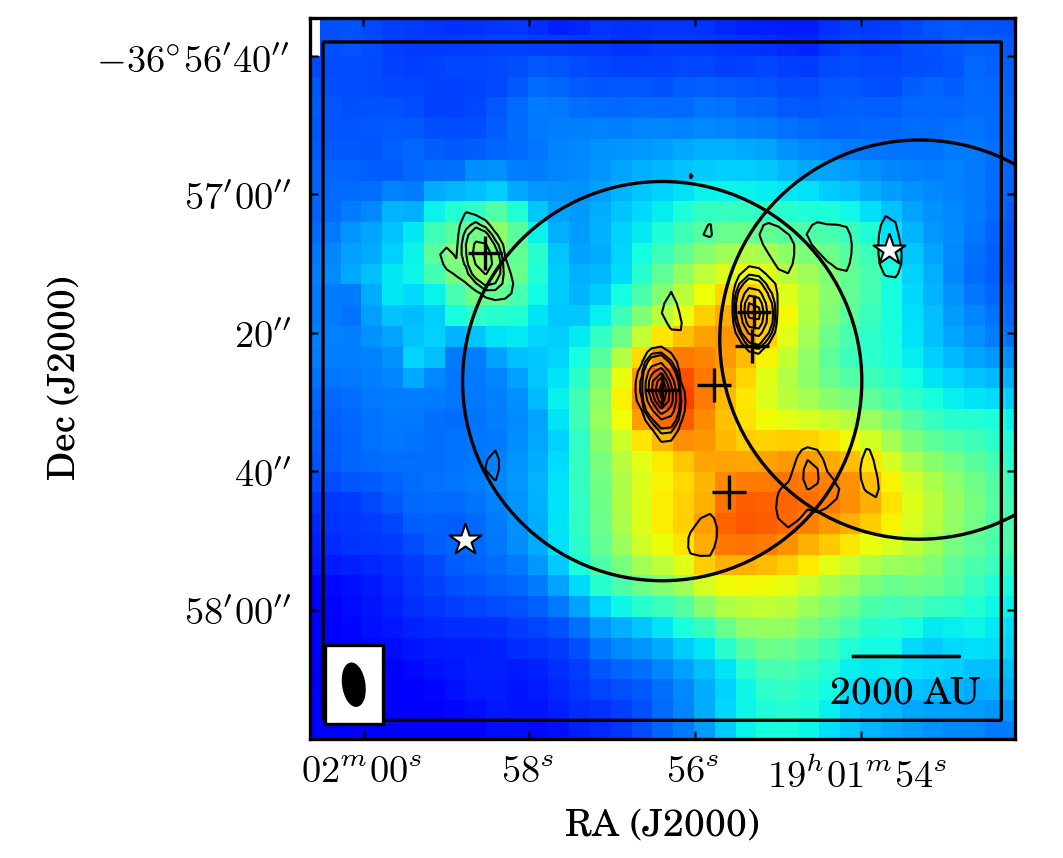
The region around IRS7A, IRS7B (SMM 1B), SMM 1C, SMM 1A, and R CrA was observed at 1.3 mm using the Submillimeter Array (SMA; Ho et al. 2004)222The Submillimeter Array is a joint project between the Smithsonian Astrophysical Observatory and the Academia Sinica Institute of Astronomy and Astrophysics and is funded by the Smithsonian Institution and the Academia Sinica. in its compact configuration on 20 August 2006. Six antennae were in the array covering baselines from 5–50 k. The region was covered by two pointings, one located on IRS7B, and one south of R CrA. Each of the two pointings covers a circular area with a diameter of about 7 500 AU dictated by the SMA primary beam size of 58″, but the two pointings overlap somewhat. The exact coordinates of the pointings can be found in Table 2. The SMA 1.3 mm continuum is overplotted on the SCUBA 850 µm continuum (Nutter et al., 2005) together with the SMA primary beams at the wavelength of the observations in Fig. 2.
Both pointings were observed with the lower sideband covering 216.849–218.831 GHz, and the upper sideband covering 226.849–228.831 GHz. The SMA correlator was configured to give uniform spectral coverage over each of these 2 GHz bandwidths. The resulting frequency resolution of 0.81 MHz corresponds to a velocity resolution of 1.1 km s-1 at the observed frequencies. The data were calibrated using the MIR package (Qi, 2012) dedicated to SMA observations. The complex gains were calibrated through observations of the quasar 1924–292 with the bandpass and absolute levels calibrated through observations of the strong quasar 3c454.3 and Uranus. The resulting synthetic beam size of the observations was ″″ with a position angle of 5.3°.
Further imaging of the data was performed with the MIRIAD package (Sault et al., 1995). First, a linear fit to the continuum was subtracted from the files. The sky brightness distribution was then produced from an inverse Fourier transform of the data sets, and consecutively CLEANed. Finally, the data from the two separate pointings were combined by use of the linmos (linear mosaic) task. The 1.3 mm continuum data were produced by averaging the data across both SMA sidebands. The contribution from the strong line emission was estimated to be less than in the observed continuum peaks (including SMM 1A). Previous papers by Chen & Arce (2010) and Peterson et al. (2011) have discussed the continuum data from these observations separately; here we focus predominantly on the line observations.
The SMA line data were subsequently combined with APEX short-spacing data (see below).
| Telescope | R.A. | Dec. | Line data |
| Region | (J2000.0) | (J2000.0) | [GHz] |
| SMA | |||
| IRS7A | 19:01:53.30 | 36:57:21.0 | 217.81.0 |
| IRS7A | 19:01:53.30 | 36:57:21.0 | 227.81.0 |
| IRS7B | 19:01:56.40 | 36:57:27.0 | 217.81.0 |
| IRS7B | 19:01:56.40 | 36:57:27.0 | 227.81.0 |
| APEX | |||
| IRS7Ba𝑎aa𝑎a pointings in an equatorial grid centred at the tabulated coordinate. The separation between the grid points is 14″. | 19:01:56.40 | 36:57:27.0 | 217.90.9 |
2.2 APEX 1.3 mm observations
To study the extended molecular emission in the region, short-spacing data for the SMA observations were obtained with APEX444The Atacama Pathfinder EXperiment (APEX) telescope is a collaboration between the Max Planck Institute for Radio Astronomy, the European Southern Observatory, and the Onsala Space Observatory. The region was observed in a pointing pattern centred at IRS7B, covering most of the SMA primary beams (Fig.2; the westernmost part of the region covered by SMA was not covered in the APEX map, since no signal was detected in the SMA maps at those positions) in the frequency range between 216.951 GHz and 218.849 GHz (corresponding to the SMA lower sideband). The beam size of the APEX telescope at these frequencies is 28.6″, and the individual pointings were therefore separated by 14″ to give a fully Nyquist-sampled map. The frequency resolution of the APEX observations (0.12 MHz) corresponds to a velocity resolution of 0.17 km s-1.
The APEX data were reduced with the GILDAS CLASS package555GILDAS CLASS (Continuum and Line Analysis Single-dish Software) is developed by the IRAM institute, Grenoble, France: http://www.iram.fr/IRAMFR/GILDAS. Sinusoidal or, in some cases, polynomial (), baselines were carefully calculated and subtracted. The data were then exported to FITS format, to allow for import of the data to MIRIAD.
The APEX data were smoothed to match the velocity resolution of the SMA data with the regrid task in MIRIAD. The two data sets were then combined with the MIRIAD immerge task, which linearly merges two sets of data with different spatial resolution (i.e. applies short-spacing corrections from the single-dish data onto the interferometry data). In the combination, primary beam correction was applied, which amplifies the noise towards the edges of the primary beam. The estimated errors in figures in this paper are calculated at the edges of the primary beams. However, in the estimates of fluxes in individual positions in the maps, the RMS noise in that particular point has been used for the error analysis.
This linear method (immerge in MIRIAD) of combining single-dish and interferometry data was chosen in favour of the non-linear alternative (mosmem in MIRIAD). The reason for this is that the separation between the two SMA pointings is greater than 0.5 times the primary beam FWHM, making the mosaic somewhat undersampled. The non-linear method would thus risk to amplify noise, in particular near the primary beam edges. A comparison between the two methods also showed this, with flux differences of less than in the inner parts of the primary beam, but the non-linear method over-estimating the signal close to the primary beam edges.
2.3 Spitzer, JCMT/SCUBA, and Herschel data
In addition to the described SMA and APEX observations we utilise continuum maps from mid- and far-infrared space-based observations from the Spitzer Space Telescope (Peterson et al., 2011) and Herschel Space Observatory (Lindberg et al., in prep.) as well as ground-based submillimetre observations from the SCUBA camera at the James Clerk Maxwell Telescope (Nutter et al., 2005).
3 Results
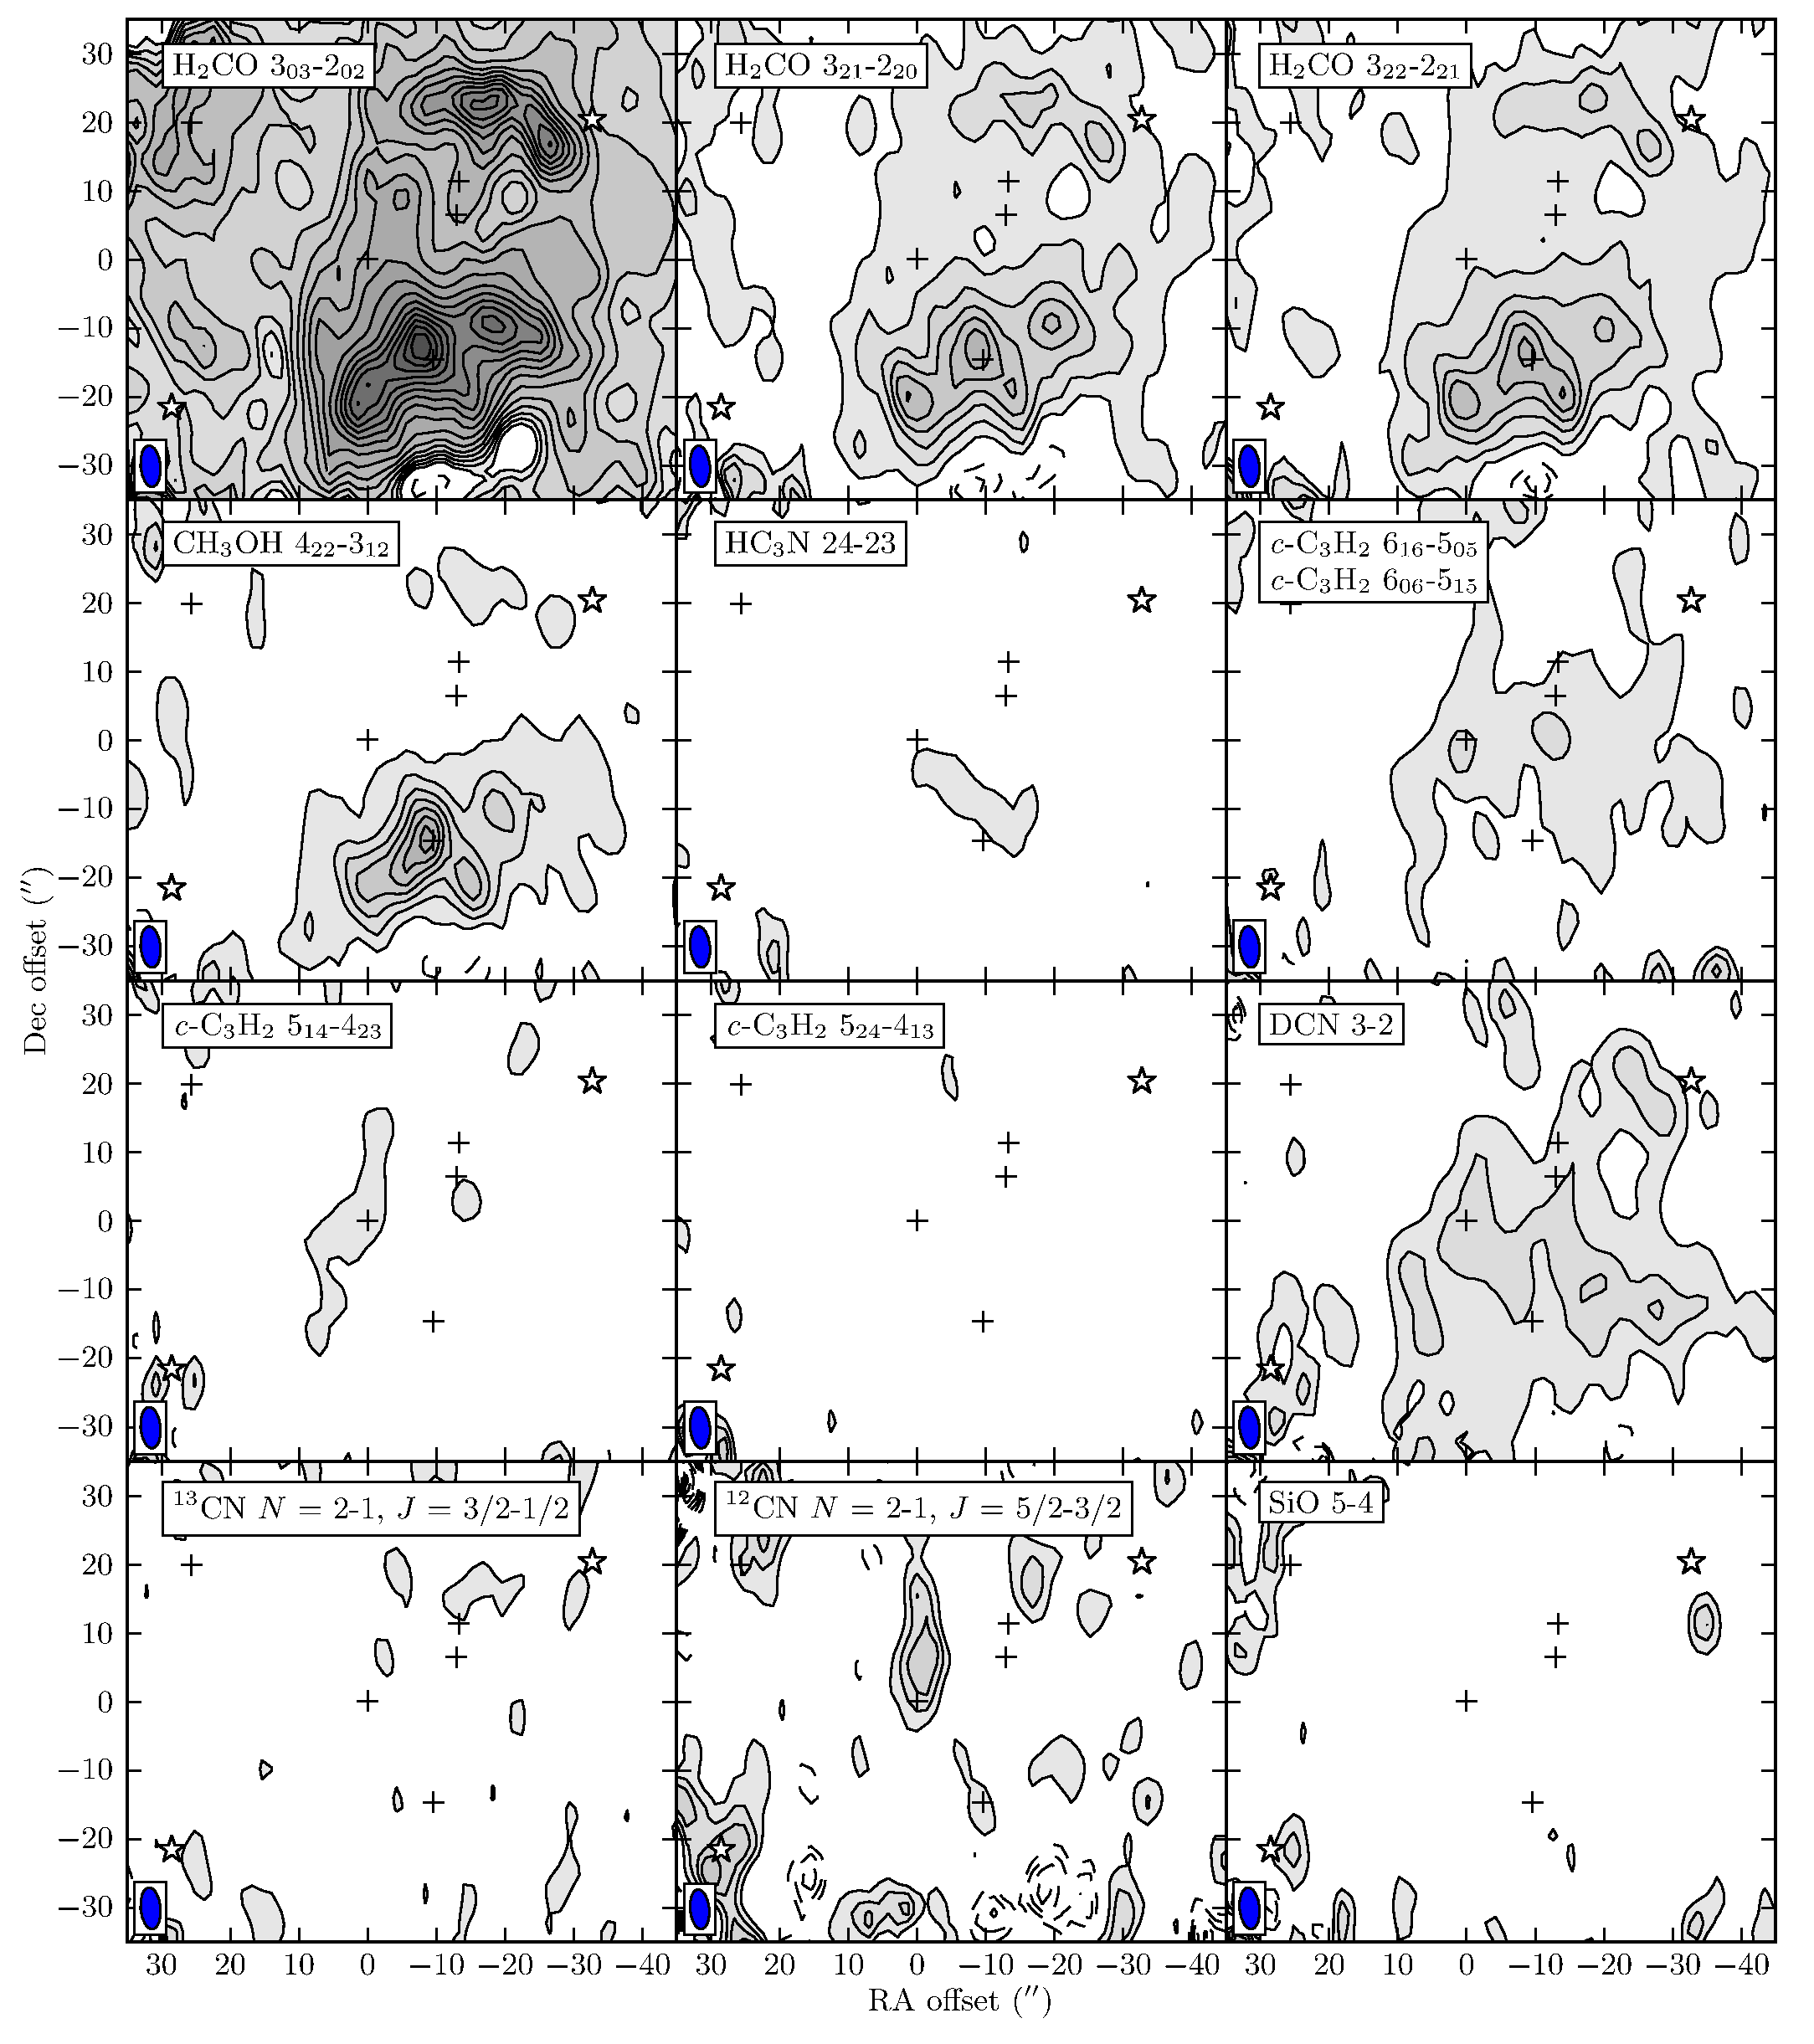
Eighteen spectral lines from seven molecular species were detected in the 216.8–218.8 GHz and 226.8–228.8 GHz SMA data. The detected species are H2CO, CH3OH, c-C3H2, HC3N, DCN, CN (both 12CN and 13CN), and SiO (see Table 3). Most of these lines, in particular the H2CO and CH3OH lines, show very extended emission, which in most cases does not coincide with any of the bright compact continuum sources associated with the main YSOs, but does align with e.g. the SCUBA peak SMM 1A, south of the suggested YSOs and is also detected in a region between R CrA and IRS7.666Note that Chen & Arce (2010) report that no molecular line emission from SMM 1A is seen in the same data; contrasting what is seen in the results presented here from our reduction of the data.
| Species | Transition | Frequencya𝑎aa𝑎aFrequencies and energies were acquired from the CDMS database (Müller et al., 2001), except for the c-C3H2 data, which are from the JPL database (Pickett et al., 1998). | a𝑎aa𝑎aFrequencies and energies were acquired from the CDMS database (Müller et al., 2001), except for the c-C3H2 data, which are from the JPL database (Pickett et al., 1998). | |
| [GHz] | [K] | |||
| SiO | = 5–4 | 217.10498 | 31.26 | |
| DCN | = 3–2 | 217.23854 | 20.85 | |
| 13CN | = 2–1, = 3/2–1/2b𝑏bb𝑏b = 1–0, = 0–1 | 217.26464 | 15.66 | |
| 13CN | = 2–1, = 5/2–3/2c𝑐cc𝑐cBlend of = 3–2, = 4–3; = 3–2, = 3–2; and = 3–2, = 2–1. | 217.46715 | 15.68 | |
| c-C3H2d𝑑dd𝑑dThis is a blend of two c-C3H2 lines. | 616–505 | \ldelim{22.5mm[] | 217.82215 | 38.61 |
| c-C3H2d𝑑dd𝑑dThis is a blend of two c-C3H2 lines. | 606–515 | 217.82215 | 38.61 | |
| c-C3H2 | 514–423 | 217.94005 | 35.42 | |
| c-C3H2 | 524–413 | 218.16044 | 35.42 | |
| H2CO | 303–202 | 218.22219 | 20.96 | |
| HC3N | = 24–23 | 218.32472 | 130.98 | |
| CH3OH | 422–312 | 218.44005 | 31.60 | |
| H2CO | 322–221 | 218.47563 | 68.09 | |
| H2CO | 321–220 | 218.76007 | 68.11 | |
| 12CNe𝑒ee𝑒eOnly SMA data are available for these lines. | = 2–1, = 5/2–3/2f𝑓ff𝑓fBlend of = 5/2–3/2, = 7/2–5/2, and = 3/2–1/2. | 226.87478 | 11.35 | |
| 12CNe𝑒ee𝑒eOnly SMA data are available for these lines. | = 2–1, = 5/2–3/2g𝑔gg𝑔g = 3/2–3/2. | 226.88742 | 11.35 | |
| 12CNe𝑒ee𝑒eOnly SMA data are available for these lines. | = 2–1, = 5/2–3/2hℎhhℎh = 5/2–5/2. | 226.89213 | 11.35 | |
| c-C3H2e𝑒ee𝑒eOnly SMA data are available for these lines. | 432–321 | 227.16913 | 29.07 | |
| HC3Ne𝑒ee𝑒eOnly SMA data are available for these lines. | = 25–24 | 227.41890 | 141.90 |
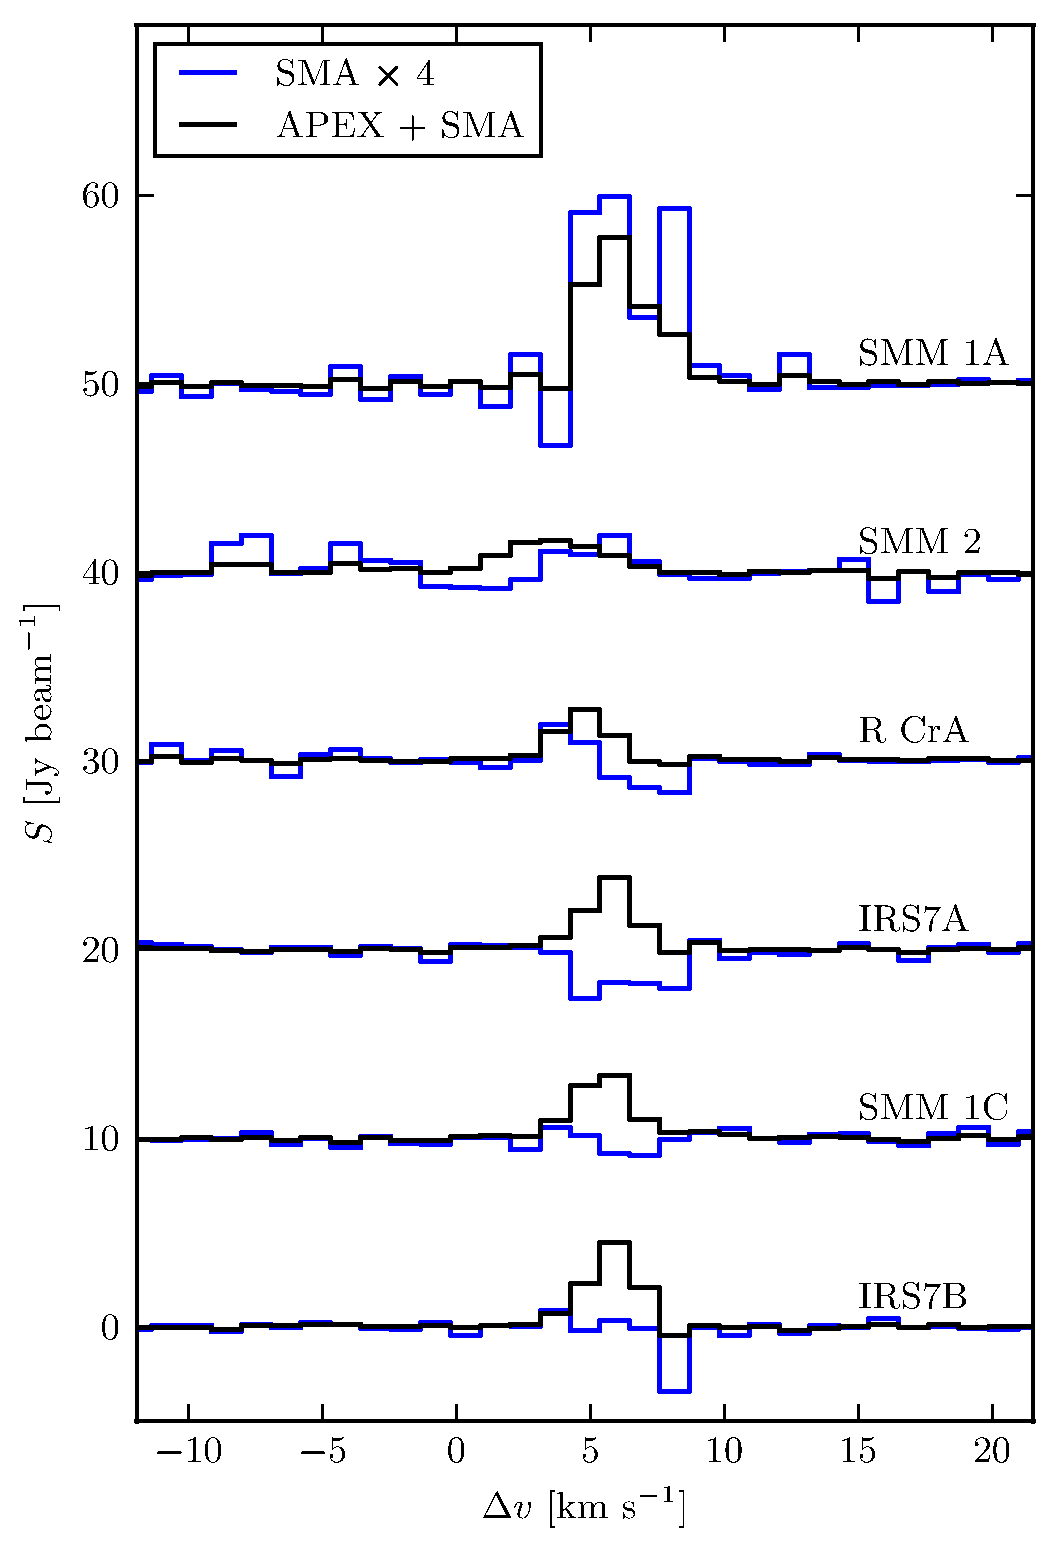
In Fig. 3, the integrated intensity maps of the H2CO 303–202 line using SMA data, APEX data, and the combined data set are compared. The bulk of the emission is extended and thus completely resolved-out in the pure interferometry data. Combining the SMA data with the large-scale APEX maps is therefore critical in order to derive quantitative numbers from the data set. All 12 spectral lines detected in the SMA 216.8–218.8 GHz band were also detected in the APEX data. The SMA and APEX data were combined following the methods described in Weiß et al. (2001) and Takakuwa et al. (2003) (see also Sect. 2.2). In Fig. 4, the pure interferometry fluxes and the short-spacing-corrected fluxes of the H2CO 303–202 line from six positions in the interferometry map are compared. The pure interferometry lines are not only fainter, they also show absorption in several positions, since the real fluxes in those positions are lower than the average of the extended flux in the field. Typically, less than of the peak flux is recovered in the interferometry data.

Contours are at 2.5 Jy beam-1 km s-1 levels (converted to SMA beams, at the edge of the SMA primary beam) in all three maps. Negative intensities are represented by dashed contours. Coordinates are offsets from the central position of IRS7B. Refer to Fig.1 for a guide to the symbols used for the compact objects.
| Spectral line | Contour level | |
| [km s-1] | [Jy beam-1km s-1] | |
| H2CO 303–202 | 1.46 | |
| H2CO 321–220 | 1.03 | |
| H2CO 322–221 | 1.15 | |
| CH3OH 422–312 | 1.03 | |
| HC3N = 24–23 | 0.89 | |
| c-C3H2 616–505, 606–515 | 0.89 | |
| c-C3H2 514–423 | 0.73 | |
| c-C3H2 524–413 | 0.73 | |
| 13CN = 2–1, = 3/2–1/2a𝑎aa𝑎a = 1–0, = 0–1. | 0.90 | |
| DCN = 3–2 | 0.73 | |
| SiO = 5–4 | 1.80 | |
| 12CN = 2–1, = 5/2–3/2b𝑏bb𝑏bBlend of = 5/2–3/2, = 7/2–5/2, and = 3/2–1/2. | 1.22 |
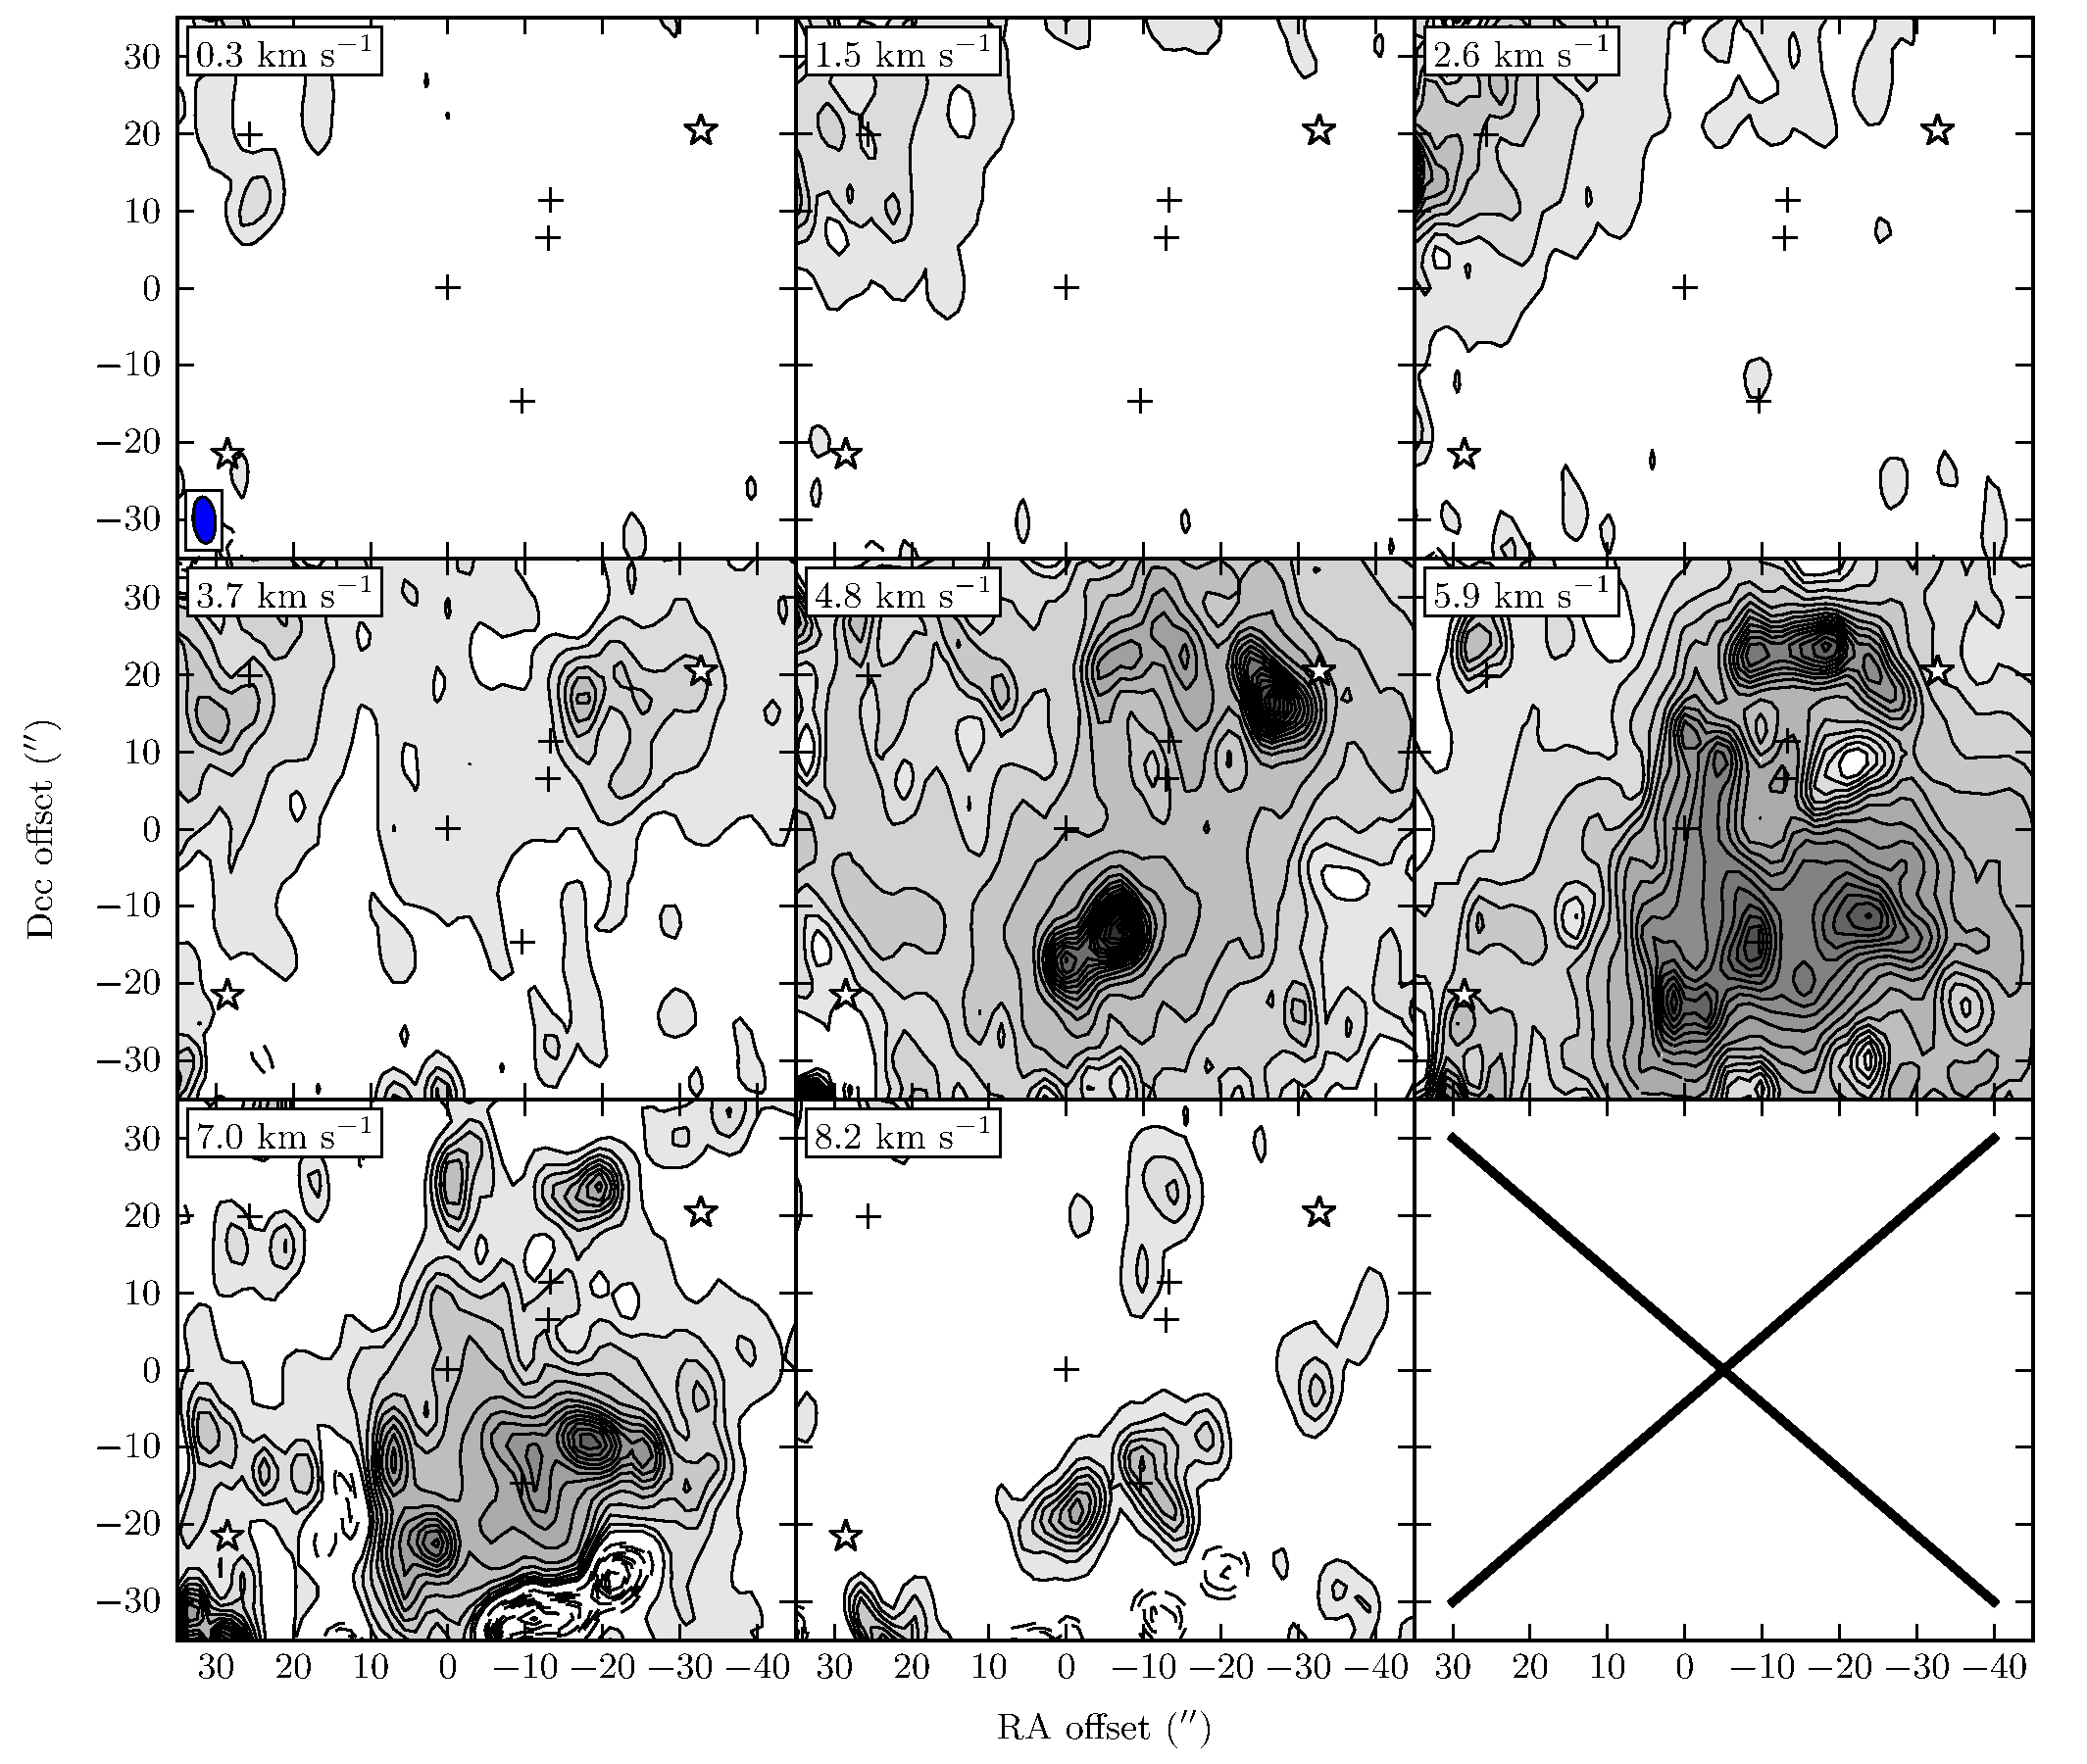
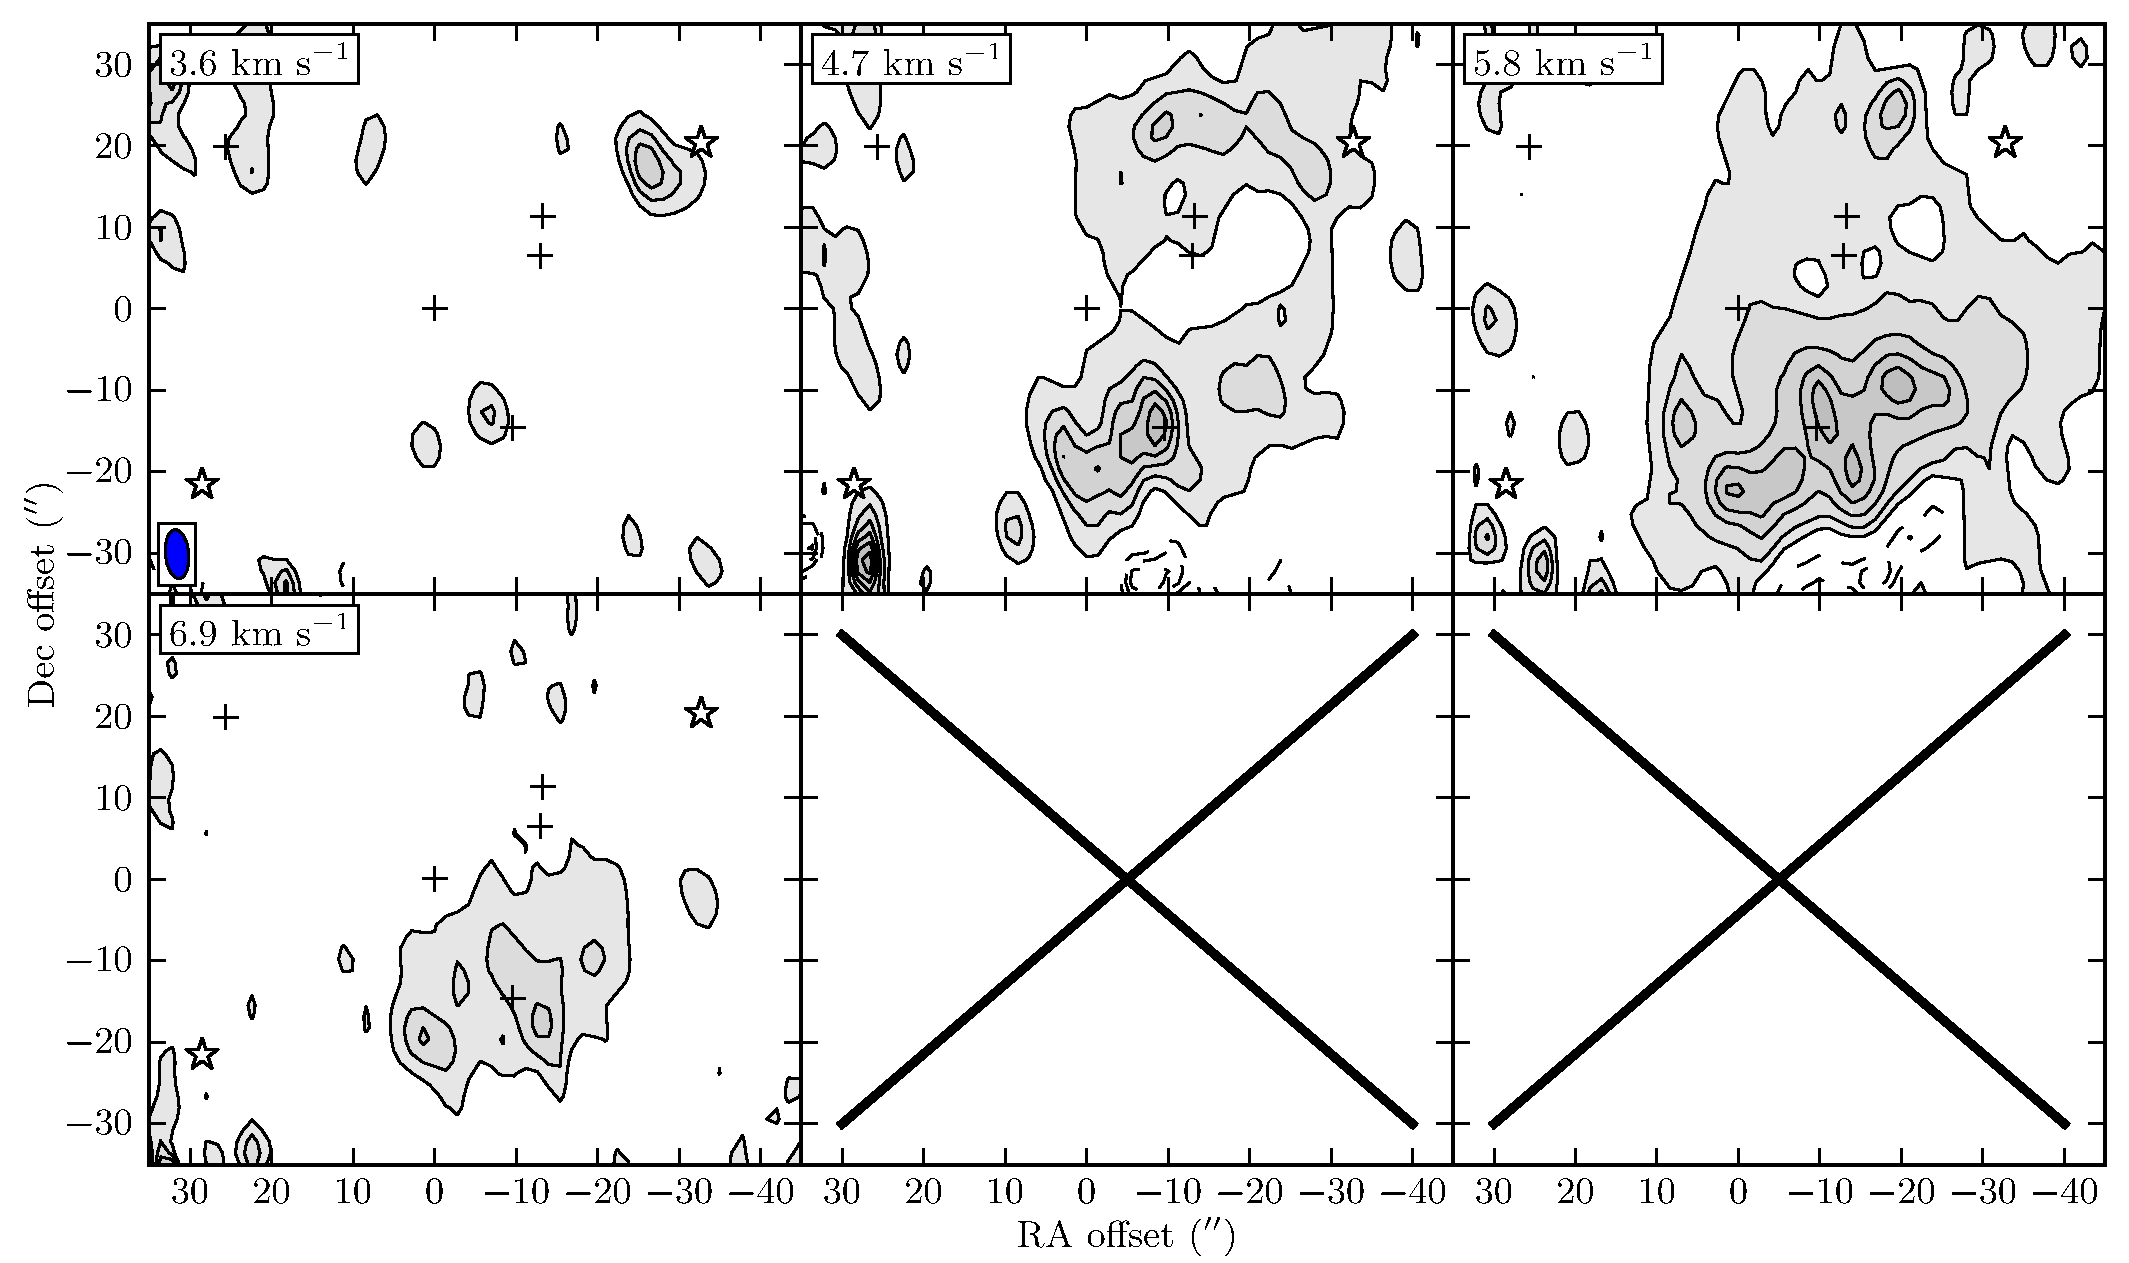
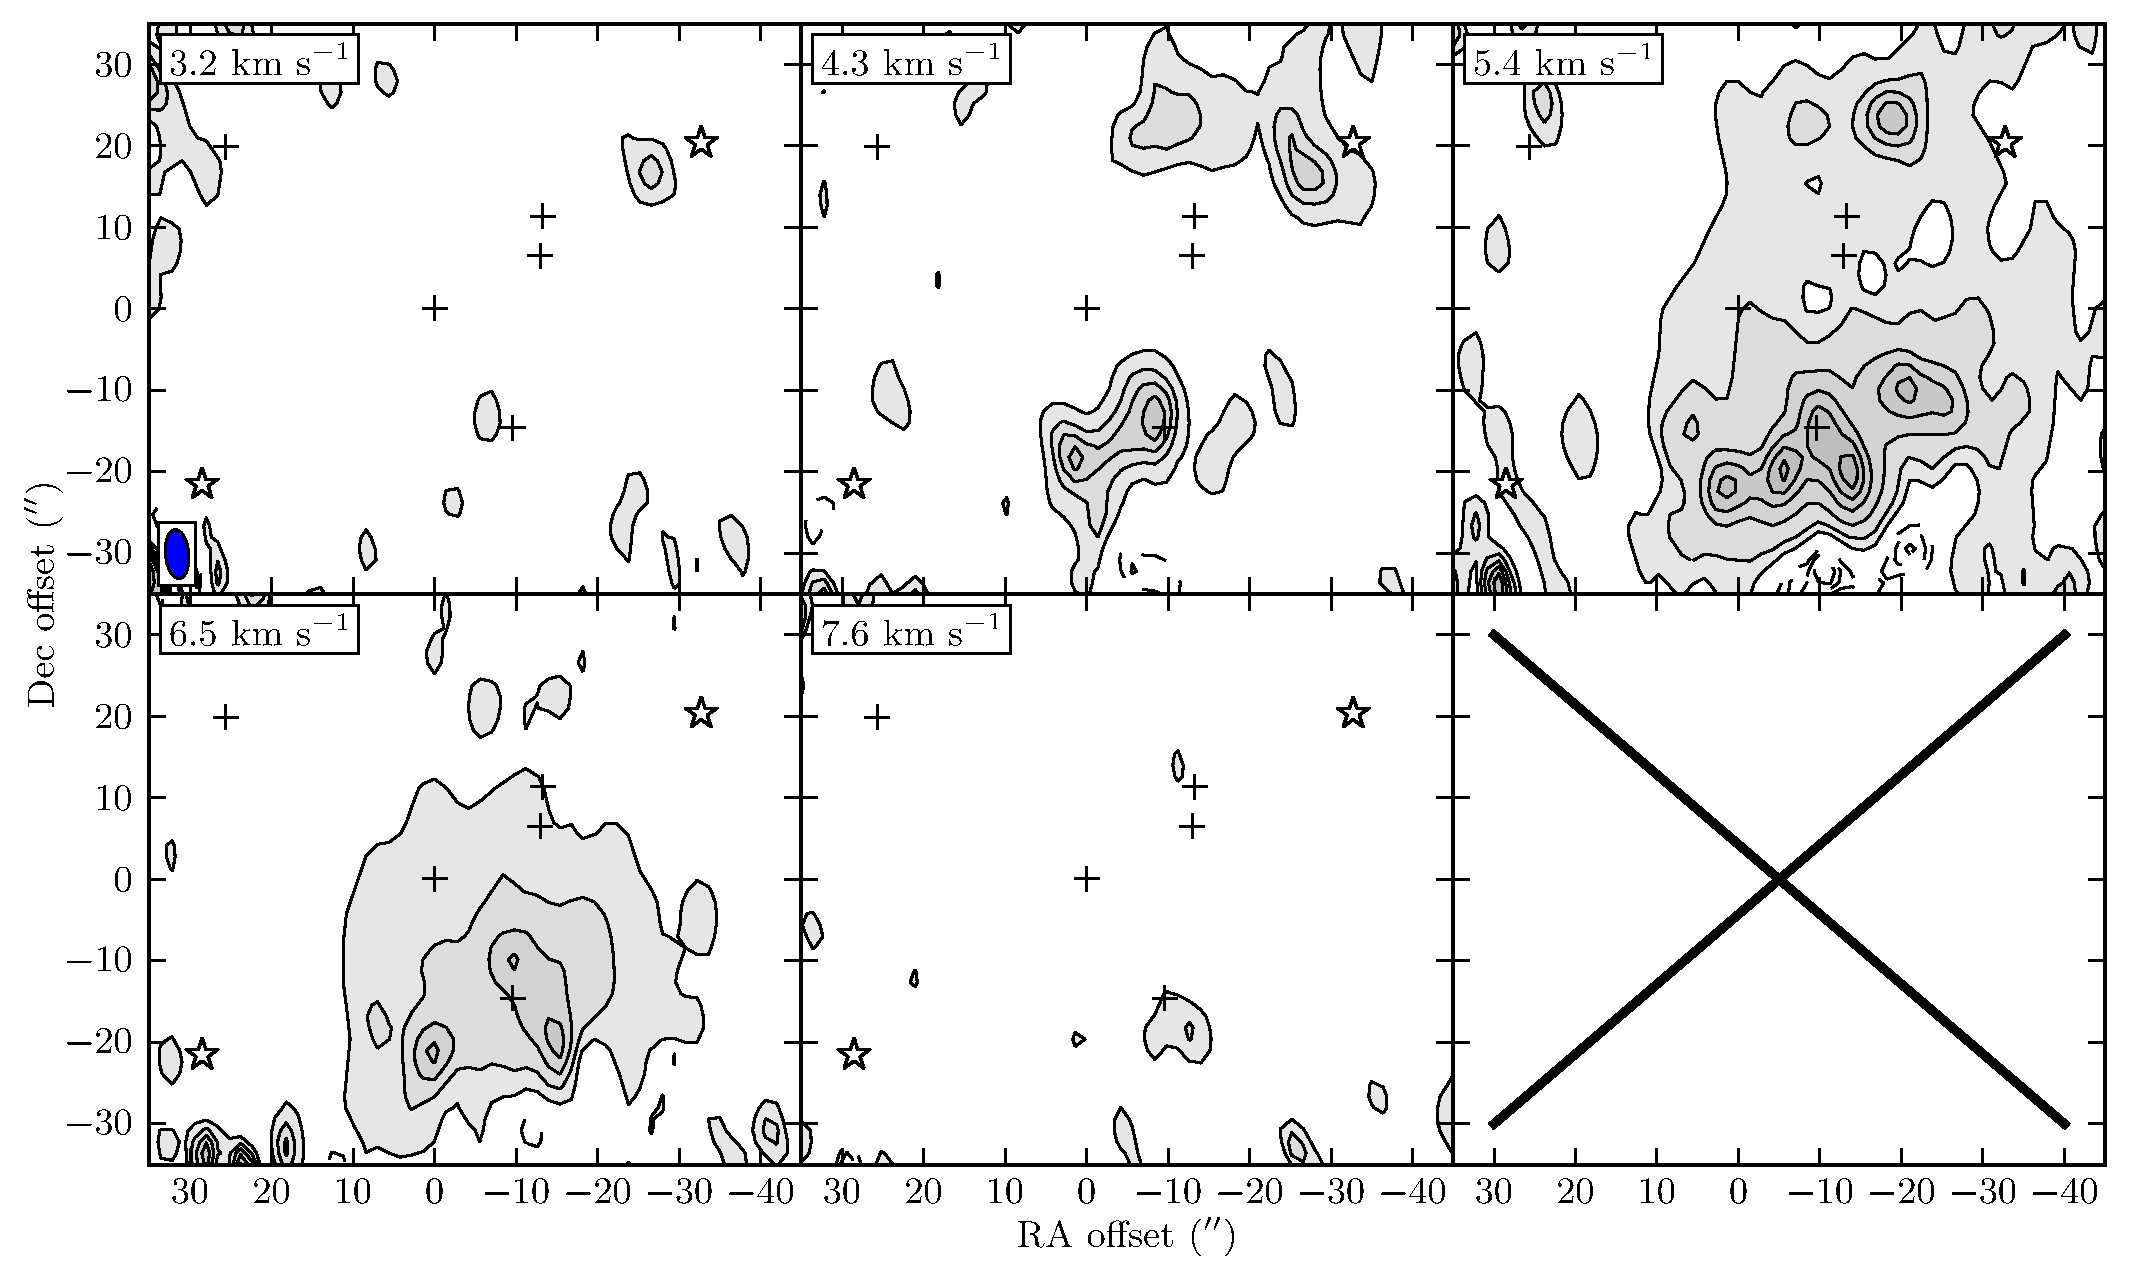
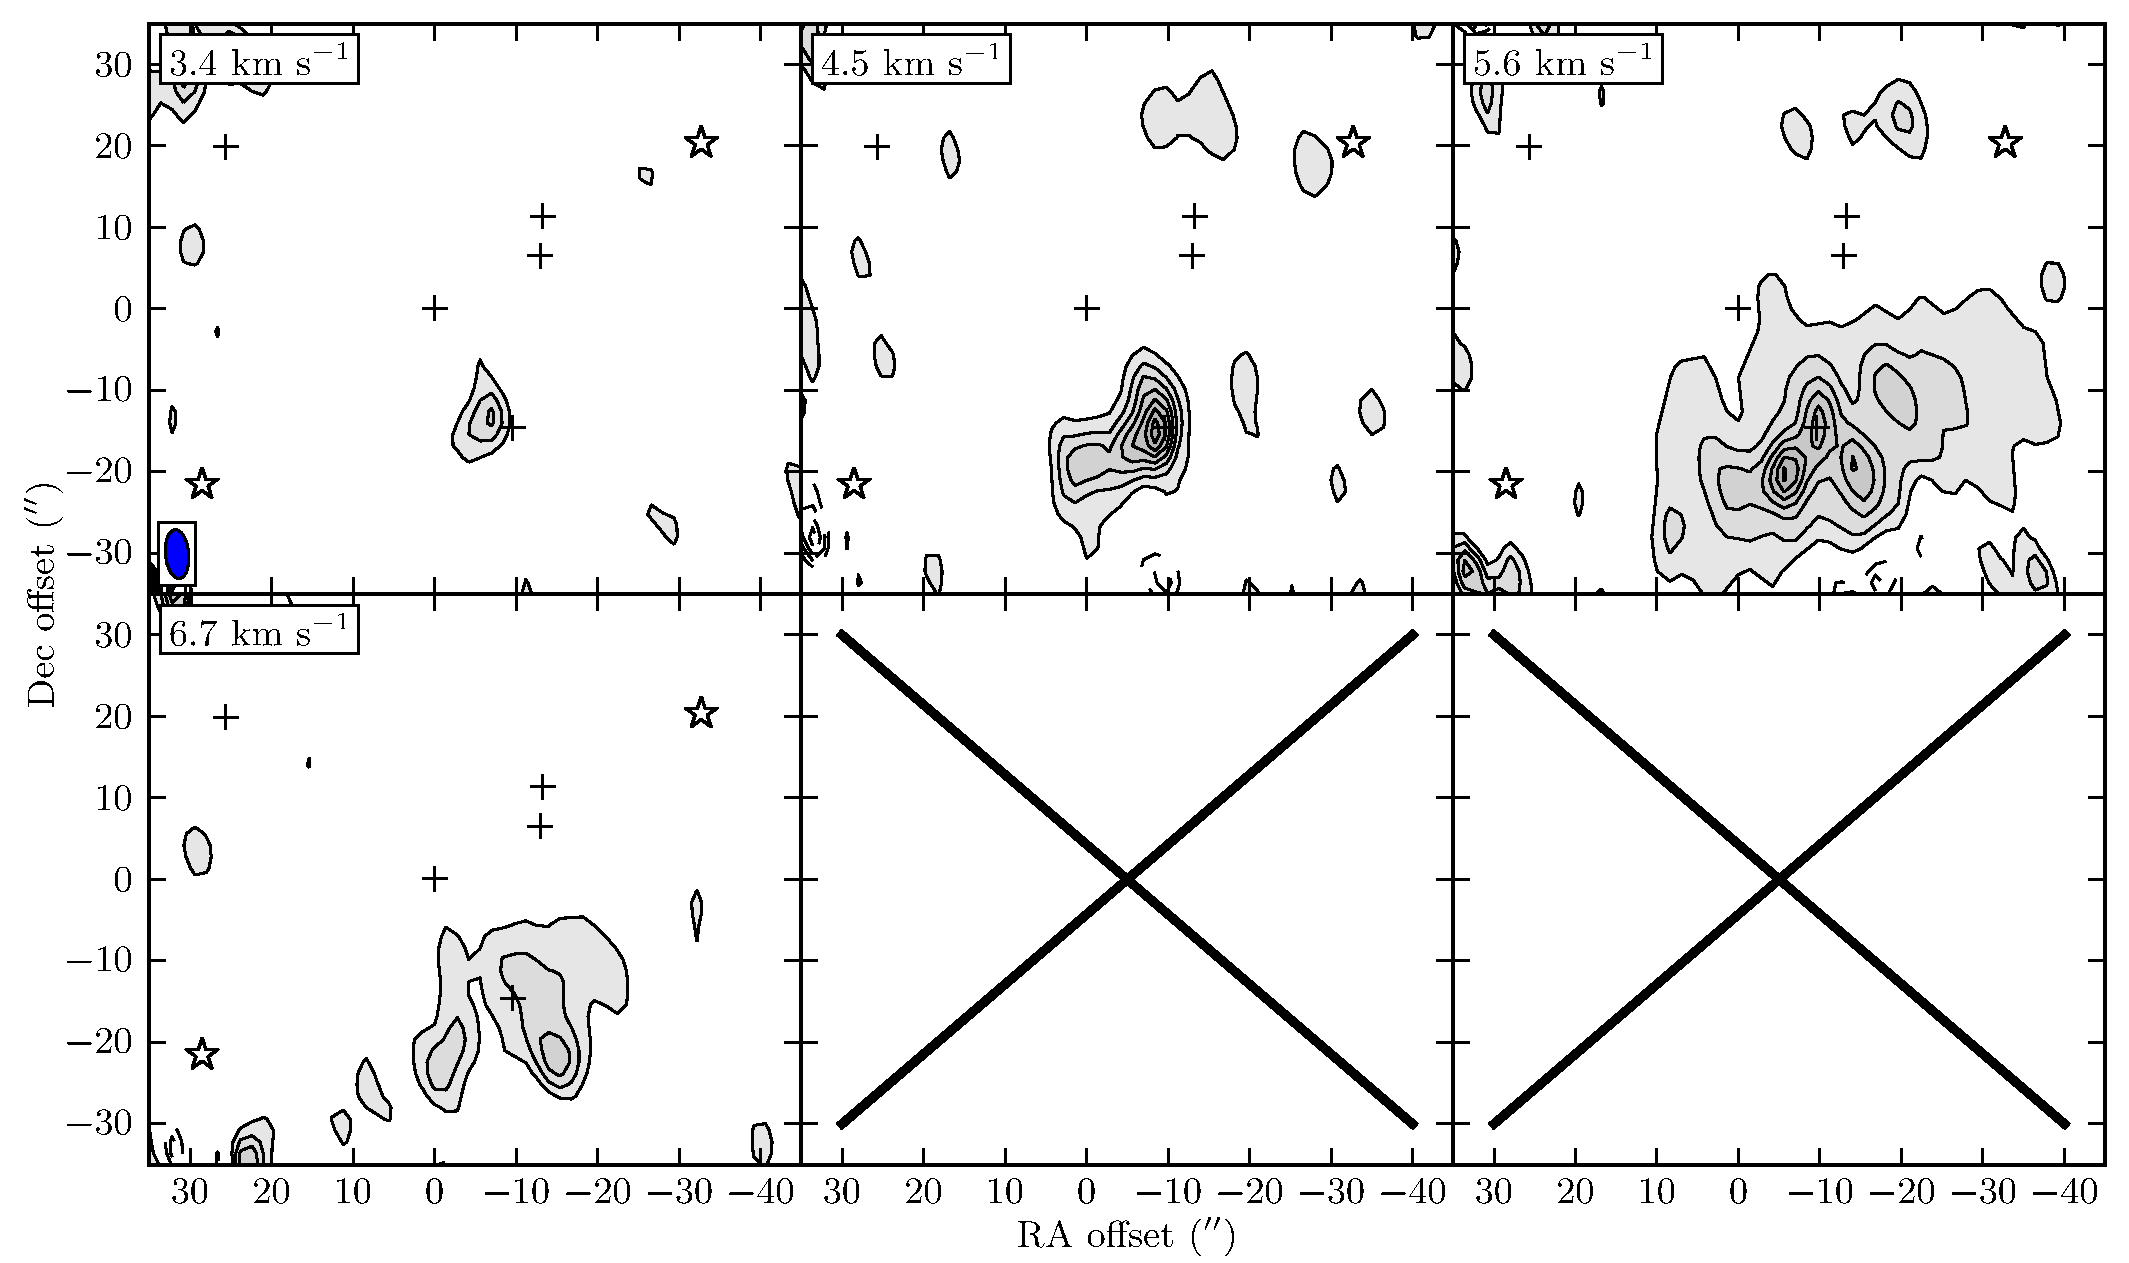
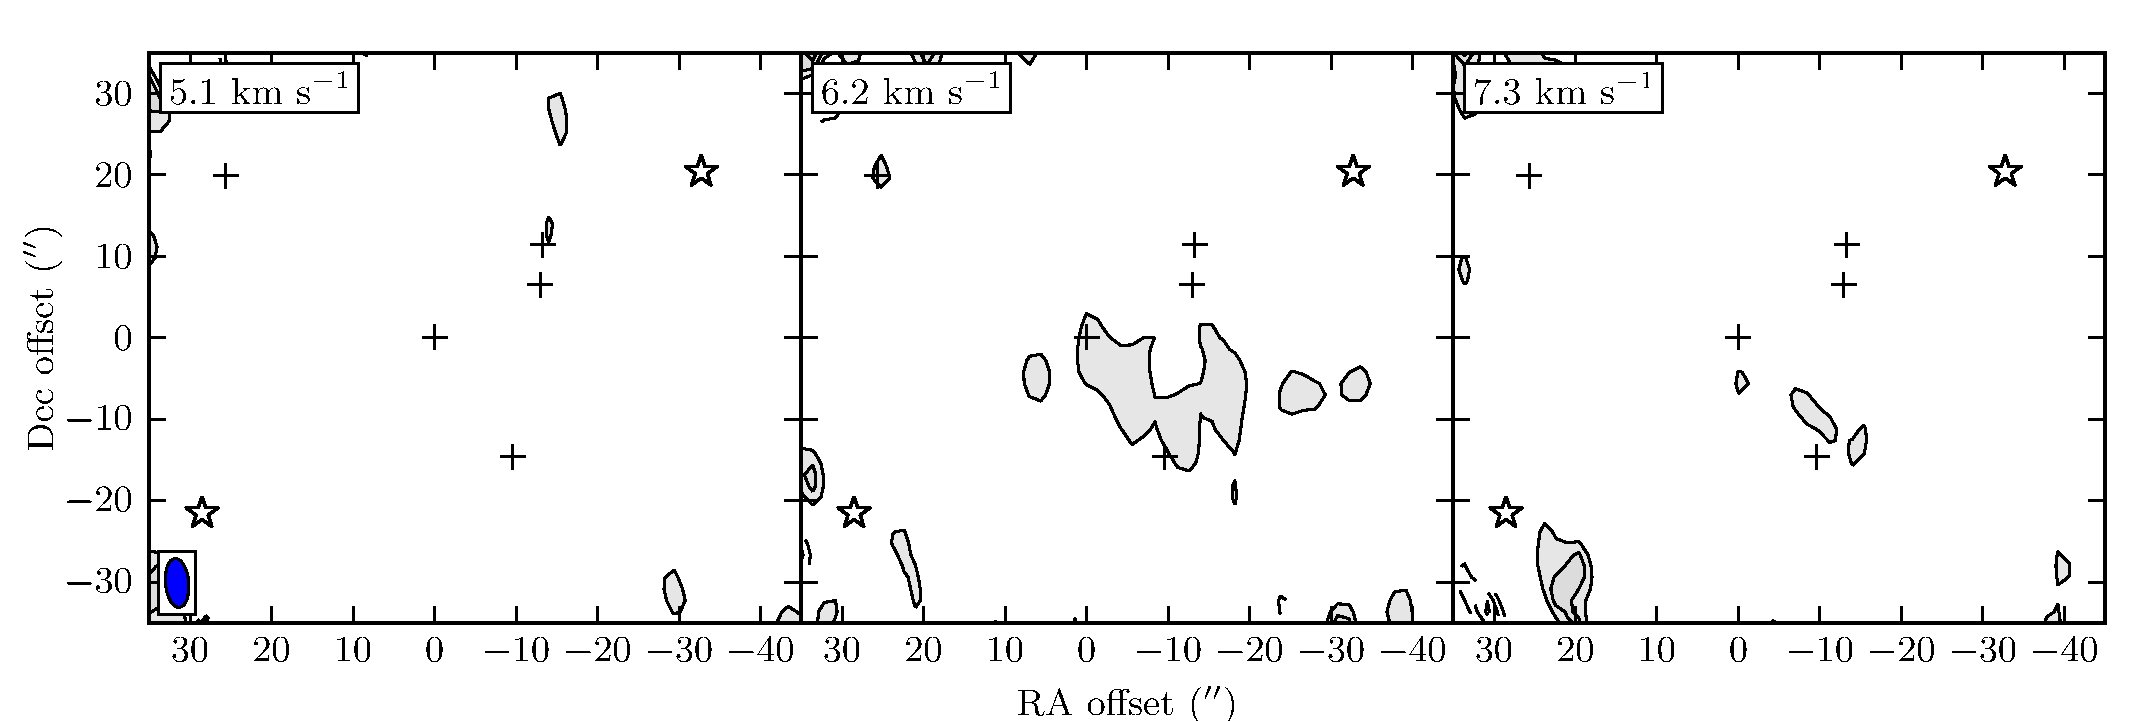
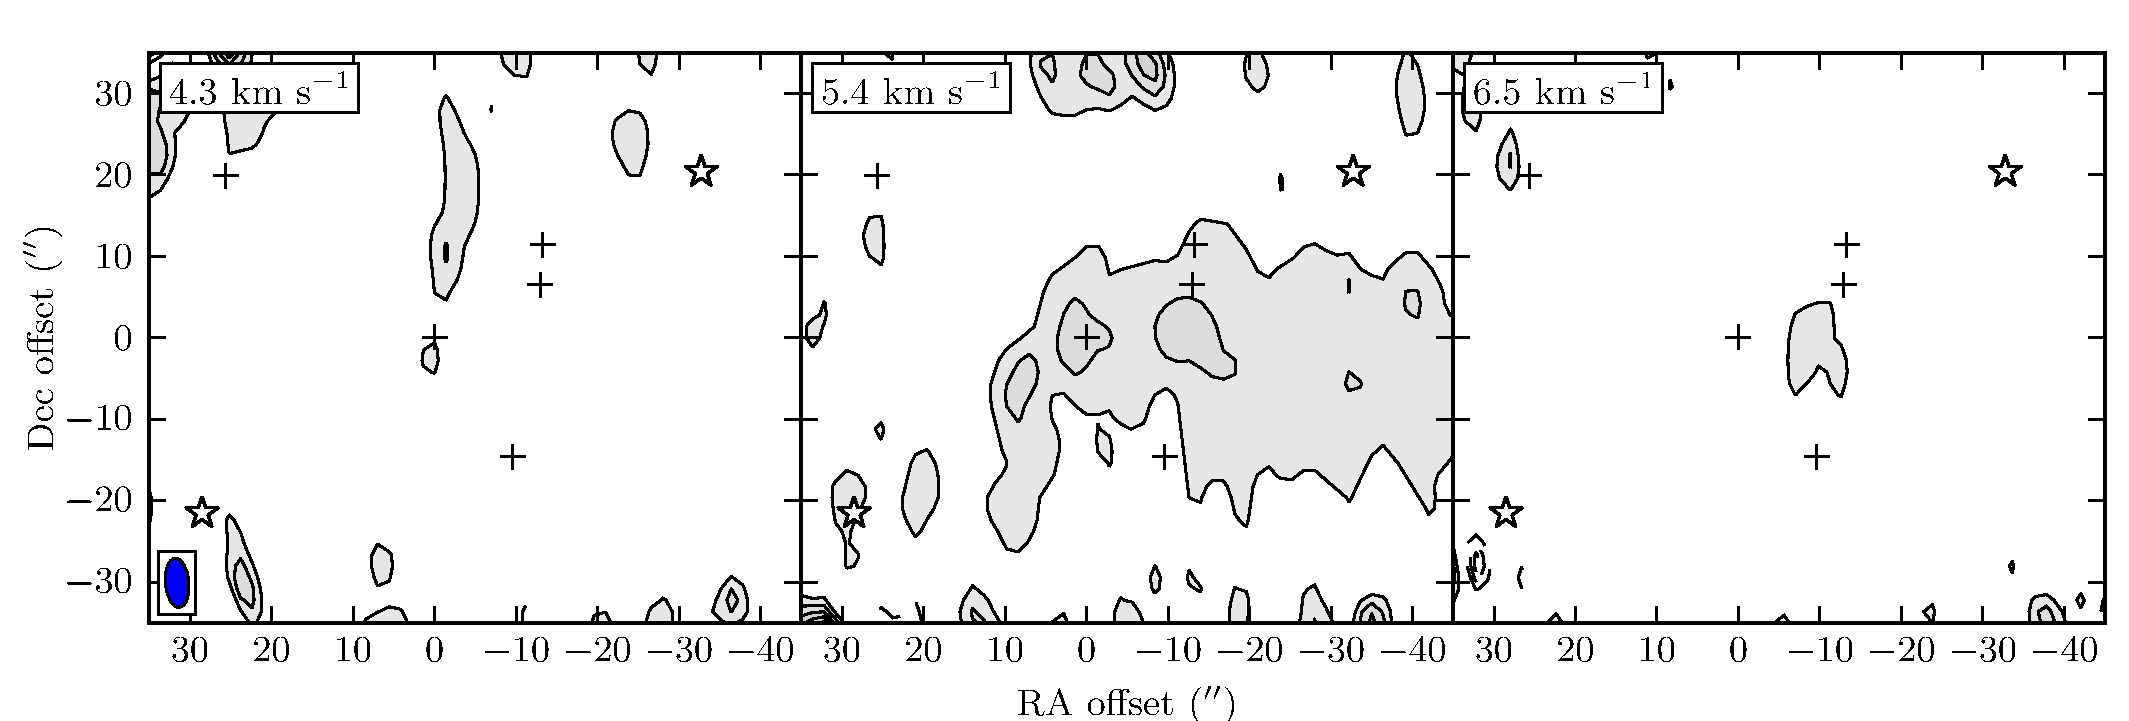
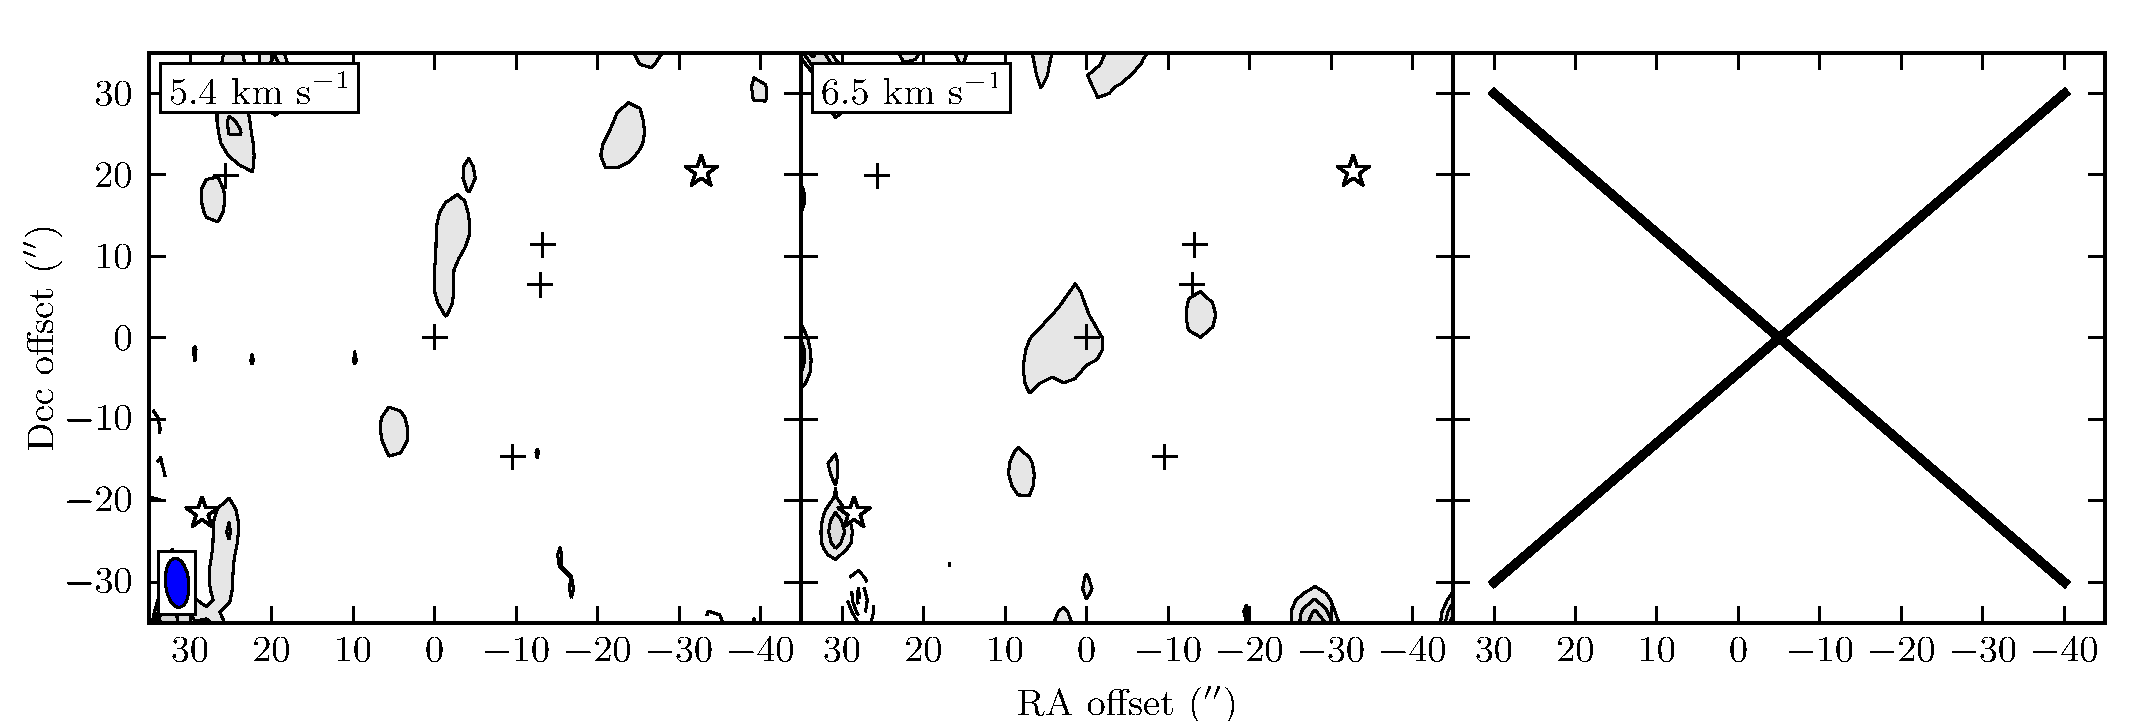
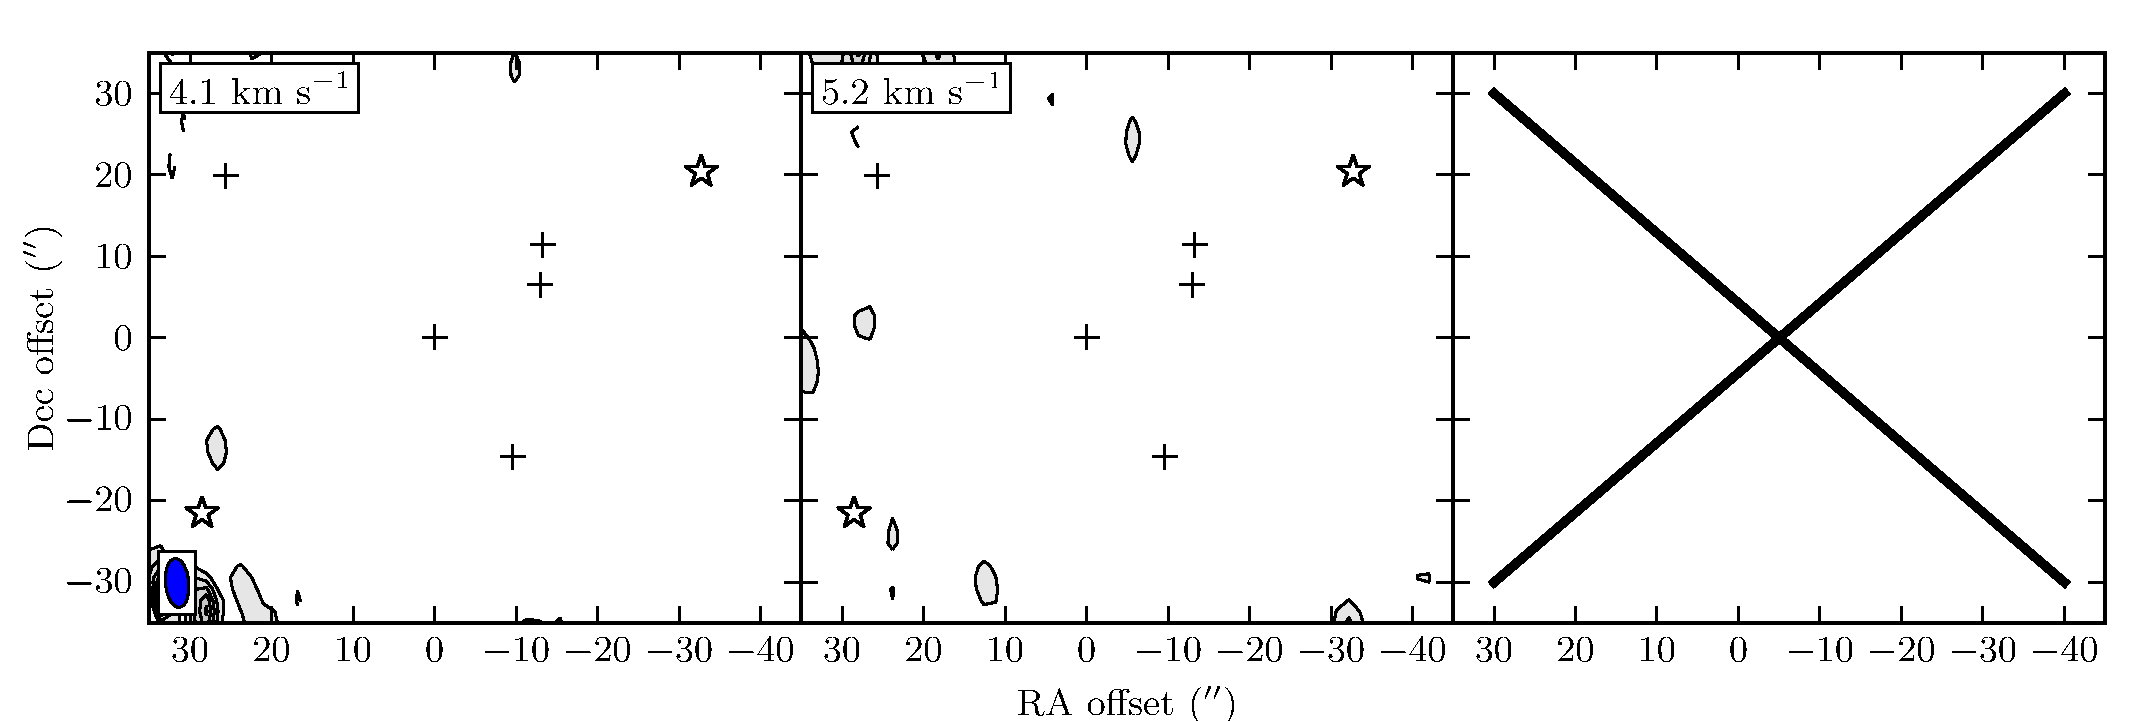
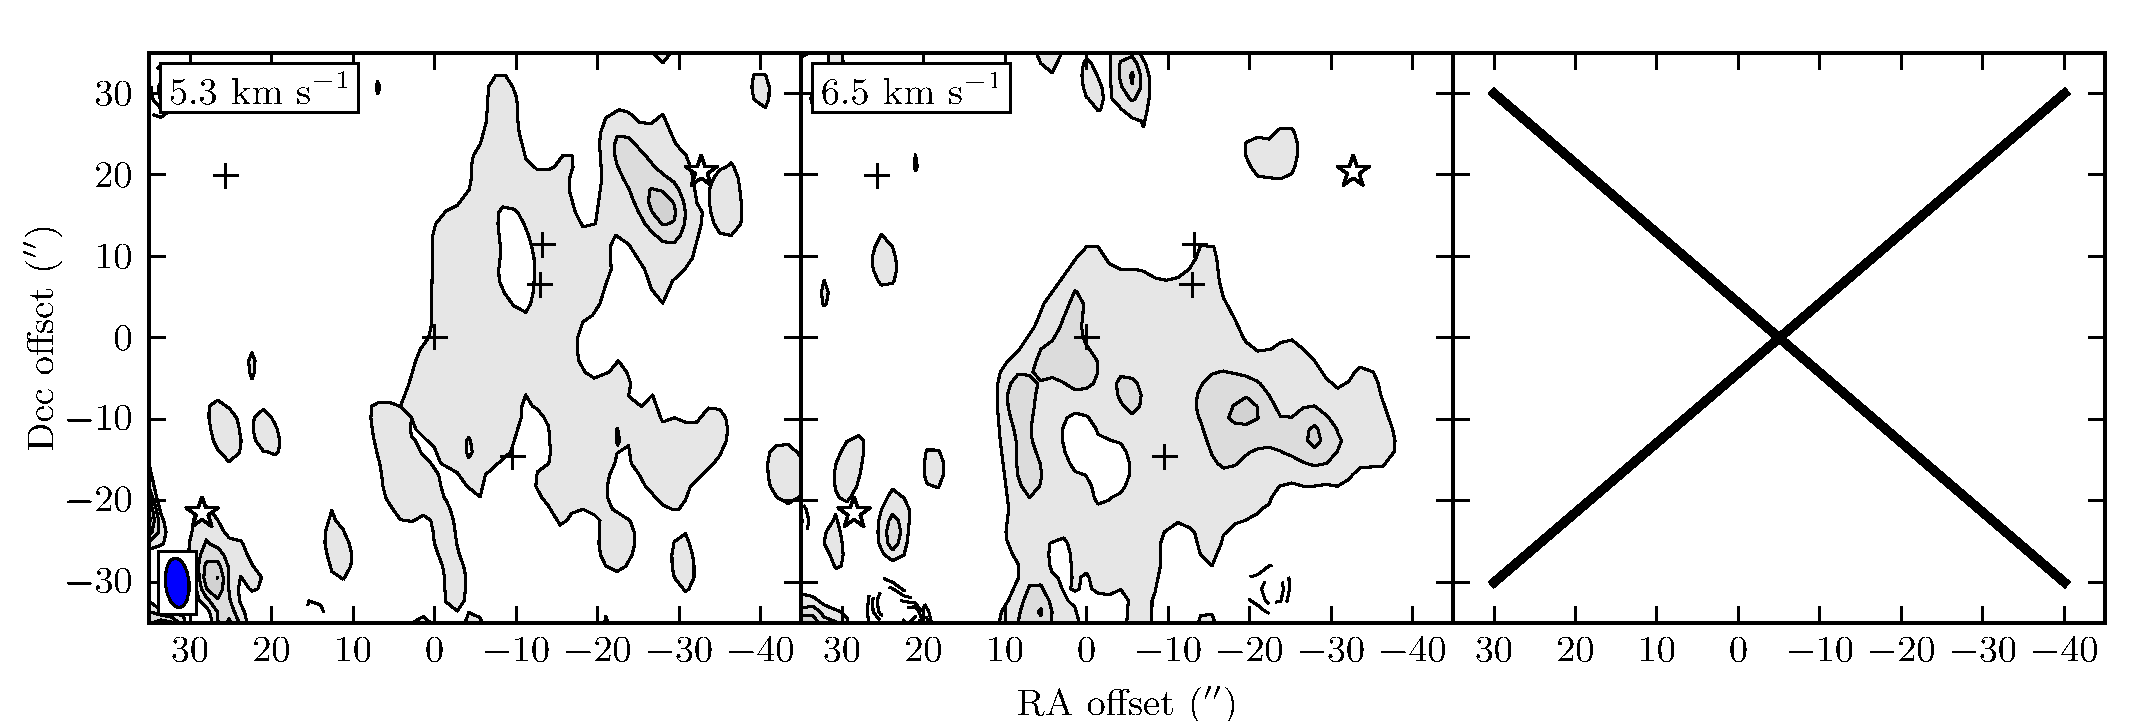
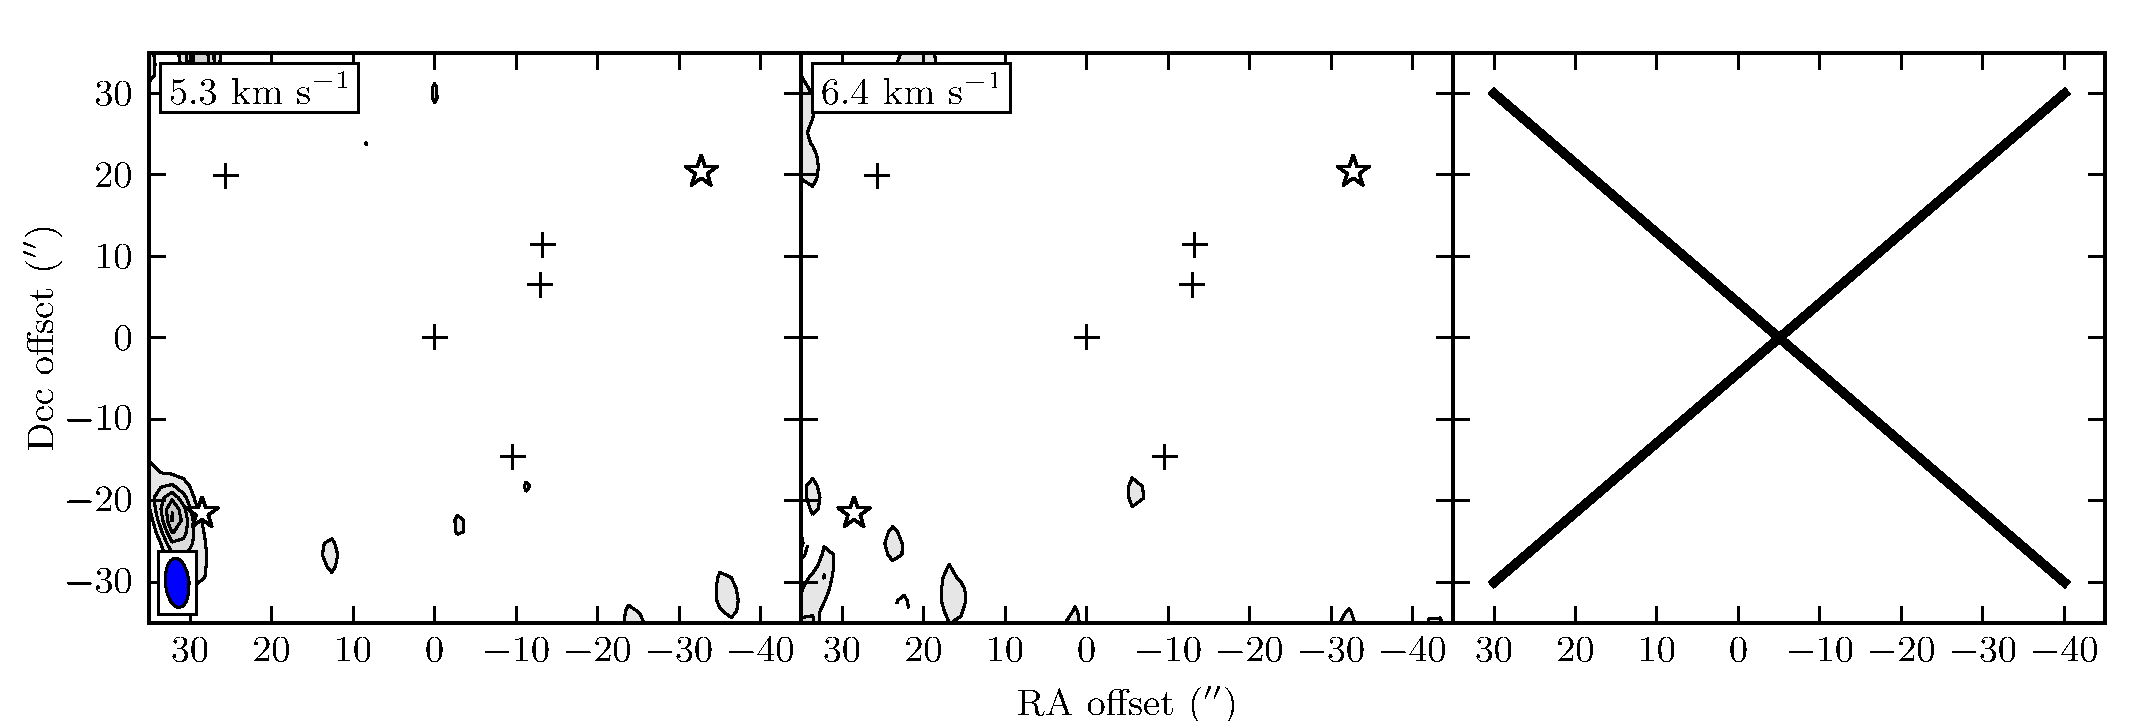
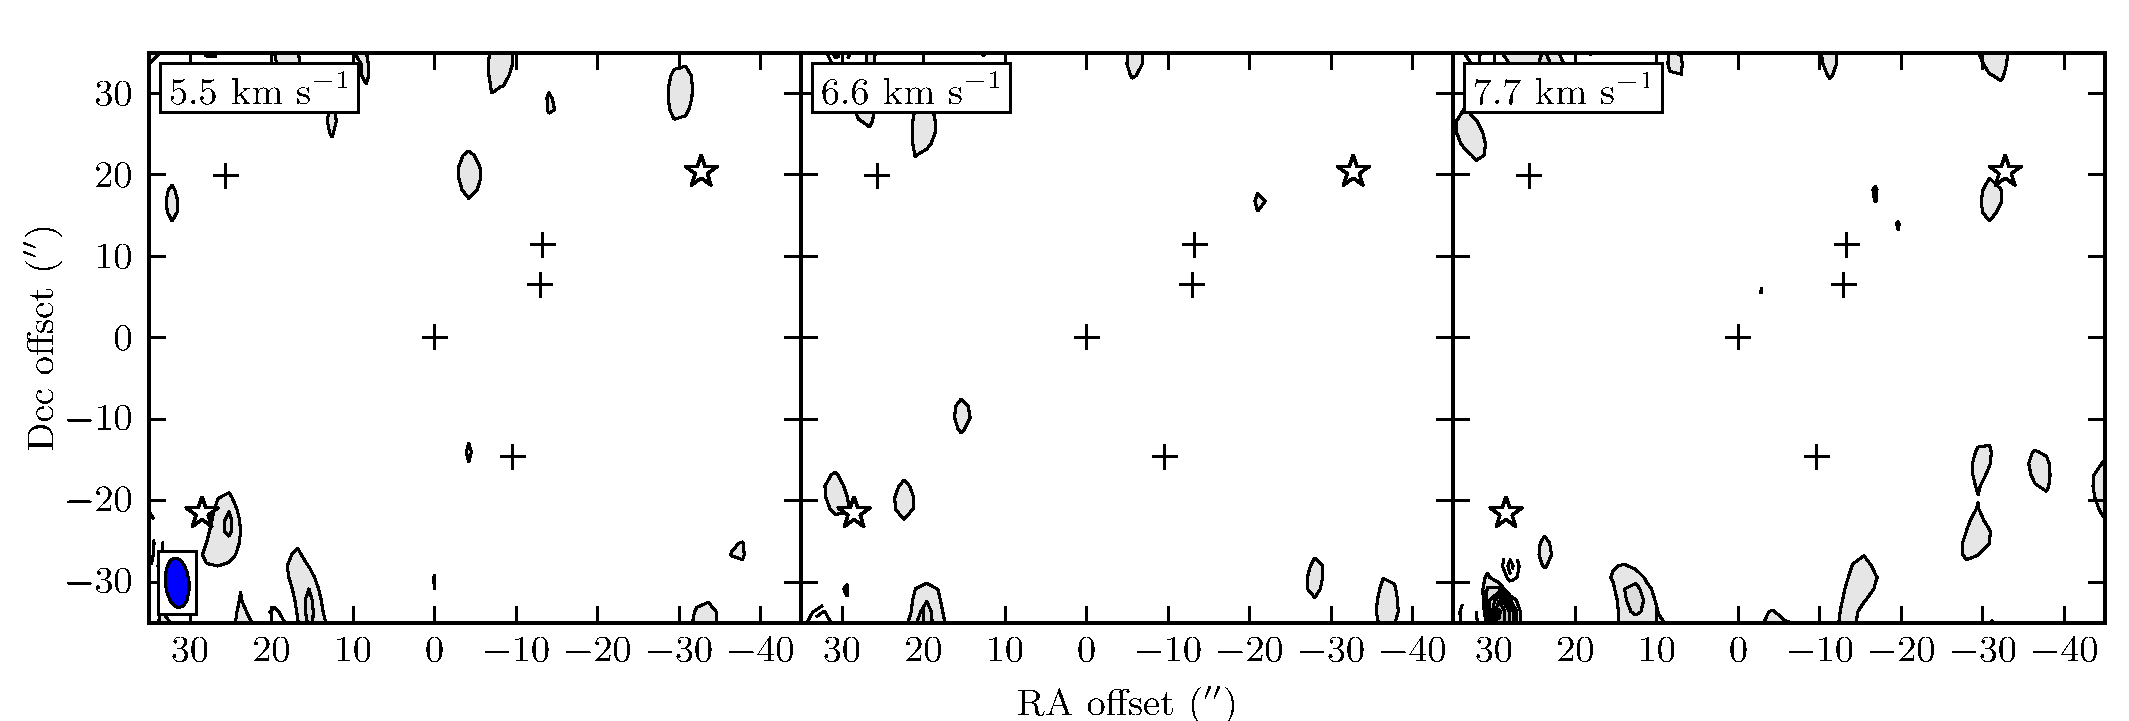
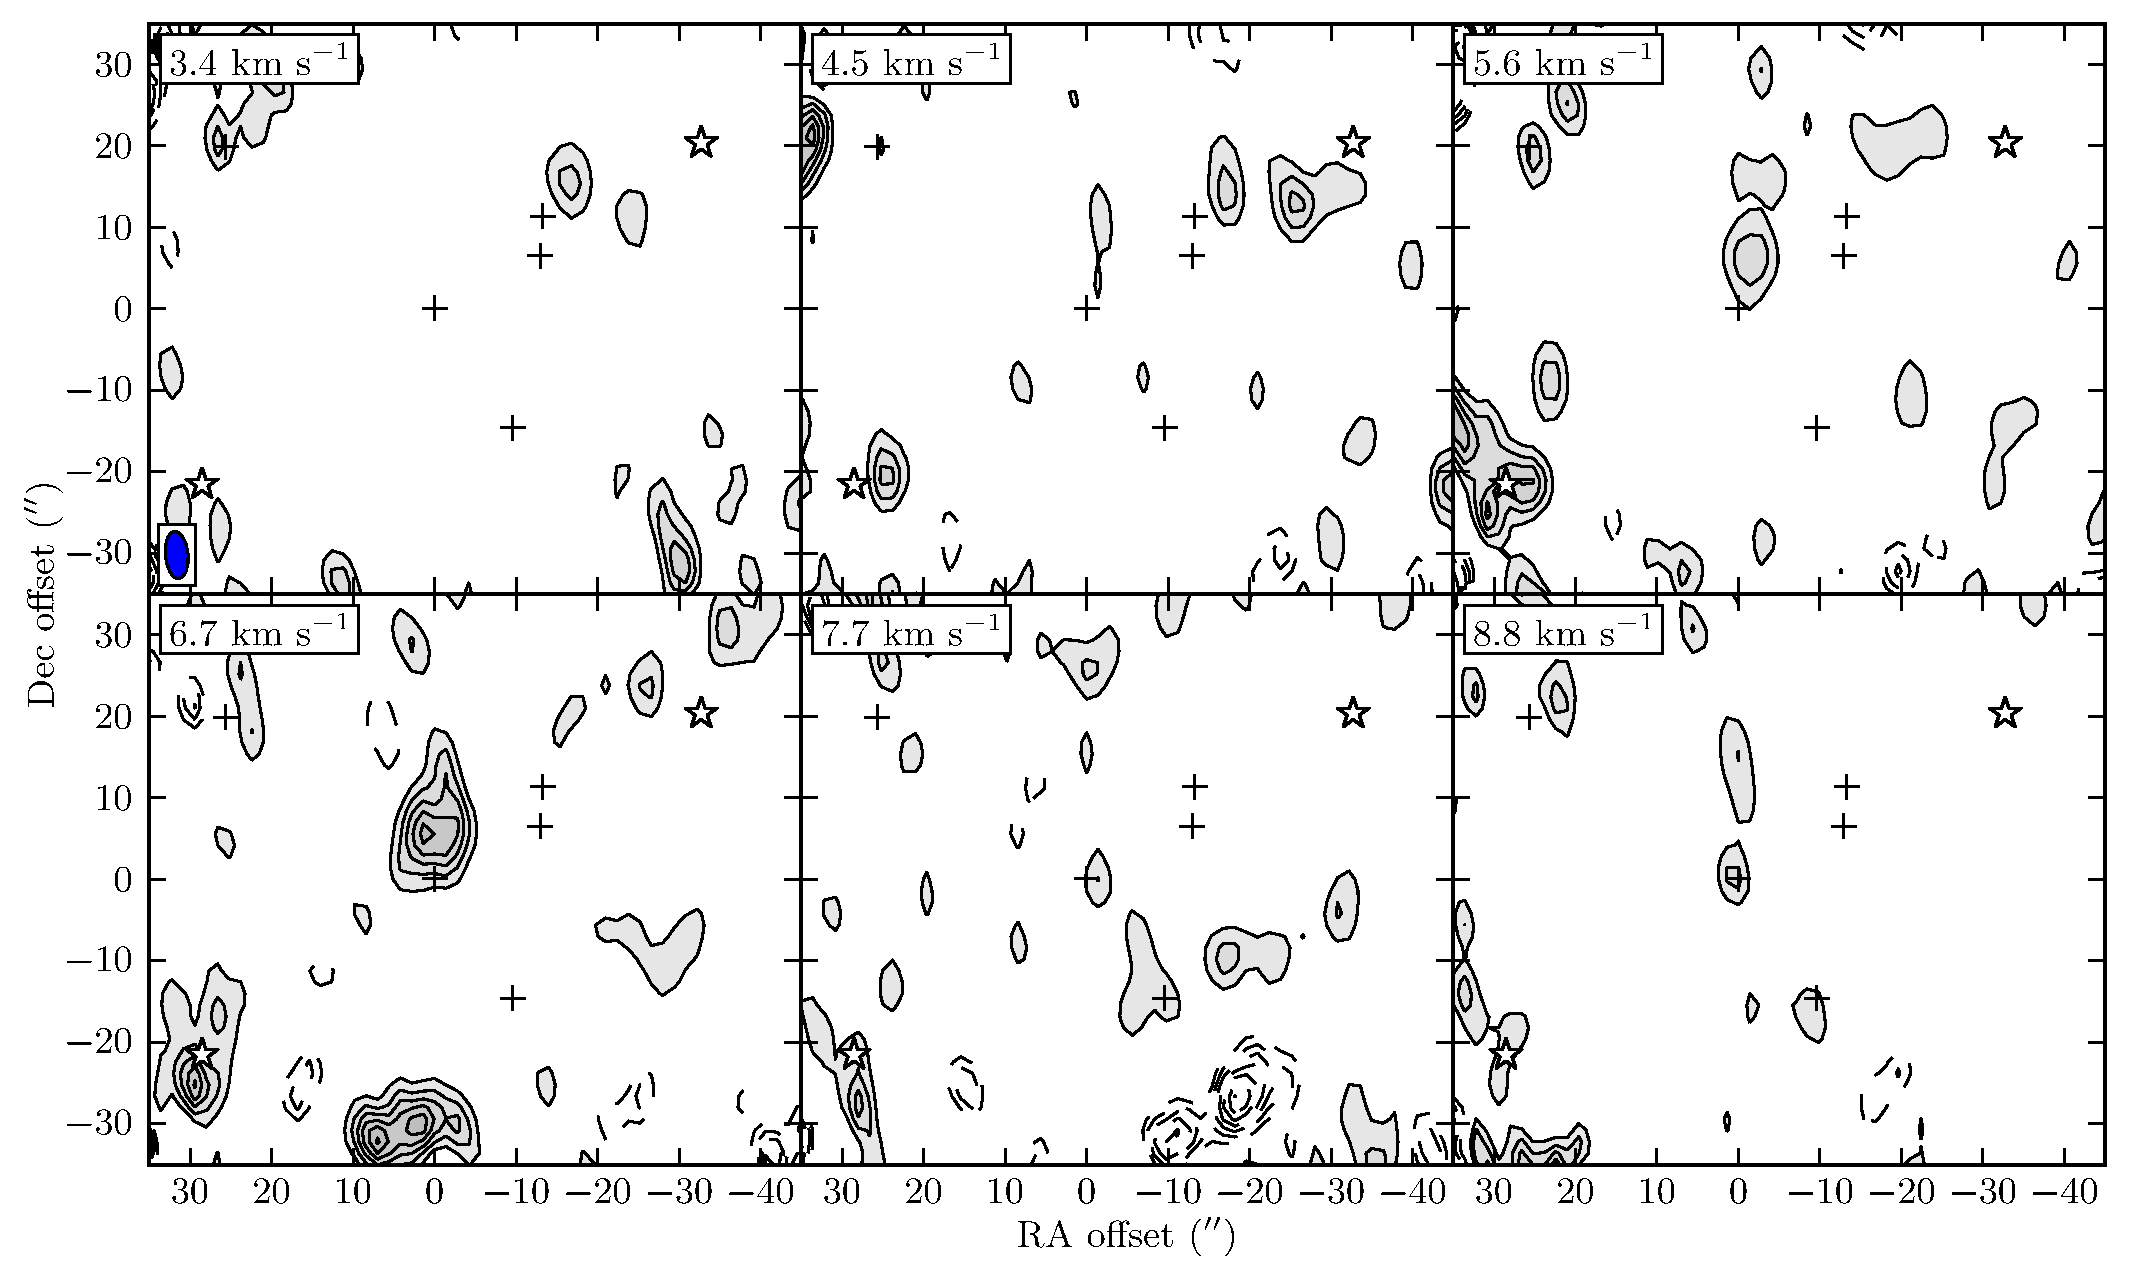
Figs. 5 and 16–28 show molecular line emission in the combined SMA/APEX maps in most of the area covered by both the APEX map and the SMA primary beams. Since primary beam correction is applied, all contours correspond to the same flux level, but not to the same S/N level. Thus, in the channel maps (Figs. 16–28) the 0.5 Jy beam-1 contours are approximately at a 3 level on the primary beam edges (see Fig. 2), but at a 6 level in the beam centres.
The molecular lines seen in the SMA data can roughly be separated into three groups by their distribution in the R CrA region. The first group consists of all detected H2CO and CH3OH lines. The second group consists of the HC3N, c-C3H2, DCN, 13CN, and 12CN lines. Finally, the distribution of the SiO emission is not similar to those of the other molecular species.
3.1 H2CO and CH3OH
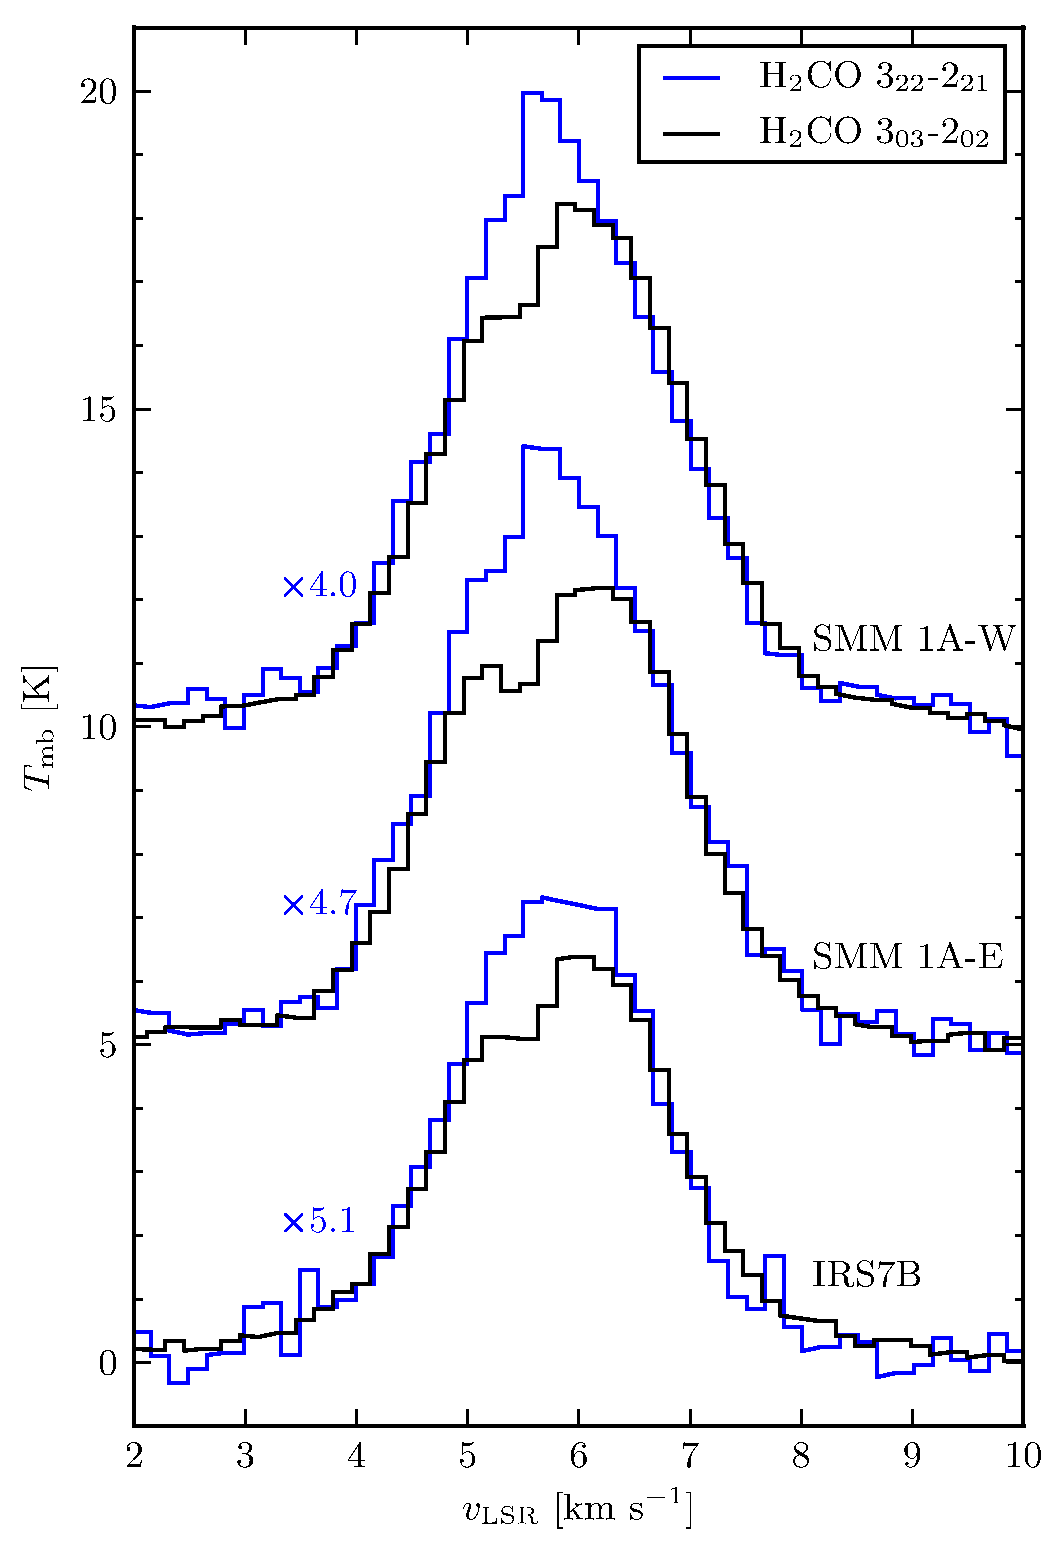
In the APEX data, the H2CO 303–202 line has a non-Gaussian shape not seen in the higher-excited H2CO lines, suggesting either that the emission has multiple components, or that optical depth effects are present (see Fig. 6).
The H2CO and CH3OH lines show strong emission in two ridges; one south of IRS7B, with one of the peaks in this ridge almost coinciding with the suggested starless core SMM 1A (Chen & Arce, 2010); the other between SMM 1C and R CrA (see Figs. 5 and 16–19). Both these regions are relatively extended also in the velocity domain ( 4 to 7 km s-1 for the northern ridge and 5 to 8 km s-1 for the southern), but with individual clumps that peak at different velocities in these intervals. Note, however, that significant H2CO 303–202 emission is seen all over the field between 4 and 7 km s-1. This morphology is different from the sources studied by Jørgensen et al. (2007), where H2CO and CH3OH emission mostly is found to be associated with the YSOs and their outflows.
The H2CO 303–202 emission is of comparable strength in the northern and southern ridges, whereas the higher excited H2CO lines and the CH3OH line are stronger in the southern ridge. The difference in the H2CO line intensities suggests a higher temperature in the southern ridge than in the northern or alternatively a higher optical depth of the main transition. The emission peak in the southern ridge does not coincide with the centre of the extended SCUBA dust emission, which lies approximately 10″ southwest of the strongest H2CO 303–202 peak in the southern ridge. However, the SCUBA dust emission peak coincides well with a secondary peak of the higher excited lines (see Fig. 7).
For the lower LSR velocities ( to km s-1), most H2CO, CH3OH, and SiO emission is seen in the northeastern part of the field covered by the SMA/APEX observations. This low-velocity emission is not connected to the emission around IRS7 – if that was the case, a much smoother westward translation of the emission with increasing velocity would be seen in Fig. 16. Instead, the H2CO emission shows a distinct jump around 3 km s-1. This indicates that the northeastern emission originates in another source, outside or on the edge of the field-of-view, perhaps SMM 2. This emission is also fainter than that in the centre of the field.
3.2 HC3N, c-C3H2, DCN, and CN
The second group of lines (HC3N, c-C3H2, DCN, and CN) shows relatively weak emission. Except for CN, they are all present in an EW-extended region between IRS7B and SMM 1A (see Figs. 5 and 20–27). c-C3H2 and CN are the only molecules in the SMA/APEX data that have their strongest emission associated with the YSOs: c-C3H2 peaks at IRS7B, and extends in a northward collimated outflow, whereas 12CN shows a strong clump just north of IRS7B. Extended HC3N emission is detected south of IRS7A and southwest of IRS7B. The 13CN emission is rather diffuse and extended, but also of quite low S/N. For the 12CN lines, no APEX short-spacings are available, so no conclusions about the extended emission can be drawn from this map. However, a strong clump of 12CN emission is seen peaking just north of IRS7B, and a fainter clump is seen between IRS7A and R CrA.
3.3 SiO
The SiO emission is present in four distinct regions separated both in position and velocity (see Fig. 28). It appears as a bright point source south of R CrA, west of SMM 1C, at velocities (9 to 12 km s-1) considerably higher than that of R CrA (5 km s-1); in somewhat extended emission around SMM 1A at km s-1; as a pointlike source west of T CrA at low velocity ( to km s-1); and finally some faint emission east of SMM 2 at a velocity slightly lower than the systemic velocity of R CrA (0 to 3 km s-1). The latter two emission regions are outside the SMA primary beams, and thus only tentative. All SiO peaks coincide with relatively faint H2CO emission, which is in agreement with SMA observations of other prominent embedded protostars showing these molecules to coincide in outflow-affected gas (Jørgensen et al., 2007).
The most interesting SiO feature is the point source south of R CrA, since it together with R CrA falls on a straight line with several Herbig-Haro (HH) objects. Hartigan & Graham (1987) observed several HH objects (HH98, HH98B, HH100, HH97, HH96, and HH101) in a straight line that extends southwestwards from R CrA, through the SiO peak in the SMA data. They argue that all HH objects are driven by the infrared source IRS1, almost 1′ southwest of R CrA. However, Wang et al. (2004) argue that, considering the positions of the objects, the outflow might as well be driven by R CrA. The proper-motion velocities of the objects southwest of IRS1 were measured by Peterson et al. (2011), and are indeed directed southwestwards. The proper-motion velocity of HH98B (MHO 2001Q) is also measured, which is directed westwards, and suggested to be driven by SMM 1C (SMA 2), and is thus not related to the other HH objects along the line.
As a summary, the Herbig-Haro objects in the region have several possible driving sources (including IRS1, SMM 1C, and R CrA), and the SiO peak south of R CrA could be associated with any of these objects. There are no sources described in Peterson et al. (2011) that can explain the SiO emission associated with SMM 1A, nor have any HH outflows been observed in its vicinity.
4 Analysis
With the high resolution interferometric maps from the SMA and the recovery of the more extended structure through the APEX observations, it is possible to investigate the physical conditions in the region around the protostars close to R CrA. In the following we constrain the physical properties in the region and subsequently (Sect. 5) the implications concerning the radiation field around the embedded protostars and in particular the influence from R CrA itself.
4.1 LTE estimates of physical properties
Observations of several rotational transition lines of the same molecule can be used to construct a so-called rotational diagram for a given molecular species from which the column density and rotational temperature of the species can be estimated (Goldsmith & Langer, 1999). If one assumes that the molecules are excited under local thermal equilibrium (LTE) conditions and that the lines are optically thin, the rotational temperature is another measure of the kinetic temperature of the species. In the case of H2CO, the three lines at 218 GHz make it possible to calculate first-order approximations of the temperature and column density (see e.g. Mangum & Wootten, 1993; Maret et al., 2004). However, if the lines are optically thick, the rotational diagram method will usually overestimate the kinetic temperatures, since the lower-excited lines will be more severely affected by the optical thickness than the higher-excited lines.
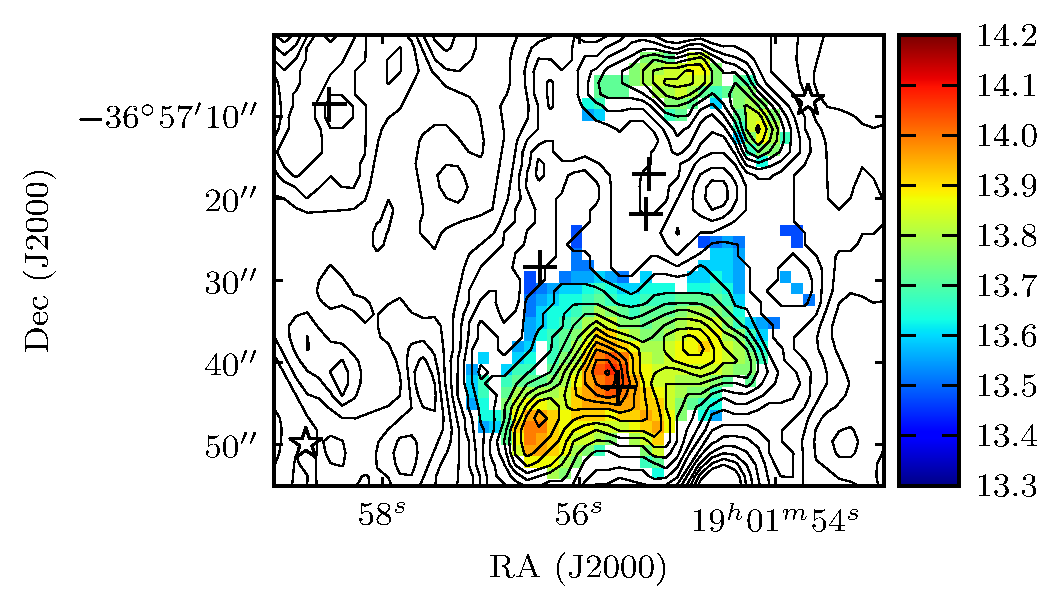
The temperature and column density of the H2CO in the region covered by the SMA and APEX data is estimated by the use of these three spectral lines in all parts of the SMA primary beams where the integrated intensities between 0 and 9 km s-1 of all three spectral lines have a signal-to-noise ratio of at least 5. In Fig. 8, the rotational temperatures and column densities estimated from the SMA/APEX maps of the H2CO 303–202, 321–220, and 322–221 lines are shown. Note that the lines in this study are para-H2CO lines, and to find the total H2CO column densities, the ortho/para ratio must be accounted for. In this paper, the p-H2CO column density will be stated. Assuming an ortho/para ratio of (Dickens & Irvine, 1999; Jørgensen et al., 2005), the total H2CO column density can be estimated by multiplying the p-H2CO column density by .
The maps show a wide spread in rotational temperatures throughout the region; from 30 K in the colder regions (mostly associated with low H2CO intensities, and thus low S/N levels), up to 120 K in a few peaks close to SMM 1A. From the SMA/APEX map of the IRS7 cloud (Fig. 8), it can be found that the highest rotational temperatures are not associated with the YSOs, but with the southern ridge around SMM 1A, and also with the northern ridge close to R CrA. In some points in the southern ridge, a rotational temperature of K is found. Using the APEX pointing centred at IRS7B, a single-dish rotational temperature of 62 K was calculated in a 28.6″ beam around IRS7B. However, the highest temperatures are likely optical depth effects, and the physical temperatures should rarely exceed 70 K (see Sect. 4.1.1). The estimated column density varies between and cm-2 in the region, and is fairly well-correlated with the rotational temperature. As can be seen in Fig. 8, the rotational temperature is not peaking at the same place as the H2CO 303–202 (main line) emission. The rotation temperatures at the positions of the YSOs are relatively moderate, around 40–50 K (see Fig. 9).
Both maps use the integrated intensities of three para-H2CO lines around 218 GHz, and only data points that are inside the SMA primary beams and where all three lines have detections or stronger are considered. All other points are represented by white pixels. The temperatures and column densities are calculated with rotational diagrams for line intensities integrated between 0 and 9 km s-1. The contours show the integrated intensity of the H2CO 303–202 line in the same velocity interval, with contours every 2 K km s-1 ( at the edge of the primary beam). Refer to Fig.1 for a guide to the symbols used for the compact objects.
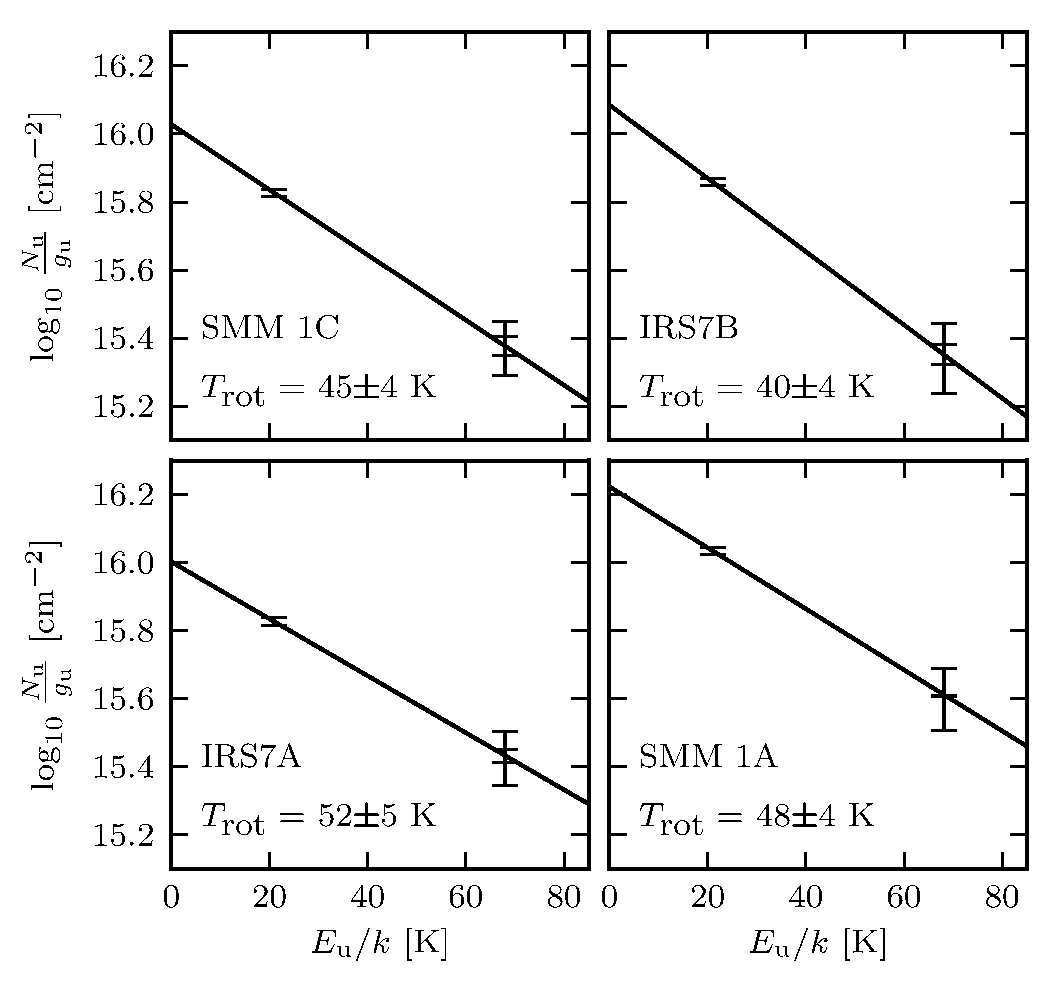
Only one of the three high-temperature H2CO peaks around SMM 1A coincides with one of the three condensations within SMM 1A suggested by Chen & Arce (2010): SMM 1A-a, the weakest 1.3 mm continuum source within SMM 1A, coincides with the peak with the second highest rotational temperature. The much more luminous SMM 1A-c is found in a point with relatively low H2CO temperature ( K). The northern ridge of extended H2CO emission has a more even and somewhat lower rotational temperature ( 40–50 K) than the southern ridge ( 50–120 K).
These temperature and column density estimates suffer from four main sources of errors: The statistical error (noise); the calibration error of the telescopes; the primary beam error, which is notable far from the primary beam centres; and the errors arising from the model assumption of LTE conditions. The statistical uncertainty, including the primary beam error, is estimated from the RMS of the noise in the combined SMA and APEX data. The systematic calibration error is estimated to of the line flux (note that both SMA and APEX will introduce systematic errors, which both should be in the order of , but since the line flux is dominated by the APEX data (see Fig. 4), it can be assumed that the total calibration error is almost equal to the contribution from APEX). However, this error does only apply to the column density estimates, since the rotational temperatures are proportional to the logarithm of the line ratios and thus only depend on the relative errors in the line flux estimates due to noise. Typically, the rotational temperatures are therefore determined to about accuracy given the model assumptions.
Maret et al. (2004) studied the H2CO abundances in a sample of Class 0 protostars using the IRAM 30 m telescope and the JCMT. Several p-H2CO and o-H2CO spectral lines between 140 GHz and 365 GHz were observed in eight sources, and the highest H2CO rotational temperatures were found in three hot corino sources in NGC 1333 (25–40 K), whereas the rotational temperatures in the other sources were in the order of 10–20 K. However, if only using the 218 GHz lines, much higher rotational temperatures (up to several 100 K) are reached in the hot corino sources, but with large uncertainties. Furthermore, Jørgensen et al. (2005, 2007) demonstrated that the single-dish H2CO observations are difficult to interpret for the specific sources – in particular, that the high rotational temperatures are a likely result of extended outflow emission picked up by the single-dish observations.
4.1.1 Optical depth
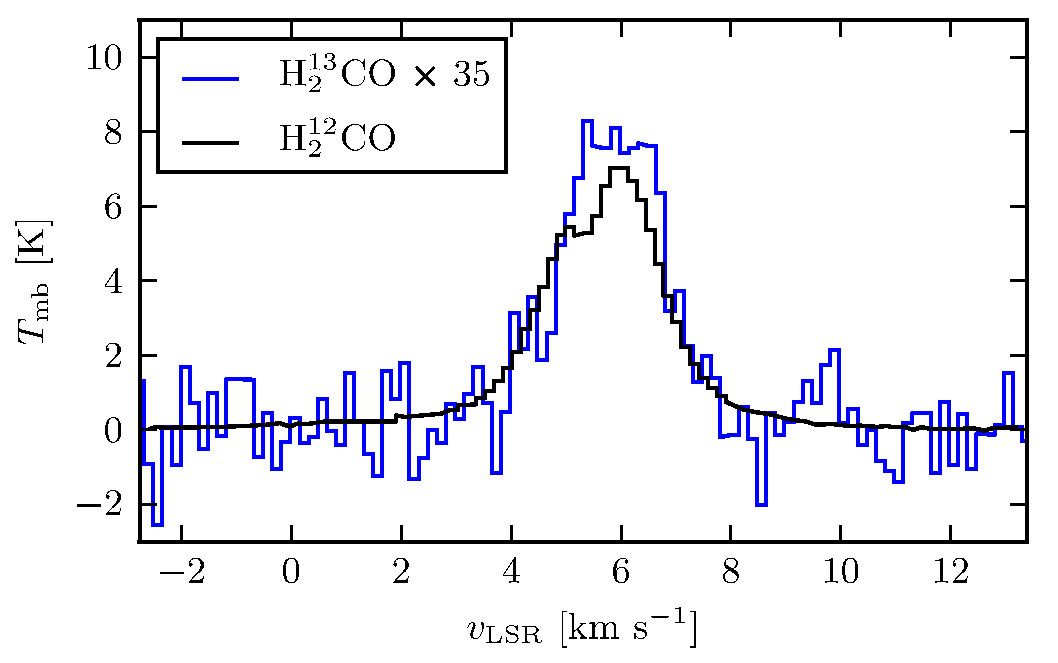
To investigate whether the assumption of optically thin H2CO lines is valid, the intensities of the HCO 312–211 line at 225.6978 GHz and the HCO 312–211 line at 219.9085 GHz (both from a large APEX survey; Lindberg et al. in prep.) were compared. The ratio between the integrated intensities of the two lines was calculated to be 35 (Fig. 10), which should be compared to the typical ISM 12C/13C ratio in the local ISM of (Wilson & Rood, 1994). The ratio measured in IRS7B is thus a factor of 2.2 lower, giving an optical depth of the o-HCO 312–211 line of . Using equations for the total column density of a molecule (see e.g. Goldsmith & Langer, 1999), and assuming an ortho/para ratio of 1.6 (Dickens & Irvine, 1999; Jørgensen et al., 2005), and K (the rotational temperature observed in the APEX beam), we find that this corresponds to 0.69 for the p-H2CO 303–202, and 0.18 for the p-H2CO 321–220 and p-H2CO 322–221 lines. Note, however, that these optical depths are averages over the APEX 28.6″ beam, and that locally elevated optical depths are likely.
Since the optical depths of the three spectral lines used for the rotational temperature calculation are different, the rotational temperature will be overestimated. When compensating for optical depth effects using the values estimated above and the optical depth correction factor given by Goldsmith & Langer (1999), the rotational temperature in the APEX beam drops from 62 K to 47 K. Since the distribution of the optical depth across the SMA/APEX map is unknown, non-LTE methods must be used to acquire a more accurate temperature estimate, but applying the large-scale optical depth on the calculations of the rotational temperature peaks in the southern ridge makes these drop from 100–120 K to 65–75 K.
4.2 Non-LTE analysis
For further analysis of the emission, we utilised the RADEX escape probability code (van der Tak et al., 2007) to solve the excitation of H2CO under non-LTE conditions assuming a uniform spherical molecular cloud. Besides allowing for a more detailed comparison of the importance of the density and temperature, this method also provides a path to take optical depth effects into account. Collision rates come from Green (1991), and were retrieved from the LAMDA database (Schöier et al., 2005).
In the absence of a central heating source, the temperature of a molecular cloud can hardly exceed 10–15 K assuming no external heat contribution, and typically the density would be – cm-3 (Bergin & Tafalla, 2007). Furthermore, the low-mass YSOs should not be able to heat the gas on scales observable in the SMA/APEX map. Consequently, assuming external heating, a fairly even temperature distribution is expected across each dense ridge. Thus, it is likely that the wide spread of temperatures found in the rotational temperature map (Fig. 8) is caused exclusively by column density effects, and that each of the two ridges have uniform temperatures. To exclude all emission outside these ridges, only pixels where all three H2CO lines are detected to at least an level are considered in the RADEX calculations.
In the ridges, the H2CO 321–220/H2CO 322–221 ratio has an average of 0.98, and the ratio lies between 0.8 and 1.2 in more than of the pixels in the two ridges. The average optical depth of the H2CO 303–202 line in an APEX beam around IRS7B is 0.7 (see Sect. 4.1.1), but might be several times higher in the peaks. These parameters are found to be relatively temperature-insensitive – at 30–90 K they require cm-3 and – cm-2. Where the H2CO 321–220/H2CO 322–221 ratio is greater than 1, cm-3. This suggests that the H2 density in both ridges must be relatively high compared to what one would expect in a prestellar cloud.
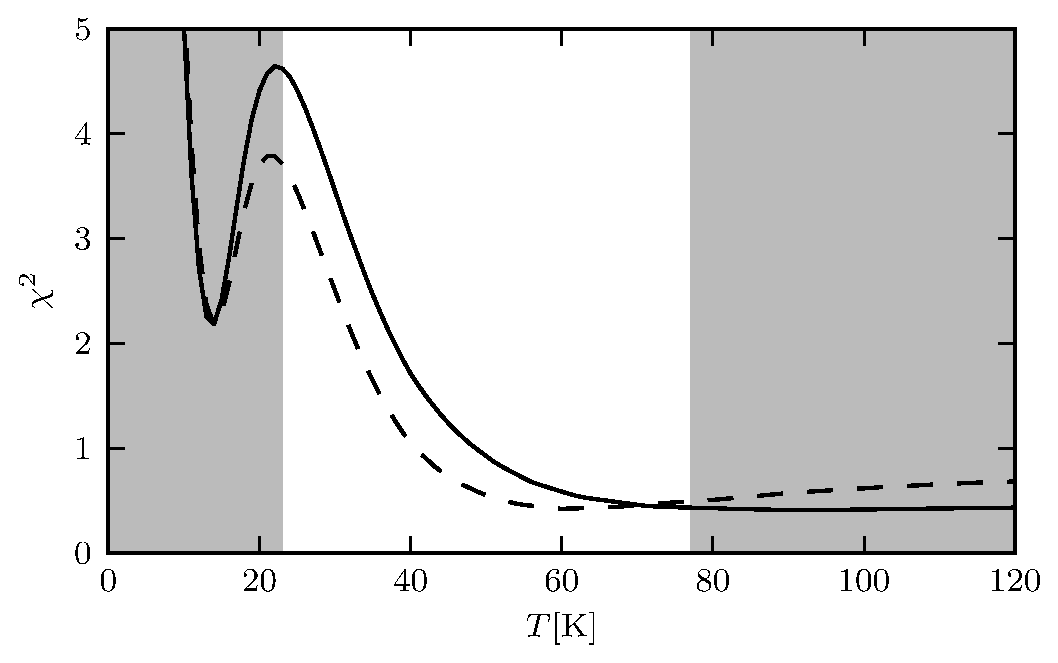
RADEX calculations are run on each of the individual pixels in the ridges to investigate which uniform temperature fits the data best. This non-LTE model is tested with uniform H2 densities of , , , and cm-3, and the column density is set to be a free parameter across the cloud. The two ridges are treated separately, and the most likely temperature of each ridge is established by calculating the of the intensities modelled by RADEX compared to the observed intensities, and then minimising the median of these values for all pixels in each ridge. The temperatures where the optical depth of any of the lines is negative are excluded (a negative corresponds to masing, which is very unlikely to occur on these large scales, which removes some high-temperature solutions). Temperatures where the optical depth of the H2CO 303–202 line is greater than 10 are also discarded (this is more than an order of magnitude larger than the average value estimated in Sect. 4.1.1, which excludes some low-temperature solutions).
From the RADEX calculations, it is found that the density must be higher than cm-3, since densities lower than that require a very high optical thickness () to produce the observed intensities in several positions at reasonable temperatures ( K). The optical depths found at cm-3 are more likely, but for the highest temperatures ( K), one or several of the lines would be masing. The lowest- temperatures (excluding and ) for each of the fits can be found in Table 5, where it can be seen that the best fits give temperatures of at least 50 K in the southern ridge in any scenario (see also Fig. 11). From Fig. 12, it can also be found that given the most likely column densities estimated from the optical depth (see Sect. 4.1.1), the temperature is higher than 25 K in the northern ridge and higher than 30 K in the southern ridge with certainty. Consequently, both the temperatures and densities in the region are likely considerably higher than the 10–15 K and – cm-3 expected in pre-stellar cores (Bergin & Tafalla, 2007; Ward-Thompson et al., 2007). The best-fit column densities are shown in Fig. 13, and lie around – cm-2 in both ridges (slightly higher in the southern ridge than in the northern).
| in N ridge | in S ridge | |
|---|---|---|
| [K] | [K] | |
| –a𝑎aa𝑎a for the H2CO 303–202 line for all where median . | –a𝑎aa𝑎a for the H2CO 303–202 line for all where median . | |
| b𝑏bb𝑏bThe higher temperature limit corresponds to the limit where at least one of the lines starts to mase (). | b𝑏bb𝑏bThe higher temperature limit corresponds to the limit where at least one of the lines starts to mase (). | |
| b𝑏bb𝑏bThe higher temperature limit corresponds to the limit where at least one of the lines starts to mase (). | b𝑏bb𝑏bThe higher temperature limit corresponds to the limit where at least one of the lines starts to mase (). | |
In all the fits, a dip in the fit around 15 K is found. This is not the minimum-, but still within the limit. However, those low-temperature fits always require very high optical depths ( for cm-3, for cm-3), which is one to two orders of magnitude higher than the optical depth averaged over an APEX beam centred at IRS7B (see Sect. 4.1.1). If we assume an H2CO/H2 ratio in the order of (Jørgensen et al., 2005), and that the source is spherical and has a size in the order of 1″, the observed line strengths would require an H2 density in the spherical cloud in the order of – cm-3 assuming the low-temperature solution. The high-temperature solution is thus much more likely.
5 Discussion
5.1 Internal vs. external heating
It was not possible to fit the observed line intensities with temperatures lower than 35 K in either the LTE models or the non-LTE models of the physical properties of the cloud. More likely, the temperatures in both ridges lie around 50–60 K, and perhaps as high as 90–100 K in a few clumps south of SMM 1A. SMM 1C lies on the southern border of the northern ridge, but IRS7A and IRS7B do not belong to any of the ridges. In the regions between the ridges, the column densities are approximately an order of magnitude lower than in the ridges. The temperatures around the YSOs are likely also somewhat lower (30–50 K) than in the ridges, but these estimates are not as reliable, since the S/N levels are lower in these regions.
According to dust radiative transfer calculations, the temperature of the envelope heated only by an internal 20 Class 0/I YSO will at most reach at most 30 K on the scales of 1 000 AU (see, e.g., Jørgensen et al., 2006, and references therein). For protostars with even lower luminosities, such as the YSOs in IRS7, the internal heating should be of even lesser importance, and on the scales of the resolution of the SMA data (400–800 AU) temperatures in the order of 50–60 K as a result of internal heating are unrealistic. However, if heating from an external UV field is applied, the models discussed below show that it is possible to reach the measured temperatures.
Not only does the region south of IRS7 show high H2CO temperatures, the 850 µm dust emission also has a strong peak southwest of the strongest H2CO peak (see Fig. 7). This dust emission peak coincides well with the temperature peak ( K) in the rotational temperature map (Fig. 8). Thus, the higher rotational temperature measured in the peaks could also be an optical depth effect caused by the high column density.
The angular separation between R CrA and SMM 1A is approximately 50″, which corresponds to a projected separation of 6 500 AU assuming the distance of 130 pc to the cloud (Neuhäuser & Forbrich, 2008). If the luminosity of R CrA is assumed to be (Bibo et al., 1992), its surface temperature should be in the order of K. Assuming a black body with this temperature, slightly less than of its luminosity () would fall in the UV range between 300 nm and 13.6 eV. Such a star would increase the interstellar radiation field (ISRF) by a factor of at the distance 6 500 AU, assuming an interstellar radiation field of erg cm-2 s-1 (twice the Habing flux). For a slightly lower luminosity for R CrA ( is the lower limit given by Bibo et al., 1992), and the distance being somewhat higher (if R CrA and SMM 1A are not in the same plane of sky), . Such high UV fluxes would create a Photon Dominated Region (PDR), which would give rise to high CN abundances, in agreement with Watanabe et al. (2012).
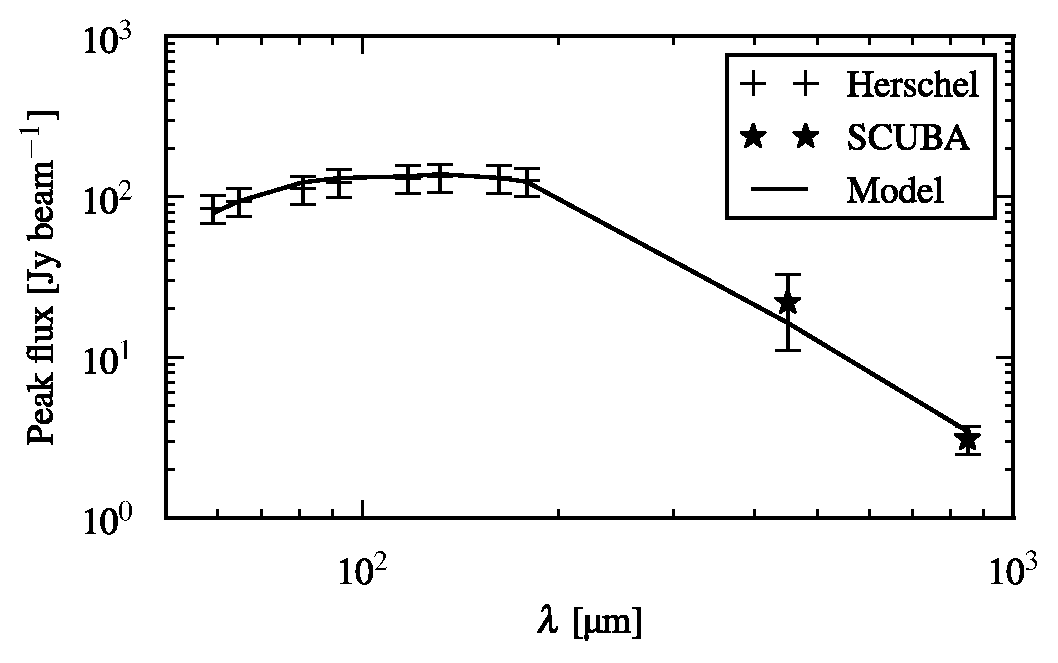
To estimate the relative importance between internal and external heating, we constructed a 1-dimensional model for the envelope around IRS7B using the dust radiative transfer code Transphere (Dullemond et al., 2002). We assumed a power-law density profile for the envelope with and then varied the density profile normalisation, envelope size, central source luminosity, and interstellar radiation field. We adopted the dust opacities from Ossenkopf & Henning (1994) corresponding to coagulated dust grains with thin ice mantles (OH5). Transphere calculates the self-consistent temperature in the spherical envelope with these parameters. For comparison to the observations we subsequently used the SKY ray-tracer from the RATRAN radiative transfer code (Hogerheijde & van der Tak, 2000) to calculate continuum maps at different wavelengths. To allow for comparison with SCUBA and Herschel SED fluxes, the envelope dust emission at the corresponding telescope primary beam edges was subtracted from the peak emission. This difference was then compared to measured SCUBA (Nutter et al., 2005) and Herschel (Lindberg et al., in prep.) continuum fluxes.
The SED produced by the best fit (with both internal and external heating) is compared to the SCUBA and Herschel continuum fluxes in Fig. 14. The eight wavelengths at which the Herschel fluxes were estimated were chosen to cover each of the four PACS bands with two data points equidistant from the band edges and each other. The systematic continuum data errors are estimated to of the fluxes for the Herschel data (Green et al., in prep.), and and for the 450 µm and 850 µm SCUBA data, respectively (Di Francesco et al., 2008). The best fit was produced for a central source of , with an envelope between AU and AU with , cm-3 at the reference radius AU (corresponding to an envelope mass of ), and an interstellar radiation field with .
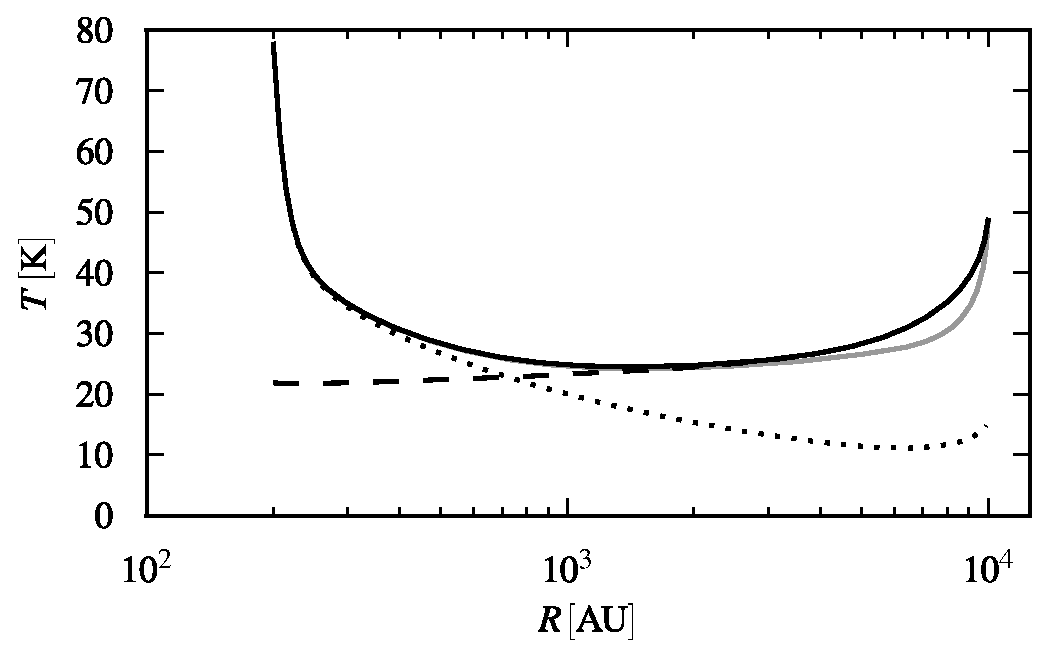
The calculated temperature profile is shown in Fig. 15, where K for AU, the distance between IRS7B and SMM 1A. Also shown is the model without the external radiation field: as argued above, in this model the temperature drops below 20 K at radii larger than about 700 AU, thus not reproducing the large-scale temperatures observed in SMA/APEX data. In contrast, in the model with the enhanced external radiation, the temperature never drops below 25 K, and increases reaching 50 K in the outermost regions of the envelope. With an enhanced external radiation field () and no internal source of heating, the temperature stays above 20 K in the whole envelope.
Naturally, this 1-dimensional model is a simplified description of the physical properties in the region. For example, it is unlikely that the density profile continues to follow the power-law at large radii. Since we see H2CO emission in the whole field, the density should at least exceed the effective density of the H2CO transitions, i.e. at least be in the order of cm-3 (Evans, 1999). Adding an ambient density of cm-3 to the density profile only marginally changes the temperature profile (Fig. 15).
The 1-dimensional model is also a simplification since R CrA in reality would cause a radiation field that decreases from northwest to southeast, instead of acting constantly from all directions. The fact that the northern ridge has a lower measured temperature than the southern ridge, despite having a smaller angular separation with R CrA, is most likely a geometric effect. Either it is caused by extinction and local density distribution differences, or the ridges simply are positioned at different distances from us, making the actual distance between the northern ridge and R CrA larger than that between the southern ridge and R CrA. The difference in LSR velocities between the ridges do suggest that they are situated in different planes of sky. Still, this simplified model is useful for a first interpretation of the data at hand. It shows that the relatively high temperatures in the ridges cannot be explained by the internal heating from the protostars, but that they instead can be explained by R CrA acting as an external heating source upon the envelope.
5.2 Implications
As demonstrated based on the radiative transfer models (Sect. 5.1), the temperature in the protostellar envelope of IRS7B is currently above 20 K due to the irradiation by R CrA. This may have important implications for the chemistry of the envelope and thus potentially also the composition of the the emerging circumstellar disc.
The gas-phase chemistry of the protostellar envelope would be dominated by radicals such as CN and C2H prominent in PDRs or regions of protostellar envelopes affected by strong UV irradiation (e.g., Jansen et al., 1995; Sternberg & Dalgarno, 1995; Fuente et al., 1995; Jørgensen, 2004). In fact, in the line survey of IRS7B by Watanabe et al. (2012), an over-abundance of these species is seen.
The strong UV irradiation may, however, also affect the grain surface chemistry, potentially leading to the formation of more complex organic species. If R CrA has been as luminous throughout the evolution of IRS7B (from the time of its dense prestellar core stage) this would have hindered significant freeze-out of molecules such as CO, CH4, and N2, being some of the starting points for grain-surface reactions leading to zeroth generation species such as CH3OH (Herbst & van Dishoeck, 2009). However, if R CrA itself has undergone significant evolution in terms of luminosity it may just as well have stimulated the formation of complex organic molecules through the photochemistry in CH3OH-rich ices (Öberg et al., 2009). With the present observational data, it is difficult to distinguish these scenarios: the low internal luminosity of IRS7B means that the regions where complex organic species will return to the gas-phase are small ( AU) and severely diluted in typical single-dish beams. Future high angular resolution observations with ALMA will, however, reveal emission of complex organic molecules if present.
6 Conclusions
We have presented high angular resolution observations of young stars in the region of R CrA from the Submillimeter Array augmented by short-spacing maps from the APEX single-dish telescope. Together the observations reveal the physical and chemical structure of the environment of the deeply embedded protostars on scales from 400 to 8 000 AU. The main conclusions of the paper are:
-
1.
In the combined SMA/APEX data, we find two extended ridges of luminous H2CO emission. They are not associated with the YSOs previously observed in the IRS7 region. The H2CO emission extends across the whole field-of-view of the observations, spanning more than AU.
-
2.
The physical temperatures in the two ridges around IRS7 were estimated with both LTE and non-LTE methods. They were in both cases found to be no lower than 30 K, more likely 50–60 K. These temperatures are too high to be attributed to internal heating from the low-mass YSOs in the region. The peculiar shape of the ridges, and their location with respect to the YSOs, also suggest that this region is strongly affected by external heating.
-
3.
The primary suspect for the external heating of the ridges is R CrA, a Herbig Be star in the northwestern parts of the cloud. The morphology of the H2CO-luminous ridges is relatively symmetric around the YSOs, which could indicate that the ridges are parts of a spherical shell around the low-mass YSOs.
-
4.
It was possible through radiative transfer modelling to explain the elevated temperatures by the UV radiative contribution from R CrA. As discussed in Sect. 1, earlier studies have shown that the evolution of a protostar can be affected by high-mass stars in their environments, but this study suggests that also intermediate-mass stars can have a noticeable effect on the physical properties in a whole protostellar envelope. The model also suggests an internal luminosity of and an envelope mass of for R CrA IRS7B.
-
5.
The higher temperature of the southern ridge as compared to that of the northern ridge suggests that the southern ridge is actually closer to R CrA than the northern ridge is, as a projection effect of the ridges being situated in different planes of sky.
-
6.
The strong UV flux from R CrA obviously has an impact on the gas-phase chemistry on large scales in the region. Potentially it could also be critical for the ice chemistry, either inhibiting CO freeze-out or promoting formation of complex organics. The effect on the chemistry depends on how early in the evolution of the protostellar envelope around IRS7B the luminosity from R CrA started to dominate the region. The elevated temperature in the cloud could also explain the unusual chemistry in the region, since much of the CO would evaporate from the dust grains at a very early stage, which would make the formation of complex organics on the dust grains inhibited.
This paper demonstrates the importance of understanding the nearby environment in the studies of protostars, and also the need for high-resolution observations. Unresolved single-dish observations of regions similar to IRS7 would not have shown the large-structure high-temperature gas found in this study, and without the knowledge of these structures, a high H2CO temperature would likely have been attributed to the central source. Single-dish observations might still be useful in the comparison of the excitation of different molecules given the prior knowledge from this work. Thus, we suggest observations of more molecular lines to establish whether the high rotational temperature of H2CO is reflected also in other species.
With the advent of ALMA, even more high-resolved studies of protostars will be made possible, making investigations where heating of the envelope from the central source and external stars are possible to distinguish. To study the more central and warmer parts of the protostellar envelopes, observations of higher frequency are needed. Such observations are currently being provided by Herschel Space Observatory, and will be discussed in a future paper (Lindberg et al., in prep.). These observations will make it possible to study whether the high level of excitation of the molecular gas is mainly caused by a PDR or by shocks.
Acknowledgements.
We would like to thank the anonymous referee for comments and suggestions, which helped improving the manuscript. This research was supported by a grant from the Instrument Center for Danish Astrophysics (IDA) and a Lundbeck Foundation Group Leader Fellowship to JKJ. Research at Centre for Star and Planet Formation is funded by the Danish National Research Foundation and the University of Copenhagen’s programme of excellence.References
- André et al. (1993) André, P., Ward-Thompson, D., & Barsony, M. 1993, ApJ, 406, 122
- André et al. (2000) André, P., Ward-Thompson, D., & Barsony, M. 2000, Protostars and Planets IV, 59
- Bergin & Tafalla (2007) Bergin, E. A. & Tafalla, M. 2007, ARA&A, 45, 339
- Bibo et al. (1992) Bibo, E. A., Thé, P. S., & Dawanas, D. N. 1992, A&A, 260, 293
- Bottinelli et al. (2004a) Bottinelli, S., Ceccarelli, C., Lefloch, B., et al. 2004a, ApJ, 615, 354
- Bottinelli et al. (2004b) Bottinelli, S., Ceccarelli, C., Neri, R., et al. 2004b, ApJ, 617, L69
- Brown (1987) Brown, A. 1987, ApJ, 322, L31
- Ceccarelli et al. (2007) Ceccarelli, C., Caselli, P., Herbst, E., Tielens, A. G. G. M., & Caux, E. 2007, Protostars and Planets V, 47
- Chen & Arce (2010) Chen, X. & Arce, H. G. 2010, ApJ, 720, L169
- Choi et al. (2008) Choi, M., Hamaguchi, K., Lee, J., & Tatematsu, K. 2008, ApJ, 687, 406
- Di Francesco et al. (2008) Di Francesco, J., Johnstone, D., Kirk, H., MacKenzie, T., & Ledwosinska, E. 2008, ApJS, 175, 277
- Dickens & Irvine (1999) Dickens, J. E. & Irvine, W. M. 1999, ApJ, 518, 733
- Dullemond et al. (2002) Dullemond, C. P., van Zadelhoff, G. J., & Natta, A. 2002, A&A, 389, 464
- Evans (1999) Evans, II, N. J. 1999, ARA&A, 37, 311
- Forbrich et al. (2006) Forbrich, J., Preibisch, T., & Menten, K. M. 2006, A&A, 446, 155
- Fuente et al. (1995) Fuente, A., Martín-Pintado, J., & Gaume, R. 1995, ApJ, 442, L33
- Goldsmith & Langer (1999) Goldsmith, P. F. & Langer, W. D. 1999, ApJ, 517, 209
- Gray et al. (2006) Gray, R. O., Corbally, C. J., Garrison, R. F., et al. 2006, AJ, 132, 161
- Green (1991) Green, S. 1991, ApJS, 76, 979
- Groppi et al. (2007) Groppi, C. E., Hunter, T. R., Blundell, R., & Sandell, G. 2007, ApJ, 670, 489
- Harju et al. (1993) Harju, J., Haikala, L. K., Mattila, K., et al. 1993, A&A, 278, 569
- Hartigan & Graham (1987) Hartigan, P. & Graham, J. A. 1987, AJ, 93, 913
- Herbst & van Dishoeck (2009) Herbst, E. & van Dishoeck, E. F. 2009, ARA&A, 47, 427
- Ho et al. (2004) Ho, P. T. P., Moran, J. M., & Lo, K. Y. 2004, ApJ, 616, L1
- Hogerheijde & van der Tak (2000) Hogerheijde, M. R. & van der Tak, F. F. S. 2000, A&A, 362, 697
- Jansen et al. (1995) Jansen, D. J., Spaans, M., Hogerheijde, M. R., & van Dishoeck, E. F. 1995, A&A, 303, 541
- Johnstone et al. (1998) Johnstone, D., Hollenbach, D., & Bally, J. 1998, ApJ, 499, 758
- Jørgensen (2004) Jørgensen, J. K. 2004, A&A, 424, 589
- Jørgensen et al. (2007) Jørgensen, J. K., Bourke, T. L., Myers, P. C., et al. 2007, ApJ, 659, 479
- Jørgensen et al. (2006) Jørgensen, J. K., Johnstone, D., van Dishoeck, E. F., & Doty, S. D. 2006, A&A, 449, 609
- Jørgensen et al. (2005) Jørgensen, J. K., Schöier, F. L., & van Dishoeck, E. F. 2005, A&A, 437, 501
- Mangum & Wootten (1993) Mangum, J. G. & Wootten, A. 1993, ApJS, 89, 123
- Maret et al. (2004) Maret, S., Ceccarelli, C., Caux, E., et al. 2004, A&A, 416, 577
- Miettinen et al. (2008) Miettinen, O., Kontinen, S., Harju, J., & Higdon, J. L. 2008, A&A, 486, 799
- Müller et al. (2001) Müller, H. S. P., Thorwirth, S., Roth, D. A., & Winnewisser, G. 2001, A&A, 370, L49
- Neuhäuser & Forbrich (2008) Neuhäuser, R. & Forbrich, J. 2008, in Handbook of Star Forming Regions, Volume II: The Southern Sky, ed. Reipurth, B. (ASP Monographs; San Francisco, CA; ASP), 735
- Nutter et al. (2005) Nutter, D. J., Ward-Thompson, D., & André, P. 2005, MNRAS, 357, 975
- Öberg et al. (2009) Öberg, K. I., Garrod, R. T., van Dishoeck, E. F., & Linnartz, H. 2009, A&A, 504, 891
- O’Dell et al. (1993) O’Dell, C. R., Wen, Z., & Hu, X. 1993, ApJ, 410, 696
- Ossenkopf & Henning (1994) Ossenkopf, V. & Henning, T. 1994, A&A, 291, 943
- Peterson et al. (2011) Peterson, D. E., Caratti o Garatti, A., Bourke, T. L., et al. 2011, ApJS, 194, 43
- Pickett et al. (1998) Pickett, H. M., Poynter, R. L., Cohen, E. A., et al. 1998, J. Quant. Spec. Radiat. Transf., 60, 883
- Qi (2012) Qi, C. 2012, The MIR Cookbook, The Submillimeter Array / Harvard-Smithsonian Center for Astrophysics (http://cfa-www.harvard.edu/cqi/mircook.html)
- Sakai et al. (2009a) Sakai, N., Sakai, T., Hirota, T., Burton, M., & Yamamoto, S. 2009a, ApJ, 697, 769
- Sakai et al. (2009b) Sakai, N., Sakai, T., Hirota, T., & Yamamoto, S. 2009b, ApJ, 702, 1025
- Sault et al. (1995) Sault, R. J., Teuben, P. J., & Wright, M. C. H. 1995, in Astronomical Society of the Pacific Conference Series, Vol. 77, Astronomical Data Analysis Software and Systems IV, ed. R. A. Shaw, H. E. Payne, & J. J. E. Hayes, 433
- Schöier et al. (2006) Schöier, F. L., Jørgensen, J. K., Pontoppidan, K. M., & Lundgren, A. A. 2006, A&A, 454, L67
- Schöier et al. (2005) Schöier, F. L., van der Tak, F. F. S., van Dishoeck, E. F., & Black, J. H. 2005, A&A, 432, 369
- Sternberg & Dalgarno (1995) Sternberg, A. & Dalgarno, A. 1995, ApJS, 99, 565
- Takakuwa et al. (2003) Takakuwa, S., Kamazaki, T., Saito, M., & Hirano, N. 2003, ApJ, 584, 818
- Taylor & Storey (1984) Taylor, K. N. R. & Storey, J. W. V. 1984, MNRAS, 209, 5P
- Tielens & Hollenbach (1985a) Tielens, A. G. G. M. & Hollenbach, D. 1985a, ApJ, 291, 747
- Tielens & Hollenbach (1985b) Tielens, A. G. G. M. & Hollenbach, D. 1985b, ApJ, 291, 722
- van der Tak et al. (2007) van der Tak, F. F. S., Black, J. H., Schöier, F. L., Jansen, D. J., & van Dishoeck, E. F. 2007, A&A, 468, 627
- Wang et al. (2004) Wang, H., Mundt, R., Henning, T., & Apai, D. 2004, ApJ, 617, 1191
- Ward-Thompson et al. (2007) Ward-Thompson, D., André, P., Crutcher, R., et al. 2007, Protostars and Planets V, 33
- Watanabe et al. (2012) Watanabe, Y., Sakai, N., Lindberg, J. E., et al. 2012, ApJ, 745, 126
- Weiß et al. (2001) Weiß, A., Neininger, N., Hüttemeister, S., & Klein, U. 2001, A&A, 365, 571
- Wilson & Rood (1994) Wilson, T. L. & Rood, R. 1994, ARA&A, 32, 191
Appendix A Spectral line channel maps
