Anisotropic spin-dynamics in the Kondo semiconductor CeRu2Al10
Abstract
Spin dynamics in the new Kondo insulator compound CeRu2Al10 has been studied using unpolarized and polarized neutron scattering on single crystals. In the unconventional ordered phase forming below K, two excitation branches are observed with significant intensities, the lower one of which has a gap of meV and a pronounced dispersion up to meV. Comparison with RPA magnon calculations assuming crystal-field and anisotropic exchange couplings captures major aspects of the data, but leaves unexplained discrepancies, pointing to a key role of direction-specific hybridization between 4 and conduction band states in this compound.
pacs:
71.27.+a, 75.20.Hr, 75.30.Ds, 75.30.Gw, 75.30.Mb, 78.70.NxThe CeAl10 ( Fe, Ru, Os) compounds form a new family of Ce-based intermetallic materials with fascinating, but hitherto elusive, magnetic and transport properties. Below room temperature, they show evidence of a Kondo-insulator regime, with an increase in the electrical resistivity on cooling ascribed to the opening of a narrow “hybridization gap” in the electronic density of states Nishioka et al. (2009); Strydom (2009). In the standard approach Riseborough (2000), this mechanism should ultimately lead to a nonmagnetic, many-body singlet ground state for , as was observed experimentally for the vast majority of Kondo-insulator compounds known to date. In contrast, CeRu2Al10 and CeOs2Al10 order magnetically below K and 28.7 K, respectively Nishioka et al. (2009). Their structure is antiferromagnetic (AF) with the simple wavevector Robert et al. (2010); Khalyavin et al. (2010); Mignot et al. (2011). However, there is strong experimental evidence that this ordering cannot be explained by conventional Ruderman-Kittel Kasuya-Yosida (RKKY) exchange alone: seems unrealistically high in view of the large Ce–Ce interatomic distances (5.26 Å), of the weak ordered antiferromagnetic moment (– Mignot et al. (2011); Khalyavin et al. (2010); Kato et al. (2011) for Ru) derived from neutron diffraction measurements, and of the much lower Néel temperatures found in other Ru2Al10 compounds ( K in GdRu2Al10 Kobayashi et al. (2011)). It was also reported that increases with the application of pressure Nishioka et al. (2009), contrary to the general trend in Ce Kondo compounds. This unique situation has attracted considerable interest because it seems to challenge widely accepted views on Kondo insulators. Various interpretations have been proposed in terms of () a charge density wave associated with an energy gap opening preferentially along the direction Kimura et al. (2011a, b), () a spin-Peierls state due to the formation of spin-singlet pairs Tanida et al. (2010a); Hanzawa (2010a, b), or () a resonating-valence-bond state Hanzawa (2011). Quite remarkably, despite the large anisotropy of the paramagnetic susceptibility with , the ordered AF moments align along the direction Khalyavin et al. (2010); Mignot et al. (2011). In Refs. Kondo et al. (2011); Tanida et al. (2012), this discrepancy was suggested to arise from conduction-electron–-electron (–) hybridization occurring predominantly along , and suppressing accordingly through the formation of a (Kondo) spin singlet. A detailed study of the spin dynamics is of primary importance to sort out this problem. Inelastic neutron scattering (INS) experiments performed previously on powder samples have evidenced the opening of a large spin-gap in the ordered state, with a broad excitation centered at meV and 11 meV in CeRu2Al10 Robert et al. (2010) and CeOs2Al10 Adroja et al. (2010), respectively. However, mode dispersion and anisotropy were obscured by powder averaging, and it could not be decided whether the observed magnetic signal arose from dispersive magnon branches with an anisotropy gap or, e.g., from singlet-triplet transitions with sizable dispersion and/or damping. The possibility of a lattice contribution could also not be ruled out. In this Letter, we report unpolarized and polarized INS experiments performed on single-crystal CeRu2Al10. The spectra reveal well-defined dispersive excitations with a gap of 4.8 meV at the AF zone center. They exhibit a remarkable anisotropy which does not correspond to a standard precession of spin wave modes. Overall agreement with the experimental results can be achieved phenomenologically in a RPA model by assuming a strongly anisotropic bilinear exchange interaction . However, remaining inconsistencies are thought to reflect anisotropic hybridization effects, whose role was suspected from previous studies Tanida et al. (2012).
Thirteen single crystals of CeRu2Al10 (orthorhombic, space group, No. 63) with dimensions comprised between 1 and 4 mm, for a total mass of about 500 mg, were grown by an Al-flux method, and co-aligned with their axes vertical on an Al sample holder. An effective mosaicity of about 3 degrees was estimated from the neutron rocking curves, which was sufficient for the present experiment. Excitation spectra were measured in the scattering plane, first using unpolarized neutrons on the 2T triple-axis spectrometer at LLB-Orphée (Saclay), then with linear polarization analysis on IN20 at the ILL (Grenoble). Finally, the crystals were reoriented with the axis vertical on a lighter sample holder, and measured with unpolarized neutrons on IN8 (ILL) in a 6 T cryomagnet. Spectra were recorded at fixed final energy, meV, using a pyrolytic graphite, PG002 (2T) or Si111 (IN8) monochromator and a PG002 analyzer, with a PG filter placed on the scattered beam, or (polarized neutrons on IN20) a Heussler monochromator and analyzer.
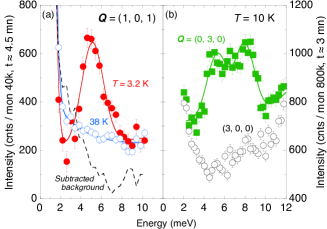
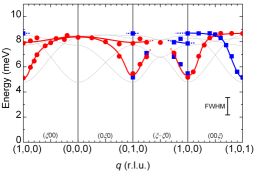
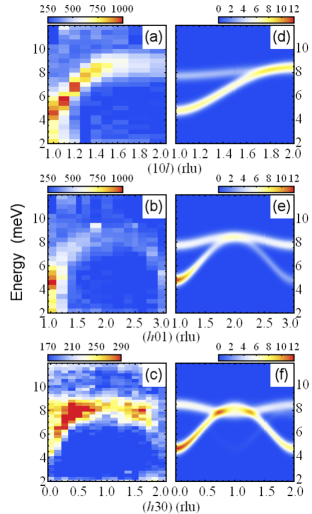
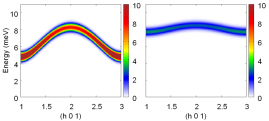
Constant- scans have been performed using unpolarized neutrons for momentum transfers lying in the (, ) (2T) and (, ) (IN8) planes. Representative spectra are presented in Fig. 1. For K (2T) or 10 K (IN8), one or two distinct modes are visible depending on the vector. The dispersion is significant, with a gap of meV at the AF zone centers (Fig. 2). Near the zone boundary, the excitations reach meV, with a flat region corresponding to the peak observed just above 8 meV in the previous powder experiments Robert et al. (2010). Intensity maps for three particular directions, , and , are presented in Fig. 3. The existence of (at least) two modes is best evidenced in scans at , e.g. for . On the other hand, the lower branch shows no detectable intensity at the AF vector (1, 0, 2) (of the form with even), as shown in Fig. 3(a). Another important observation is that the magnetic intensity of the lower branch is strongly suppressed for scattering vectors whose orientation is close to the axis, such as = (3, 0, 0) as compared to (0, 3, 0) (Fig. 1). This suggests that dynamical correlations and between moment components perpendicular to the axis are weak, and correlations dominate the magnetic response. When temperature increases to K , the inelastic magnetic peak at meV is suppressed and replaced by a sloping intensity at low energy. The latter signal shows no pronounced dependence [apart from the appearance of a strong extra background near = (1, 0, 1), see Fig. 1(a)], and is thus ascribed to quasielastic (QE) fluctuations. Spectra along , , and were also measured at the base temperature in an applied field () of 5 T, above the moment reorientation transition from to , known to occur at T Tanida et al. (2010b, 2011). No sizable change was observed with respect to the data.
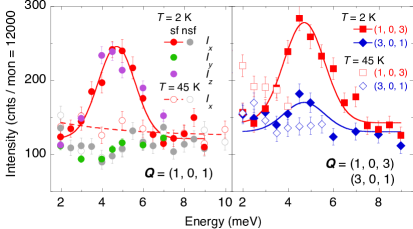
Neutron polarization analysis provides further insight into the anisotropy of the magnetic response. Fig. 4 (upper frames) shows intensities measured in the spin-flip (SF) and non-spin-flip (NSF) channels at different scattering vectors. Let us first consider the results for . One sees that the NSF signal (measured with the incident polarization ) is featureless and temperature independent, confirming the magnetic origin of both the 4.8-meV peak below 10 K and the QE signal at found in the unpolarized neutron experiments. The SF intensities measured for different directions of incident polarization or 111The standard notation is used, in which is oriented along , normal to the scattering plane, and forms a direct coordinate system. are found to fulfill and . Using the standard expressions Regnault (2001)
| (1a) | ||||
| (1b) | ||||
| (1c) | ||||
where is the dynamic structure factor associated with pair correlations of the moment component (), and the angle between and the axis, one comes to the conclusion that correlations of the components must vanish to the precision of the present measurement. For , is very close to 45∘ since the lattice parameters and are nearly equal. In contrast, the scattering vectors and (3, 0, 1) correspond to the same reduced vector (AF zone center) and nearly equal values of the dipole magnetic form factor, but their angles are quite different (71.6∘ and 18.4∘, respectively). From Fig. 4, the ratio of the magnetic excitation intensities for those two spectra is about 3.25, which implies that correlations of components dominate. Assuming to be strictly zero, and solving Eqns. 1a and 1c, one gets . In a magnon picture, such a difference can be understood by noting that and correspond, respectively, to transverse and longitudinal excitation modes of the AF magnetic structure. On the other hand, the strong difference between the transverse components along and is quite remarkable and requires a very unusual anisotropy to exist in this material.
To analyze this magnetic response, we have performed calculations assuming bilinear exchange interactions, , between near-neighbor Ce sites. Both a standard spin wave model, and random-phase approximation (RPA) calculations were investigated. In the following, we will focus on the second approach, which can treat anisotropy effects in a more realistic way. The crystal-field (CF) parameters for the Ce3+ ground state, K, choosing as the quantization axis, were taken from Strigari’s work Strigari et al. (2012), and correspond to a sequence of three doublets at 0, 354 K, and 535 K. The resulting single-ion anisotropy has an easy axis, as required by the magnetic susceptibility measured in the paramagnetic regime. Therefore, in this simple picture, one has to assume that is much larger than and to ensure that the AF ordered moments properly align along the axis.
| Ce pairs | |||
|---|---|---|---|
| (1,4); (2,3) | 2.7 | 2.7 | 58 |
| (1,3); (2,4) | -0.9 | -0.9 | -0.9 |
| . (1,2); (3,4) | 1.1 | 1.1 | 1.1 |
Fair overall agreement can be obtained between the calculations and the experimental excitation spectra below , using the set of exchange constants listed in Table 1. As can be seen in Fig. 3, the observation of two branches with significant spectral weight (from a total of 4), as well as the general dependence of their intensities along different symmetry directions, or the anisotropy of the correlations (Fig. 4, lower frames) can be accounted for. Furthermore, salient features of the experimental data are well reproduced in the calculations, such as the vanishing of the lower dispersive branch near the (1,0,2) AF zone center (upper frames in Fig. 3), or the significant intensity exhibited by the upper branch near [lower frames, in accordance with Fig. 1 (b)], in contrast to, e.g., [upper frames and Fig. 1(a)]. On the other hand, notable quantitative differences exist: the initial slopes of the dispersions are much steeper than predicted by the calculation, and the calculated energy of the upper mode is too high. We believe that this discrepancy results from the unrealistically large value required to keep the ordered moments aligned along the axis despite the strong single-ion anisotropy favoring the axis. Simulations done in the simpler Holstein-Primakoff spin-wave approximation indeed showed that the agreement improves if one reduces this single-ion anisotropy and, correspondingly, the anisotropic component of the exchange tensor. Recent simulations performed in a mean-field, two-sublattice, model Kunimori et al. further indicate that anisotropic exchange parameters large enough to overcome the single-ion -axis anisotropy inevitably result in a large ordered moment, contrary to the experimental observation of –. This could raises the question of whether the CF model of Ref. Strigari et al. (2012) used in the present calculations overestimate the single-ion anisotropy. Meanwhile, there is growing experimental evidence, as discussed in recent papers Kimura et al. (2011a); Tanida et al. (2012), that direction-selective hybridization of orbitals with conduction band states plays a key role in the peculiar magnetism of the CeAl10 compounds. This has been proposed to explain the anomalous magnitude of the single-ion anisotropy in CeRu2Al10, as compared to that of NdAl10, as well as the lack of a sizable anomaly () in the longitudinal magnetostriction at the critical field T where the AF moment direction reorients from to Tanida et al. (2012) (possibly related to the intriguing lack of field dependence of the magnetic excitation spectra found in the present measurements). It has been argued Moriyoshi et al. that, owing to specifics of the YbFe2Al10-type crystal structure, – hybridization takes place predominantly within the plane, especially with the Al(2) atoms located in the direction with respect to the Ce site. This hybridization could result in a suppression of the magnetic components along , thereby favoring the alignment of the ordered AF moments along . Such a picture provides an appealing physical basis for the reduction of the single-ion anisotropy hypothesized in the above discussion. In the case of CeOs2Al10, it has been argued Kondo et al. (2011) that the gap in the magnetic excitation spectrum, associated with the formation of a singlet state, starts to develop below the temperature of the maximum in the magnetic susceptibility , well above the onset of the AF order. Such effects are clearly beyond the scope of the simple magnon model presented above, which basically treats the spin gap as an anisotropy gap, but should be included in a more realistic treatment.
In conclusion, the present study provides detailed insight into the spin dynamics of CeRu2Al10, and emphasizes the most peculiar anisotropy of the magnetic correlations occurring in the AF ordered state. The results could be partly accounted for using a magnon model treated in the RPA approximation. However quantitative discrepancies suggest that this picture should be regarded as phenomenological, and support the idea that anisotropic – hybridization plays a key role in this material. Proper theoretical consideration of such effects should open the way to a unifying view of static and dynamic aspects of magnetism in this family of compounds.
Acknowledgements.
We thank P. Baroni and F. Maignen for technical support, and E. Wheeler and A. S. Ivanov for help during the work at the ILL.References
- Nishioka et al. (2009) T. Nishioka, Y. Kawamura, T. Takesaka, R. Kobayashi, H. Kato, M. Matsumura, K. Kodama, K. Matsubayashi, and Y. Uwatoko, J. Phys. Soc. Jpn. 78, 123705 (2009).
- Strydom (2009) A. M. Strydom, Physica B 404, 2981 (2009).
- Riseborough (2000) P. S. Riseborough, Adv. Phys. 49, 257 (2000).
- Robert et al. (2010) J. Robert, J.-M. Mignot, G. André, T. Nishioka, R. Kobayashi, M. Matsumura, H. Tanida, D. Tanaka, and M. Sera, Phys. Rev. B 82, 100404(R) (2010).
- Khalyavin et al. (2010) D. D. Khalyavin, A. D. Hillier, D. T. Adroja, A. M. Strydom, P. Manuel, L. C. Chapon, P. Peratheepan, K. Knight, P. Deen, C. Ritter, Y. Muro, and T. Takabatake, Phys. Rev. B 82, 100405 (2010).
- Mignot et al. (2011) J. M. Mignot, J. Robert, G. André, A. M. Bataille, T. Nishioka, R. Kobayashi, M. Matsumura, H. Tanida, D. Tanaka, and M. Sera, J. Phys. Soc. Jpn. Suppl. 80SA, SA022 (2011).
- Kato et al. (2011) H. Kato, R. Kobayashi, T. Takesaka, T. Nishioka, M. Matsumura, K. Kaneko, and N. Metoki, Journal of the Physical Society of Japan Supplement 80, 073701 (2011).
- Kobayashi et al. (2011) R. Kobayashi, Y. Kawamura, T. Nishioka, H. Kato, M. Matsumura, K. Kodama, H. Tanida, M. Sera, K. Matsubayashi, and Y. Uwakoto, J. Phys. Soc. Jpn. Suppl. 80SA, SA044 (2011).
- Kimura et al. (2011a) S.-i. Kimura, T. Iizuka, H. Miyazaki, T. Hajiri, M. Matsunami, T. Mori, A. Irizawa, Y. Muro, J. Kajino, and T. Takabatake, Phys. Rev. B 84, 165125 (2011a).
- Kimura et al. (2011b) S.-i. Kimura, T. Iizuka, H. Miyazaki, A. Irizawa, Y. Muro, and T. Takabatake, Phys. Rev. Lett. 106, 056404 (2011b).
- Tanida et al. (2010a) H. Tanida, D. Tanaka, M. Sera, C. Moriyoshi, H. Kuroiwa, T. Takesaka, T. Nishioka, H. Kato, and M. Matsumura, J. Phys. Soc. Jpn. 79, 043708 (2010a).
- Hanzawa (2010a) K. Hanzawa, J. Phys. Soc. Jpn. 79, 043710 (2010a).
- Hanzawa (2010b) K. Hanzawa, J. Phys. Soc. Jpn. 79, 084704 (2010b).
- Hanzawa (2011) K. Hanzawa, J. Phys. Soc. Jpn. 80, 023707 (2011).
- Kondo et al. (2011) A. Kondo, J. Wang, K. Kindo, Y. Ogane, Y. Kawamura, S. Tanimoto, T. Nishioka, D. Tanaka, H. Tanida, and M. Sera, Phys. Rev. B 83, 180415 (2011).
- Tanida et al. (2012) H. Tanida, Y. Nonaka, D. Tanaka, M. Sera, Y. Kawamura, Y. Uwatoko, T. Nishioka, and M. Matsumura, Phys. Rev. B 85, 205208 (2012).
- Adroja et al. (2010) D. T. Adroja, A. D. Hillier, P. P. Deen, A. M. Strydom, Y. Muro, J. Kajino, W. A. Kockelmann, T. Takabatake, V. K. Anand, J. R. Stewart, and J. Taylor, Physical Review B 82, 104405 (2010).
- Tanida et al. (2010b) H. Tanida, D. Tanaka, M. Sera, C. Moriyoshi, Y. Kuroiwa, T. Takesaka, T. Nishioka, H. Kato, and M. Matsumura, J. Phys. Soc. Jpn. 79, 083701 (2010b).
- Tanida et al. (2011) H. Tanida, D. Tanaka, Y. Nonaka, M. Sera, M. Matsumura, and T. Nishioka, Phys. Rev. B 84, 233202 (2011).
- Note (1) The standard notation is used, in which is oriented along , normal to the scattering plane, and forms a direct coordinate system.
- Regnault (2001) L.-P. Regnault, J. Phys. IV France 11, Pr9 (2001).
- Strigari et al. (2012) F. Strigari, T. Willers, Y. Muro, K. Yutani, T. Takabatake, Z. Hu, Y.-Y. Chin, S. Agrestini, H.-J. Lin, C. Chen, A. Tanaka, M. Haverkort, L. Tjeng, and A. Severing, Phys. Rev. B 86, 081105 (2012).
- (23) C. Moriyoshi, D. Tanaka, H. Tanida, M. Sera, M. Ogawa, Y. Kuroiwa, T. Nishioka, M. Matsumura, J. Kim, S. Tsuji, and M. Takata, (to be published).
- (24) K. Kunimori, S. Nakamura, H. Tanida, M. Sera, T. Nishioka, and M. Matsumura, (submitted to Phys. Rev. B).