A catalog of near-IR sources found unresolved with milliarcsecond resolution. ††thanks: Based on observations made with ESO telescopes at Paranal Observatory
Abstract
Calibration is one of the long-standing problems in optical interferometric measurements, particularly with long baselines which demand stars with angular sizes on the milliarcsecond scale and no detectable companions. While systems of calibrators have been generally established for the near-infrared in the bright source regime (K mag), modern large interferometers are sensitive to significantly fainter magnitudes. We aim at providing a list of sources found unresolved from direct observations with high angular resolution and dynamic range, which can be used to choose interferometric calibrators. To this purpose, we have used a large number of lunar occultations recorded with the ISAAC instrument at the VLT to select sources found to be unresolved and without close companions. An algorithm has been used to determine the limiting angular resolution achieved for each source, taking into account a noise model built from occulted and unocculted portions of the light curves. We have obtained upper limits on the angular sizes of 556 sources, with magnitudes ranging from K4 to 10, with a median of 7.2 mag. The upper limits on possible undetected companions (within ) range from K8 to 13, with a median of 11.5 mag. One-third of the sources have angular sizes , and two-thirds milliarcseconds. This list of unresolved sources matches well the capabilities of current large interferometric facilities. We also provide available cross-identifications, magnitudes, spectral types, and other auxiliary information. A fraction of the sources are found to be potentially variable. The list covers parts of the Galactic Bulge and in particular the vicinity of the Galactic Center, where extinction is very significant and traditional lists of calibrators are often insufficient.
1 Introduction
Lunar occultations (LO) can efficiently yield high angular resolution with short observations using relatively simple instrumentation. As such, they have been widely employed to measure stellar angular diameters and detect small-separation binary sources, providing the bulk of such information for several decades. The catalog (Richichi et al., 2005) listed several hundreds of LO results. However, the introduction of large format detectors in the visual and near-IR has eroded the opportunities at most telescopes for fast time resolution as required by LO. At the same time long baseline interferometetry (LBI) has progressively filled the requests for the same kind of fundamental observations, without the LO limitations on the choice of the sources.
LO have recently been re-introduced as a productive method to obtain high angular resolution measurements that may not be collected efficiently in any other way. By using fast integrations on subwindows of array detectors in the near-IR, LO have been observed for several hundreds of sources at the ESO Very Large Telescope (VLT) using a minimal amount of telescope time (e.g. Richichi et al., 2012, and references therein). LO targets are selected randomly according to the lunar apparent orbit, and naturally the majority of them turn out to be unresolved. Nevertheless, these unresolved sources are also of interest, in particular for what concerns interferometry. Indeed, the angular resolution achieved in these recent LO observations at the VLT is of order 1 milliarcsecond (mas) and thus comparable to the typical LBI resolution on a large interferometer, while the sensitivity is typically several magnitudes better (K mag).
Therefore, sources which are found to be unresolved by LO are well suited to be used as calibrators by near-IR LBI. Considering that in our experience about 10% of the randomly-selected LO sources turn out to be resolved or binary, and that so-called ”bad” LBI calibrators are a concern (Hummel, 2008), such a selection of clean calibrators is indeed desirable. In this work, we list 556 sources found to be unresolved from our LO observations at the VLT, and thus highly homogeneous in terms of data and analysis. For each, we provide an upper limit on the angular size as well as a sensitivity limit on the possible presence of undetected companions. The sources are mainly located in the Galactic Bulge, with several in the vicinity of the Galactic Center where visual extinction can be extreme and therefore it might be more difficult to identify suitable LBI calibrators.
2 Observations and data analysis
The observations which form the basis of this work were obtained using the ISAAC instrument (Moorwood et al., 1998) at the ESO VLT. The instrument was installed at the 8.2-m UT1 Antu telescope until May 2009, and thereafter at the twin UT3 Melipal telescope. The majority of the observations were carried out in service mode following a filler strategy to utilize small amounts of time available between other programs or due to unfavorable atmospheric conditions (e.g., Richichi et al., 2010). A significant amount of observations was also carried out in visitor mode (e.g., Richichi et al., 2011).
Each observation consisted of several thousands of frames in a small sub-window with short sampling (also equal to integration) times. Typical values were 7000 frames of 32x32-pixel () at 3.2 ms, although different combinations exist across our data set. A broad-band Ks filter was generally employed, except in the case of very bright sources for which a narrow-band filter centered at 2.07 m was used. The events were generally disappearances, although a number of reappearances were also observed. As expected from the nature of the data set, the observing conditions covered a very wide range, with median values of seeing, airmass, lunar phase being , 1.30 and 63%, respectively. The final quality of the light curves is only marginally affected by atmospheric conditions, however other important factors are the image quality (LO at the VLT are observed with the primary mirror active optics off) and the intensity of the lunar background. These can vary significantly from one LO event to another and may be responsible for a large scatter in signal-to-noise ratio (SNR) among light curves of sources with similar magnitude.
The data cubes were converted to light curves using a mask extraction, and these in turn were analyzed using both a model-dependent (Richichi et al., 1996) and a model-independent method (CAL, Richichi, 1989). Details on the instrumentation and the method can be found in Richichi et al. (2011) and references therein. Large samples of LO data inevitably include occasional cases of light curves with slightly distorted diffraction patterns, most likely as a result of irregularities in the lunar limb. This appears to be statistically more frequent in observations with a large telescope which samples a wider section of the limb and which also provides an increased sensitivity. Richichi et al. (2012) discussed the nature and the effect of such irregularities, and suggested correction algorithms that we employed for some light curves in our sample.
An important aspect of our data reduction was the systematic assessment of the limiting angular resolution achieved for each of the light curves. This was based on an algorithm which evaluates the quality of the fit over a range of angular diameters, taking into account also factors such as the finite number of data points and their intrinsic numerical accuracy. Details are provided in Richichi et al. (1996). This quantity, which we denote with , can be considered equivalent to an upper limit on the angular size of the source. In Fig. 1 we show an example of the data and best fit by a point-source for the case of a high SNR light curve, while Fig. 2 provides a similar exmaple for a low SNR case.


For each light curve, we combine the SNR and the K magnitude to derive the detection limit Klim for a hypothetical companion. In a LO event the noise level might not be symmetric around the time of occultation. Also, depending on the circumstances and geometry, detections of companions below the SNR=1 level can be possible. Therefore, the Klim quantity is not a strict limit but rather an indication. We note that only restricted portions of the light curves, corresponding to angular extensions of , were analyzed. For our scopes, the definition of unresolved source is only meaningful within this restricted range. Companions further away than this limit have been noticed in some cases or might have been present without being detected, however we do not concern ourselves with them.
3 Source selection
A total of 915 successful LO events were logged in our database from March 2006 until June 2012. A significant fraction of these observations yielded positive results in areas of binary stars, stellar diameters, and sources with extended circumstellar emission are described in other papers already published or in preparation. Here, we concern ourselves only with the sources effectively found to be unresolved. Several tens of sources already found to be resolved or binary during our observations at the VLT have already been published (e.g. Richichi et al., 2012, and references therein).
The first step in their selection was the rejection of all light curves showing binary or multiple stars, within the angular range mentioned in Sect. 2. This included borderline cases in which the CAL algorithm revealed a secondary peak in the brightness profile, generally close to the noise level, but for which no significant improvement in the quality of the fit could be reached with a double-star model. We then rejected all stars with a resolved angular diameter or an otherwise extended apperance, including those for which the algorithm yielded an indication of being resolved even though no diameter could be fitted. We also rejected light curves with significant distortions of the fringe pattern due to presumed limb irregularities, e.g., exceeding by several times the noise level over several fringes. However, moderate distortions were generally satisfactorily treated with the algorithms of Richichi et al. (2012) and the corresponding light curves were retained. Finally, a minimum SNR of 10 was imposed.
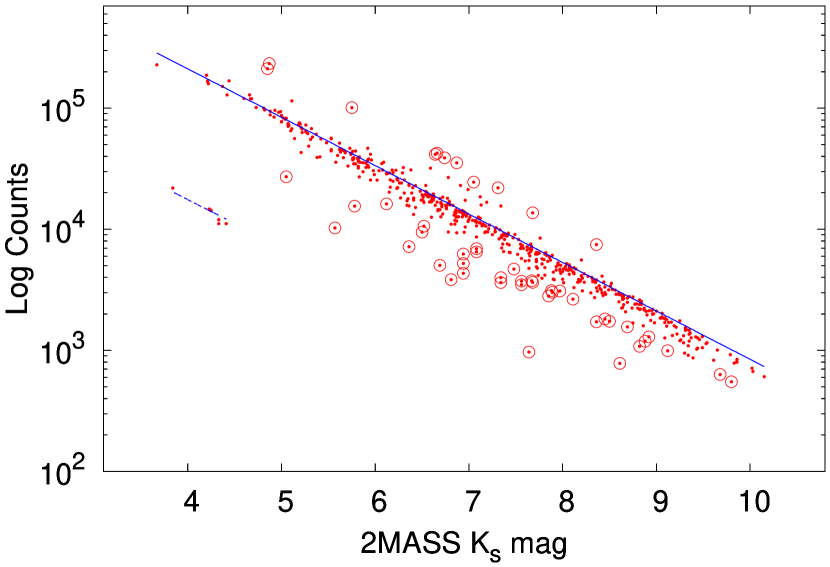
As a result, a total of 556 sources were selected and are listed in Table 1, available online. We used the 2MASS Catalogue for our predictions, and further identifications are extracted from the Simbad database. We also provide our own ID number that combines the ESO Period number with the entry in our database. This ID also marks with an asterisk sources observed with a narrow band filter. Further we list coordinates, BVJHK photometry, spectrum, number of references and source type, as available from Simbad. The next fields in the Table are the SNR, Klim and as described in Sect. 2 and computed by us. Finally, we flag sources known or likely to be variable. By the flag S we denote sources which belong to categories such as Miras, emission-line stars, RR Lyr or other kind of variables. By the flag F we denote stars for which our measured counts differed from the counts expected on the basis of the 2MASS Ks value by more than 0.6 mag (see also Fig. 8).
4 Discussion
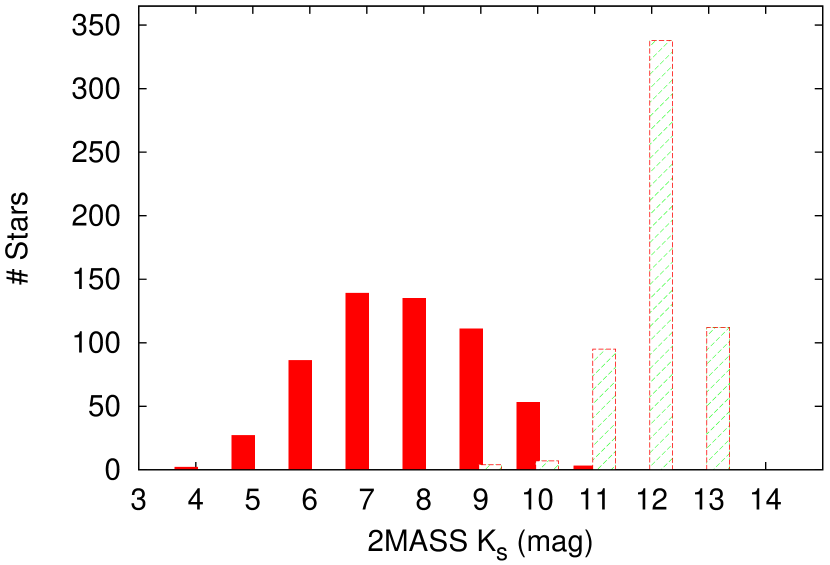
The distribution in magnitude for the sources in our list is shown in Fig. 3. We used the nominal Ks values from 2MASS, although our measurements have shown at times significantly different values as discussed later. They range from Ks=3.7 to 10.2, with a median of 7.2 mag. The figure also shows the distribution of the limiting magnitudes Klim as introduced in Sect 2. The values range from Ks=8.2 to 12.8, with a median of 11.5 mag.
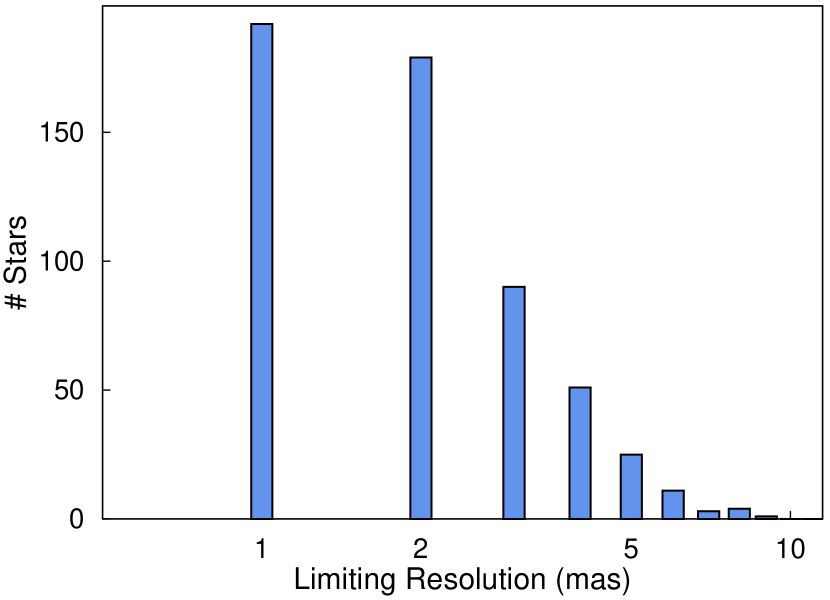
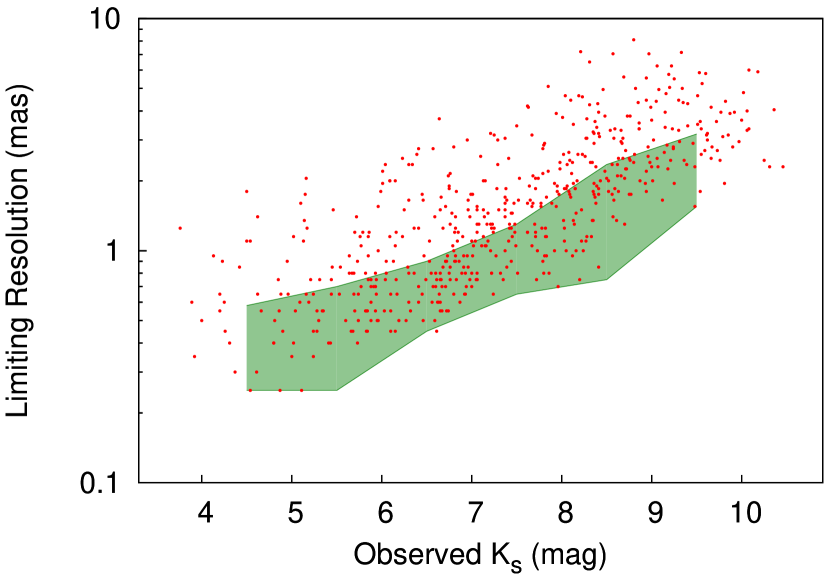
The distribution of the upper limits on the angular sizes is shown in Fig. 4. The values range from 0.25 to 8.1 mas, with a median of 1.4 mas. A total of 192 sources, or about one third of the sample, have a limiting angular resolution of 1.0 mas. The mas limit is satisfied for 371 sources. Fig. 5 shows another view of the distribution, this time as a function of the Ks magnitude. For this, we converted the measured counts into an observed Ks magnitude, using the ISAAC exposure time calculator (see also Fig. 8). The shaded area in Fig. 5 covers the range between the minimum and the median values over one-magnitude bins. The scatter in is a reflection of different SNR encountered for a same source brightness depending on observing conditions, as mentioned in Sect. 2. However, when just the best 50% of the sources are considered in each magnitude bin, the LO performance appears to be quite consistent and shows that the 1 mas limit is attained up to K mag.
It is interesting to compare our upper limits with the predicted angular diameters. Several empirical relations have been derived, to estimate a star’s diameter from its colors. A recent one by Kervella et al. (2004) is based on V and K photometry and can be applied to dwarf stars in the spectral range A0 to M2, and sub-dwarf stars between A0 and K0. Unfortunately, we face the complication that several of our stars suffer from considerable reddening, have little spectral information, and in some cases appear to be variable - as explained in the following. Nevertheless, we have endeavoured to determine the estimated diameter for a subset of 90 stars within the above constraints of photometry and spectral class, without taking into consideration possible interstellar reddening. The result is that in all cases the is larger than, or at the most approximately similar to, the estimated diameter. Only in one case we found some discrepancy (our upper limit being about 25% larger than the estimated diameter). This is IRAS 14434-2055, a source with over 4 magnitudes of V-K color, which is likely not intrinsically photosperic. We conclude that, as far as it is possible to check, our upper limits are well consistent with the expected stellar diameters.
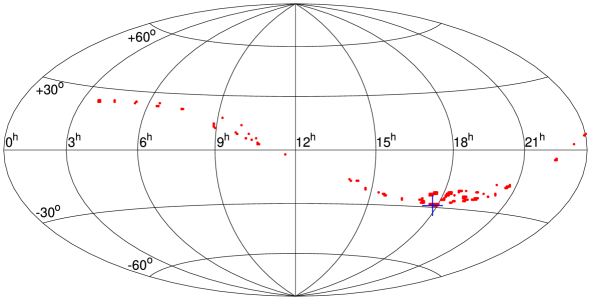
The majority of the sources have no known counterpart, with just under 50% having any identification other than the 2MASS name. About 30% have at least one bibliographical entry, and only 13% have at least two. Spectral types are known for only 15% of the sources, and V magnitudes for only one out of three. This is a reflection of many of the sources being in the Galactic Bulge, see Fig. 6, where interstellar extinction is significant or even extreme.
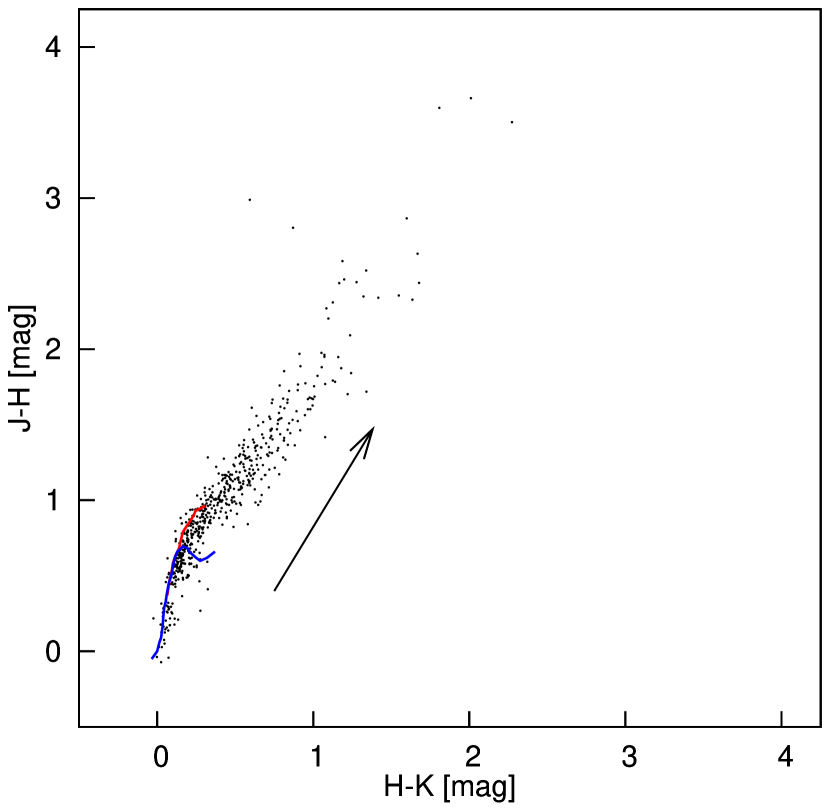
As a result, the sources in our list are also mainly red or very red in color, as shown in Fig. 7. While generally consistent with a giant sequence, the near-IR colors show that many of the sources are affected by 10 or even 20 magnitudes of visual extinction.
In fact, we note that 10 sources are within 1 of the Galactic Center, and 45 are within 5. This highlights a potential use of our list, namely to provide reference stars for LBI near-IR observations in a very interesting area of the sky, for which calibrators selected by other methods such as the modelling of the spectral energy distribution (Cohen et al., 1999) are very hard to find.
Fig. 8 shows the average unocculted counts within our extraction masks for all sources, as a function of the nominal 2MASS Ks magnitudes. It can be observed that in general the counts follow very closely the theoretical ISAAC performance. However, in a significant number of cases deviations are observed both in the sense of the observations showing brighter or fainter magnitudes than 2MASS. Small variations can be attributed to airmass (which we did not account for), atmospheric conditions and to the mask extraction process. However, larger deviations are likely indicative of intrinsic variability. In Fig. 8 we have used 0.6 mag as a threshold, leading to about 9% of the sources appearing to have varied their brightness since the 2MASS measurement.
The problem of finding suitable calibrator stars in LBI has been long-standing. Cohen et al. (1999) produced an extensive compilation of predicted angular diameters, based on modelling of the spectrophotometric properties of bright non-variable stars. This has often been used as a source of calibrators, and variations more suitable for the specific application of near-IR LBI have also been produced (e.g., Mérand et al., 2006). More recently, as extensive databases of observations have become available from facilities such as the Palomar Testbed Interferometer and the ESO Very Large Telescope Interferometer, attempts have been made to derive self-consistent systems of calibrators with measured, as opposed to predicted, diameters (van Belle et al., 2008; Richichi et al., 2009).
While the choice of suitable calibrators is largely eased by the above mentioned works, a few limitations are still encountered: for example, the density of calibrators is less than satisfactory in some areas of the sky, and they are usually limited to rather bright stars, typically K mag. Tools for selecting fainter calibrators are available Bonneau et al. (2011); however they are again based on indirect methods and they may require interpolations for missing photometry. The quoted photometric accuracy of 0.1 mag is generally acceptable to estimate angular diameters, and large relative errors are not a problem in the faint magnitude (small size) regime. However, such accuracy does not allow us to ascertain in advance, for example, whether a specific source has a faint companion. On the other hand, experience from our LO observations has shown that, with a resolution of mas and a dynamic range of K mag, about 10% of the field stars appear to have companions.
Interferometric observations are generally quite time-consuming both in acquisition and analysis of the data, and it is often only after the observing run has been concluded that problems connected with a calibrator, such as a previously unknown companion, can be recognized. In this sense, our list of unresolved sources can prove useful. Admittedly, we provide only upper limits rather than angular diameters, however for baselines which are not too long this can be sufficient. For example, on a 50 m baseline in K band, the difference in squared visibility between a 1 mas and a point-like source is 3%, comparable to the typical accuracy of an interferometric measurement. Of course, LBI observations repeated on different baselines can detect deviations in the point-like nature of a source with better accuracy. The case of an unknown faint companion, however, might be harder to recognize.
5 Conclusions
We have used a database of about 900 near-IR lunar occultation light curves obtained with the ISAAC instrument at the VLT, to identify a set of sources that can be classified as unresolved. This set comprises 556 stars spanning a range of magnitudes from K4 to 10, which have been analyzed in a highly homogeneous context in terms of instrument performance and data analysis. We are able to set upper limits on their angular sizes, typically of 1 to 2 milliarcseconds, and on the presence of nearby companions, with an average dynamic range of 4.5 mag, reaching a typical limiting magnitude K11 to 12. The sources are distributed along the Zodiacal belt, and especially clustered in the Galactic Bulge. They exhibit mostly red or very red colors due to interstellar extinction. A significant number are in close proximity to the Galactic Center. As a result, only a small fraction of the sources in our list are well studied, with the majority lacking extensive classification and bibliographical references.
We identify a key application of this list as a database of calibrators for long-baseline interferometry, especially in the faint source regime of modern large facilities and for targets in the general direction of the Galactic Center where other sources of reliable calibrators are scarce.
References
- Bessell & Brett (1988) Bessell, M. S., & Brett, J. M. 1988, PASP, 100, 1134
- Bonneau et al. (2011) Bonneau, D., Delfosse, X., Mourard, D., et al. 2011, A&A, 535, A53
- Cohen et al. (1999) Cohen, M., Walker, R. G., Carter, B., et al. 1999, AJ, 117, 1864
- Hummel (2008) Hummel, C. A. 2008, Proc. SPIE, 7013, 70134G
- Kervella et al. (2004) Kervella, P., Thévenin, F., Di Folco, E., & Ségransan, D. 2004, A&A, 426, 297
- Mérand et al. (2006) Mérand, A., Bordé, P., & Coudé du Foresto, V. 2006, A&A, 447, 783
- Moorwood et al. (1998) Moorwood, A., Cuby, J.-G., Biereichel, P., et al. 1998, The Messenger, 94, 7
- Richichi (1989) Richichi, A. 1989, A&A, 226, 366
- Richichi et al. (1996) Richichi, A., Baffa, C., Calamai, G., & Lisi, F. 1996, AJ, 112, 2786
- Richichi et al. (2005) Richichi, A., Percheron, I., & Khristoforova, M. 2005, A&A, 431, 773
- Richichi et al. (2009) Richichi, A., Percheron, I., & Davis, J. 2009, MNRAS, 399, 399
- Richichi et al. (2010) Richichi, A., Fors, O., Chen, W.-P., & Mason, E. 2010, A&A, 522, A65
- Richichi et al. (2011) Richichi, A., Chen, W. P., Fors, O., & Wang, P. F. 2011, A&A, 532, A101
- Richichi et al. (2012) Richichi, A., & Glindemann, A. 2012, A&A, 538, A56
- Richichi et al. (2012) Richichi, A., Chen, W. P., Cusano, F., et al. 2012, A&A, 541, A96
- Rieke et al. (1985) Rieke, G. H., & Lebofsky, M. J. 1985, ApJ, 288, 618
- van Belle et al. (2008) van Belle, G. T., van Belle, G., Creech-Eakman, M. J., et al. 2008, ApJS, 176, 276
| Object | Our ID | Simbad ID | (J2000) | (J2000) | B | V | J | H | K | Sp | #Ref | Type | SNR | Klim | Var | |
|---|---|---|---|---|---|---|---|---|---|---|---|---|---|---|---|---|
| 17383141-2812445 | P76/gc097 | DENIS-PJ173831.3-281244 (catalog ) | 17:38:31.4 | -28:12:44.5 | 8.88 | 7.47 | 6.78 | 1 | IR | 70.8 | 11.4 | 1.50 | ||||
| 17385533-2836105 | P76/gc137 | 2MASSJ17385533-2836105 (catalog ) | 17:38:55.3 | -28:36:10.5 | 9.96 | 8.33 | 7.34 | 1 | IR | 44.8 | 11.5 | 1.80 | ||||
| 17385407-2833227 | P76/gc147 | DENIS-PJ173854.0-283322 (catalog ) | 17:38:54.1 | -28:33:22.7 | 9.80 | 8.03 | 7.13 | 1 | IR | 47.5 | 11.3 | 1.20 | ||||
| 17394022-2820124 | P76/gc199 | 2MASSJ17394022-2820124 (catalog ) | 17:39:40.2 | -28:20:12.4 | 9.81 | 8.12 | 7.12 | 1 | IR | 84.3 | 11.9 | 3.70 | ||||
| 17394602-2822089 | P76/gc207 | 2MASSJ17394602-2822089 (catalog ) | 17:39:46.0 | -28:22:08.9 | 9.72 | 7.87 | 7.05 | 1 | IR | 92.8 | 12.0 | 2.35 | F | |||
| 17405112-2817130 | P76/gc260 | 2MASSJ17405112-2817130 (catalog ) | 17:40:51.1 | -28:17:13.0 | 19.10 | 7.07 | 5.51 | 4.87 | 1 | IR | 181.7 | 10.5 | 0.60 | F | ||
| 17411415-2818051 | P76/gc284 | 2MASSJ17411415-2818051 (catalog ) | 17:41:14.2 | -28:18:05.1 | 18.50 | 8.88 | 7.49 | 6.87 | 1 | IR | 100.4 | 11.9 | 0.75 | F | ||
| 17413435-2829225 | P76/gc352 | ISOGAL-PJ174134.6-282922 (catalog ) | 17:41:34.3 | -28:29:22.5 | 6.96 | 5.52 | 4.85 | 5 | Star,IR | 241.7 | 10.8 | 0.50 | F | |||
| 17425497-2836593 | P76/gc426 | 2MASSJ17425497-2836593 (catalog ) | 17:42:55.0 | -28:36:59.3 | 10.49 | 7.90 | 6.72 | 1 | IR | 92.8 | 11.6 | 0.80 | ||||
| 17430901-2837039 | P76/gc437 | 2MASSJ17430901-2837039 (catalog ) | 17:43:09.0 | -28:37:03.9 | 10.59 | 8.16 | 6.99 | 1 | IR | 85.7 | 11.8 | 0.75 |
Note. — Table 1 is published in its entirety in the electronic edition of the Astrophysical Journal Supplement Series. A portion is shown here for guidance regarding its form and content.