The SLUGGS Survey: Kinematics for over 2500 Globular Clusters in Twelve Early-type Galaxies
Abstract
We present a spectro-photometric survey of extragalactic globular clusters (GCs) around twelve early-type galaxies, nine of which have not been published previously. Combining space–based and multi–colour wide field ground–based imaging, with spectra from the Keck DEIMOS instrument, we obtain an average of GC radial velocities per galaxy, with a high velocity precision of per GC. After studying the photometric properties of the GC systems, such as their spatial and colour distributions, we focus on the kinematics of metal-poor (blue) and metal-rich (red) GC subpopulations to an average distance of effective radii from the galaxy centre.
Our results show that for some systems the bimodality in GC colour is also present in GC kinematics. The kinematics of the red GC subpopulations are strongly coupled with the host galaxy stellar kinematics. The blue GC subpopulations are more dominated by random motions, especially in the outer regions, and decoupled from the red GCs. Peculiar GC kinematic profiles are seen in some galaxies: the blue GCs in NGC rotate along the galaxy minor axis, whereas the GC system of the lenticular galaxy NGC appears to be strongly rotation supported in the outer region.
We supplement our galaxy sample with data from the literature and carry out a number of tests to study the kinematic differences between the two GC subpopulations. We confirm that the GC kinematics are coupled with the host galaxy properties and find that the velocity kurtosis and the slope of their velocity dispersion profiles is different between the two GC subpopulations in more massive galaxies.
keywords:
galaxies:star clusters – galaxies:evolution – galaxies: kinematics and dynamics – GCs1 Introduction
The reconstruction of the evolutionary history of galaxies in the local universe requires a comprehensive knowledge of their chemo-dynamic properties at all scales. Along these lines, the ATLAS3D project (Cappellari et al., 2011) has carried out a rich survey of galaxies employing an integral field unit (IFU) technique to map out the chemo-dynamics of galaxies within effective radius (). However, such a radius encloses % of the total galaxy mass (baryonic dark) and hence it may not be representative of the overall galaxy (e.g., Proctor et al., 2009). In contrast, beyond this radius (), the halo of the galaxy contains precious dynamical signatures of early merging or early collapse events that might have eventually built up the galaxy (Hopkins et al., 2009; Hopkins et al., 2010; Oser et al., 2010; Hoffman et al., 2010). Some recent examples of the dynamical studies of the outskirts of galaxies beyond the Local Group has mainly involved a few deep long-slit observations (e.g., Coccato et al. 2010), the pioneering technique of Proctor et al. (2009) and Norris et al. (2008) that probed the two-dimensional stellar kinematics to , and extragalactic planetary nebulae (PNe, Coccato et al. 2009) that can probe the galaxy potential up to .
Often labeled the “fossil record” of galaxy formation, GCs have been used to study galaxy haloes. GC systems have been found in galaxies of all morphological type and they extend beyond the detectable galaxy diffuse light, probing galactocentric distances where the are only few other gravitational constrains (Rhode & Zepf, 2001, 2004; Dirsch et al., 2003; Tamura et al., 2006; Forbes et al., 2011). Moreover, their old ages ( Gyr, Kissler-Patig et al., 1998; Cohen et al., 1998; Beasley et al., 2000; Forbes et al., 2001; Schroder et al., 2002; Brodie & Larsen, 2002; Beasley et al., 2004; Strader et al., 2005) suggest they have survived violent merging events, preserving the chemo-dynamical record of their parent galaxies.
Moreover, the well-studied dichotomy observed in the colour distribution of most GC systems (Zepf & Ashman, 1993; Ostrov et al., 1993; Whitmore et al., 1995; Gebhardt & Kissler-Patig, 1999; Larsen et al., 2001; Kundu & Whitmore, 2001; Peng et al., 2006; Sinnott et al., 2010) is thought to stem from different formation mechanisms that shaped the underlying host galaxy (Ashman & Zepf, 1992; Forbes et al., 1997; Côté et al., 1998). Although the reality of the GC metallicity bimodality has been recently called into question as the result of a strongly non-linear color-metallicity relation (Yoon et al., 2006; Yoon et al., 2011; Blakeslee et al., 2010), observations have shown that physical dissimilarities exist among these two subpopulations (Côté, 1999; Brodie & Strader, 2006; Peng et al., 2006; Chies-Santos et al., 2011; Forbes et al., 2011). For instance, the two GC subpopulations are found to have different physical sizes (Kundu & Whitmore, 2001; Jordán et al., 2005; Masters et al., 2010) and diverse spatial distributions around the host galaxy, with the metal-rich (red) GCs more centrally concentrated than the metal-poor (blue) GCs (Geisler et al., 1996; Ashman & Zepf, 1998; Brodie & Strader, 2006; Bassino et al., 2006; Faifer et al., 2011; Strader et al., 2011; Forbes et al., 2012).
Current spectroscopic studies of GC systems have shown that the kinematics (e.g. rotation directions and rotation amplitudes) of the two GC subpopulations are somewhat diverse. The kinematics of the red GCs is usually akin to that of the host galaxy stars (Schuberth et al., 2010; Strader et al., 2011), perhaps due to a similar formation history (Shapiro et al., 2010). Whereas, the velocity dispersion of the blue GCs is typically larger than that of the red GCs (e.g., Lee et al., 2008). Also intriguing is the fact that rotation has been detected for both the blue and the red GCs, regardless the mass or morphology of the host galaxy (Foster et al., 2011; Arnold et al., 2011).
Interpreting this variety of GC kinematics in the context of galaxy and GC formation has been limited due to the low number of galaxies with large GC radial velocity datasets. To date, this set includes only a dozen GC systems, most of which are nearby very massive ellipticals (see Lee et al. 2010, for a summary). On the other side, numerical simulations on this front have mainly focused on the origin of GC metallicity and colour bimodality (e.g., Weil & Pudritz, 2001; Kravtsov & Gnedin, 2005; Yoon et al., 2006; Yoon et al., 2011), rather than on GC kinematic properties (e.g., Bekki et al., 2005, 2008; Prieto & Gnedin, 2008).
This scenario has left open several questions regarding the kinematics of GC systems: does the colour bimodality also imply kinematic bimodality? If so, do the kinematical differences between the blue and red GC subpopulations found in the most massive ellipticals also hold for galaxies over the whole early-type sequence of the Hubble diagram? Furthermore, do the blue and red GC subpopulations rotate faster in the outer regions, as predicted in a formation in a disk-disk merging scenario (Bekki et al., 2005)? Can GC kinematics contribute to our understanding of the formation of lenticular galaxies (e.g., Barr et al., 2007)?
We have been carrying out a project named SLUGGS111http://sluggs.swin.edu.au/ to investigate the GC systems in external galaxies (Brodie et al. 2012, in preparation). SLUGGS is the SAGES Legacy Unifying Globulars and Galaxies Survey, where SAGES is the Study of the Astrophysics of Globular Clusters in Extragalactic Systems. This survey exploits the combination of Subaru/Suprime-Cam wide-field imaging with spectra from the Keck/DEIMOS multi-object spectrograph. The results released so far have shown that the wide-field imaging can give clues about assembly history of the host galaxy (Blom et al., 2011; Forbes et al., 2011). If combined with the high velocity resolution of DEIMOS, this dataset can unravel, at the same time, the dynamics and the metallicity of the field stars (Foster et al., 2009; Proctor et al., 2009) and of the GCs (Foster et al., 2011; Arnold et al., 2011) deep into the galaxy halo, as well as a giving compelling view of galaxy dynamics (Strader et al., 2011; Romanowsky et al., 2009; Romanowsky et al., 2011).
In this work, we aim to study the GC kinematics for an unprecedented large sample of early-type galaxies (ETGs) with high-quality data. We investigate the global kinematics of blue and red subpopulations to study how they, and the underlying galaxy itself, formed. We also supplement our galaxy sample with literature data, and we compare the properties of this large sample with the existing numerical predictions.
The plan of this paper is as follows. From Section 1 to Section 5 we describe the reduction and the analysis of both the photometric and the spectroscopic data. In Section 5, we briefly discuss the significant findings for each galaxy. In Section 6, we give an overview on the current state of the GC formation models in order to compare their predictions to our generic results discussed in Section 7. In Section 8 we supplement our galaxy sample with data from the literature. In Section 9 we analyse the enlarged GC system dataset (our data plus literature) and discuss the results in Section 10. The summary of the paper is given in Section 11.
2 The sample
In this paper we discuss a subset sample from our survey. This includes nine new galaxies, in addition to other three galaxies already published: NGC (Foster et al., 2011), NGC (Arnold et al., 2011) and NGC (Strader et al., 2011). The analysis and the specific results for these three galaxies have been extensively discussed in the respective papers. Therefore, their overall results will be discussed together with the other nine starting from Section 7.
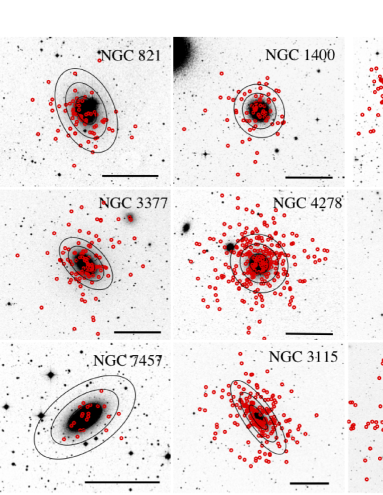
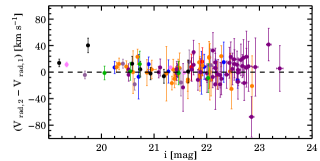
The physical characteristics of the twelve galaxies are listed in Table 1, with their optical images shown in Figure 1. This galaxy sample extends the study of extragalactic GC systems into a new regime, because it is representative of a wide range of luminosity, morphological type (from lenticulars to giant ellipticals) and environment (from field to clusters), with a velocity resolution three times better than typical previous studies. This improvement is shown in Figure 2 in which we compare the intrinsic properties of our dataset with previous GC studies (that have employed various instruments including VLT/FLAMES, VLT/FORS2, Keck/LRIS or Gemini/GMOS).
| Galaxy ID | Hubble | ( | |||||||
| Type | [km s-1] | [arcsec] | [mag] | [Mpc] | [mag] | [mag] | [degree] | ||
| (1) | (2) | (3) | (4) | (5) | (6) | (7) | (8) | (9) | (10) |
| NGC | E | ||||||||
| NGC | SA | ||||||||
| NGC | E | ||||||||
| NGC | E | ||||||||
| NGC | E | ||||||||
| NGC | E | ||||||||
| NGC | E | ||||||||
| NGC | E | ||||||||
| NGC | S | ||||||||
| NGC | S | ||||||||
| NGC | E | ||||||||
| NGC | E |
3 Photometric observations and data analysis
3.1 Subaru data

Multi-band photometric observations were carried out using the Subaru/Suprime-Cam instrument with a field of view of arcmin2 and a pixel scale of arcsec (Miyazaki et al., 2002). The galaxy sample was observed in the period between 2005 and 2010 with a standard Sloan Digital Sky Survey (SDSS) filter set. NGC and NGC were both downloaded from the SMOKA archive (Baba et al., 2002) and were observed with a and filter set, respectively. For NGC and NGC we present existing Suprime-Cam photometry published in Spitler et al. (2012) (see also Romanowsky et al. 2009) and Blom et al. (2011), respectively. For these two galaxies both the imaging reduction and the catalogue extraction were performed with the methodology described in this paper. NGC is the only galaxy for which no Subaru imaging is available, and therefore we use WIYN/Minimosaic imaging in filters presented in Hargis et al. (2011) and we refer to this paper for a description of the data reduction.
In Table 2 the imaging observations are summarized. The overall seeing conditions were mainly sub-arcsec. For NGC ( band), NGC ( band) and NGC ( band) the data suffer from cloudy conditions and poor ( arcsec) seeing.
Subaru raw images were processed using the SDFRED data pipeline (Ouchi et al., 2004) that yields standard flat field corrected images for each of the three filters. Photometric point source catalogues were extracted using standard IRAF/Daophot aperture photometry routines. We summarise here the main steps of the data reduction and we refer to Section 3 of Blom et al. (2011) for a detailed description of the method.
We obtain a raw list of object positions by running IRAF/Daofind on galaxy subtracted images in order to optimise the finding algorithm. The extraction threshold was typically set between and times the background depending on the filter and on the seeing conditions. The galaxy light was modelled with IRAF/Ellipse set to allow the position angle and ellipticity to vary. Next, we perform aperture photometry using IRAF/Phot on the preselected objects for a certain number of circular apertures from up to pixels (equivalent to arcsec to arcsec for the Suprime-Cam pixel scale). The extraction radius was chosen in order to maximise the signal of the source and minimise the sky contribution. The extracted magnitude was corrected for the computed aperture correction using IRAF/Mkapfile. Photometric zeropoints were estimated by boot-strapping the Suprime-Cam photometry to the Sloan Digital Sky Survey (SDSS) DR7 photometric system (Abazajian et al., 2009) using the brightest objects in common between the two datasets (typically with ). If not in SDSS. the zeropoints were calibrated using the flux from standard stars observed over the same night. Finally, we use the reddening given in Table 1 and the conversion table of Schlegel et al. (1998) to derive the Galactic extinction correction in our photometric bands. Hereafter, all magnitudes and colours are extinction corrected.
3.2 HST data
We use Hubble Space Telescope (HST) archive images from the Advanced Camera for Surveys (ACS) and Wide Field Planetary Camera 2 (WFPC2) to improve the quality of the photometric selection in the central regions of our galaxies. For most of them, we exploit existing photometric GC catalogues and we refer to the following authors for a detailed description of the data reduction and analysis: Spitler et al. (2008) for NGC , Forbes et al. (2006) for NGC and NGC , Forbes et al. (1996) for NGC , Chomiuk et al. (2008) for NGC and Blom et al. (2011) for NGC .
We obtained, from the Hubble Legacy Archive, new HST/ACS imaging for NGC , NGC and NGC , respectively. The ACS camera has a pixel scale of arcsec and a field of view of arcmin2.
The NGC imaging consists of one pointing in F475W ( Sloan ) and F850LP ( Sloan ) filters and it was observed as part of the HST project ID 10554. NGC (ID 9353) was imaged in F435W, F555W, F814W filters, equivalent to a configuration, respectively. Finally, the NGC (ID 10835) data consists of four pointings in F475W and F850LP filters that probe the galaxy up to arcmin from the centre (Usher et al. 2012, in preparation).
The HST imaging was reduced and analysed using a custom built pipeline to find point-like sources and measure their magnitudes and half light radii. For details on the methods used by the pipeline including point spread function determination, we refer to Strader et al. (2006) and to Spitler et al. (2006). The extracted magnitudes and sizes for GCs in NGC and NGC were compared with those published by Chies-Santos et al. (2011) for objects in the NGC pointing and in the two NGC pointings. Both magnitudes and sizes show good agreement without any evidence of statistically significant offset from the published data.
3.3 Photometric GC selection
Once the point-source catalogues have been constructed, they are photometrically selected to avoid contamination, such as unresolved galaxies and Galactic stars. As far as our new Subaru data are concerned, this process involves the following steps: 1. selection in a colour-colour space; 2. selection in a colour-magnitude space; 3. a visual check. The GC selection in the ground-based imaging for NGC was carried out in Hargis et al. (2011) and we refer to this paper for a detailed description of their selection method. The steps listed above are subjected to variations in the procedures for the DEIMOS mask design.
| Galaxy ID | Obs date | Filters | Exp. time | Seeing |
|---|---|---|---|---|
| [sec] | [arcsec] | |||
| NGC | 2008 Nov. | |||
| NGC | 2008 Nov. | |||
| NGC | 2008 Nov. | |||
| NGC | 2005 Mar. | |||
| NGC | 2008 Nov. | |||
| NGC | 2002 Feb. | |||
| NGC | 2008 Apr. | |||
| NGC | 2009 Apr. | |||
| NGC | 2009 Oct. |
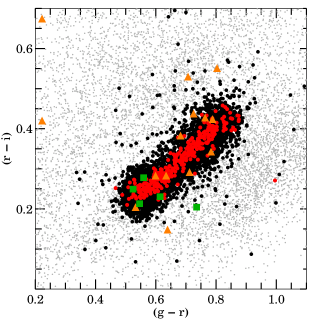
GCs are known to populate a specific area of colour-colour diagrams (e.g., Rhode & Zepf, 2001; Faifer et al., 2011; Chies-Santos et al., 2011). With a filter set, this is enclosed within , , where these boundaries run diagonally to the colour axes, as shown in Figure 3 for the galaxy NGC . To take into account the dependence of the colour boundaries on the quality of the data, we flag as GC candidates all the objects deviating by less than 2 from these boundaries (Spitler et al., 2008).
Next, we apply a cut on the band magnitude ( band for NGC ). Given the ongoing debate regarding the uncertain separation between GCs and ultra compact dwarfs (UCDs, Mieske et al., 2006; Brodie et al., 2011), we decided to set the upper brightness magnitude at (), one magnitude brighter than the integrated magnitude of Cen, the brightest GC in the Milky Way. Nevertheless, in some cases we relax this criterion in order to include spectroscopically confirmed GCs that have magnitudes brighter than the set threshold. The separation between NGC and NGC objects will be discussed in Section 5.
Next, we calculate the radius at which the number of GC candidates per unit area flattens out (see §3.5 for the method), that is an estimate of the radius at which the contribution of the contaminants (Glactic stars and high redshift galaxies) becomes dominant. Therefore, we count out of the GC selection all the objects outside this background radius. We have tested that the effect of the contaminants on the GC colour distribution is minimal mag and that it does not affect considerably the GC colour bimodality (see also, Arnold et al., 2011).
Finally, we perform a visual check to make sure that no outliers, such as extended sources or image artefacts, contaminate the final GC catalogue. Most of the outliers turned out to be close to the galaxy (within arcmin) where the galaxy light contamination and the crowded field makes the Subaru photometry unreliable. Within this radius, the contribution of the HST imaging becomes crucial.
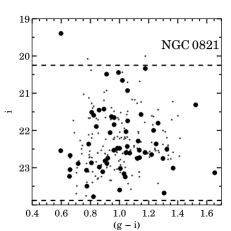
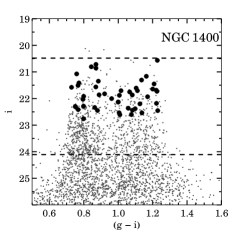
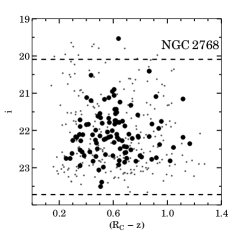
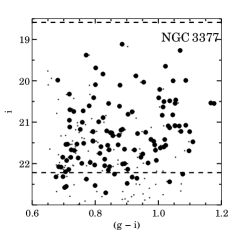
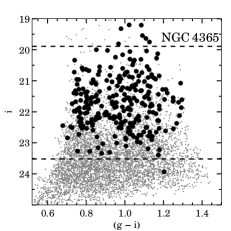
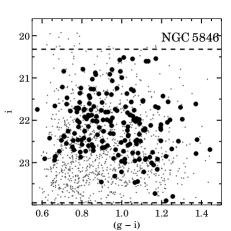
As far as the HST/ACS imaging is concerned, it is worth noting that the diffraction limited quality of HST imaging has the advantage of making extragalactic GCs partially resolved for all of our galaxies. Therefore, the GC selection in our space-based imaging is also based on a size selection in addition to magnitude and colour-colour criteria (if available). In NGC and NGC , for which only and imaging are available, we flag as GC candidates all the objects with colour and sizes pc. Such a choice is motivated by the clear drop off in the density of the objects outside the adopted colour cut, as observed in Blom et al. (2011). For NGC , we adopt the same size-cut as above and select objects within and and an upper magnitude of . In Figure 4, the colour-magnitude diagrams of the GC candidates and of the spectroscopically confirmed GCs are shown.


3.4 GC colour bimodality
To probe bimodality, we use a Kaye’s Mixture Model algorithm (KMM, Ashman et al. 1994) that returns colour peaks, variance and number of objects in the detected subpopulations. KMM was run on all the distributions of the Subaru GC candidates brighter than the turnover magnitude . In this paper we adopt , derived using the transformation from Faifer et al. (2011) to calibrate the band TOM given by Kundu & Whitmore (2001) into our photometric system.
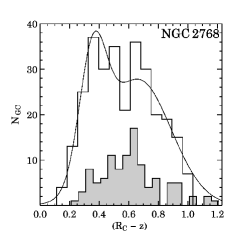
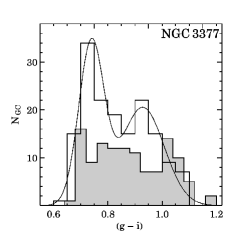
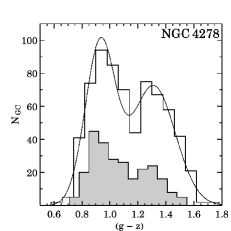
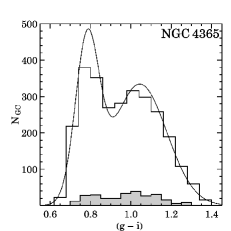
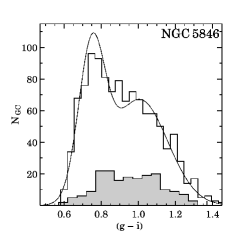
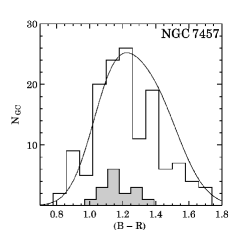
For NGC , NGC and NGC , we study the , and colour distributions respectively. We perform a bisector fit (Feigelson & Babu, 1992) to the bright GCs in common between the HST and Subaru images, in order to convert HST magnitudes of the spectroscopically confirmed GCs into the respective Subaru photometric system. For NGC , given the wide spatial coverage and better quality of its HST data, we transform Subaru magnitudes of the confirmed GCs into the HST photometric system. Results of the KMM analysis are presented in Table 3. We find that eight out of nine galaxies show significant GC colour bimodality. GCs are divided into blue and red according to the local minimum of the best fit Gaussians in Figure 5.
| Galaxy ID | p-value | colour | ||||
|---|---|---|---|---|---|---|
| NGC | ||||||
| NGC | ||||||
| NGC | ||||||
| NGC | ||||||
| NGC | ||||||
| NGC | ||||||
| NGC | ||||||
| NGC | ||||||
| NGC |
3.5 GC spatial distribution
We construct projected surface density profiles for the GC subpopulations of our galaxy sample. GC candidates brighter than the turnover magnitude were binned in circular annuli and corrected for areal incompleteness. The Subaru dataset was supplemented with HST photometry, in order to probe the GC surface density in the inner regions. An important caveat to bear in mind is that we do not correct the Subaru dataset for magnitude incompleteness. This effect becomes important especially for objects fainter than in the innermost regions ( arcmin) where the detection of sources is inhibited by the surface brightness contribution of the host galaxy (Faifer et al., 2011). Conversely, the completeness of the HST photometry in band is typically above per cent at the turnover magnitude even in the innermost regions, respectively (Larsen et al., 2001; Jordán et al., 2007). Therefore, we select all the GCs brighter than the turnover magnitude (see Figure 4) and we use circular radial bins in common between HST and Subaru to correct and adjust the Subaru GC surface density to that of the HST data. Although the matching between HST and Subaru data points is arbitrary, this approach preserves the relative slopes of the spatial distribution of the two subpopulations and allows us to verify whether or not blue and red GC subpopulations show different spatial distributions around the host galaxy as found from previous authors (e.g., Bassino et al., 2006).

Next, we fit the resulting (HST Subaru) GC density profile with a Sérsic law (Sérsic, 1963) similar to that commonly carried out for galaxy surface brightness profiles, but in practice we fit a variation of the Sérsic profile from Graham et al. (2005) in order to quantify the background level:
| (1) |
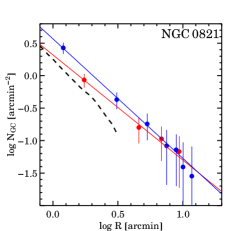
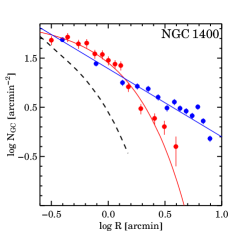
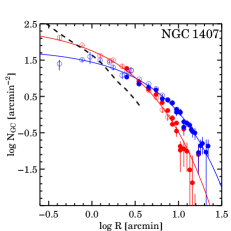
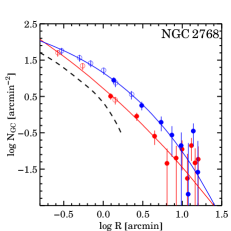
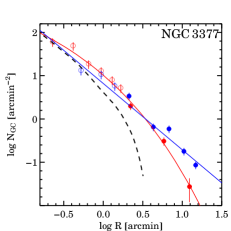
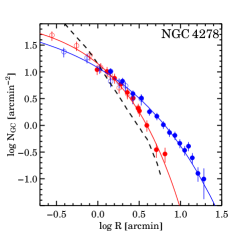
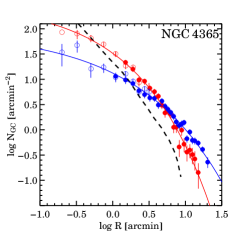
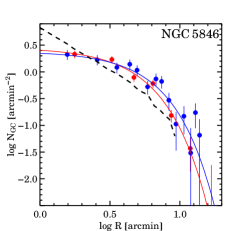
where , is the Sérsic index, is the effective radius of the GC system, is the surface density at that radius and is the background contamination level. In case a Sérsic fit was not feasible due to small numbers we fit a power-law, i.e. that has been also used for similar analyses (Spitler et al., 2008). In Figure 6 the background subtracted GC surface density profiles for our galaxies are shown. As found in other galaxies, the red GCs are more centrally concentrated than the blue GCs (e.g., Geisler et al., 1996; Bassino et al., 2006; Faifer et al., 2011; Strader et al., 2011).
We also compare the GC surface density to the galaxy surface brightness for each galaxy, obtained from the Subaru images using IRAF/Ellipse as described in §3.2. The surface brightness profiles were corrected for the local galaxy ellipticity and then shifted by an arbitrary constant for comparison purposes (different for each galaxy). Figure 6 shows that, qualitatively, the slope of the red GC subpopulation agrees with that of the surface brightness of the host galaxy.
4 Spectroscopic observations and data analysis
Spectroscopic observations were performed with the DEep Imaging Multi-Object Spectrograph (DEIMOS, Faber et al. 2003) mounted on the 10 m Keck-II telescope. Galaxies were targeted in the period between 2006 and 2011, employing a different number of masks for each galaxy depending on the richness of the GC system. Objects selected for spectroscopic follower were chosen according to their likelihood of being GCs, i.e. giving priority to the objects selected with methods as Section 3.3. The spectroscopic observations are summarized in Table 4.
The large collecting area of the 10-meter Keck primary mirror combined with the arcmin2 of DEIMOS is the ideal combination to investigate the outskirts of galaxies where GCs are expected to be one of the best tracers of the total galaxy potential. For all the galaxies, DEIMOS was set up with the 1200 l/m grating centred on Å together with arcsec wide slits, allowing coverage of the region between – Å with a resolution of Å. Raw spectra were reduced using the DEIMOS/spec2d reduction pipeline provided online, that produces calibrated and sky subtracted spectra for each slit (Newman et al., 2012; Cooper et al., 2012).
We estimate the radial velocity of the GCs by measuring the Doppler shift of Calcium Triplet (CaT) absorption lines that characterises the infrared part of their spectra at 8498 Å, 8542 Å, 8662 Å, respectively. We measure radial velocities with IRAF/Fxcor that performs a cross-correlation between the Fourier transformed science spectrum and template Galactic star Fourier transformed spectra. The template spectra were observed with the same DEIMOS setup used for scientific spectra and they cover a wide range of spectral type, luminosity and metallicity (from F to M type). Fxcor was configured to have all the science and template spectra in the same wavelength range from to Å with the same DEIMOS spectral resolution. The radial velocity for each object was estimated as the mean of the radial velocity resulting from the correlation with each template star. The respective errors were evaluated by adding in quadrature the default error given by fxcor as described in Tonry & Davis (1979) to the standard deviation among the stellar templates, which is an estimate of the systematics.
| Galaxy ID | Masks | Exp. time | NGCs | Nstars | Ngal |
|---|---|---|---|---|---|
| [hr] | |||||
| NGC | |||||
| NGC | |||||
| NGC | |||||
| NGC | |||||
| NGC | |||||
| NGC | |||||
| NGC | |||||
| NGC | |||||
| NGC | |||||
| NGC | 0 | ||||
| NGC | |||||
| NGC |
4.1 Kinematic selection criteria
Once the final radial velocities of the GC candidates are obtained, we redshift-correct the spectra and perform a visual check to verify that the CaT lines are real and that they lie at the expected rest wavelength. Our selection criteria require the presence of at least two “visible” CaT lines (typically the brightest Å and Å lines) and of the H absorption line at Å, if probed in the redshift corrected spectra. The visual analysis is performed by at least two members of the team and it produces a final spectroscopic consensus catalogue. Spectra that show a radial velocity consistent with a GC, but for which it was not possible to reach a consensus, were flagged as “marginal” and are not included in the kinematic analysis. These objects have usually low signal-to-noise spectra or suffer from bad sky-line subtraction making the line identification subjective.
Besides background galaxies that can be usually spotted by the emission lines in their spectra, the main outliers of our spectroscopic selection are Galactic stars because they show a stellar spectrum with radial velocity km s-1. In most cases GCs and Galactic stars are well-separated in velocity, but for galaxies with Galactic stars might introduce a low velocity tail in the observed GC candidate velocity distribution. We decided to use a friendless algorithm introduced in Merrett et al. (2003) that flags objects deviating by more than from the velocity distribution of their nearest neighbours. We use and (depending on the galaxy) to exclude both stars and possible outliers that lie outside the envelope from the kinematic analysis.
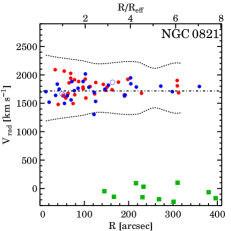
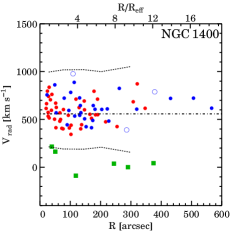
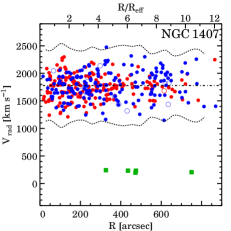
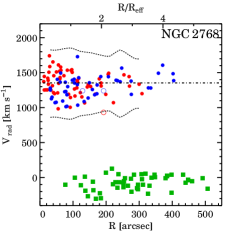
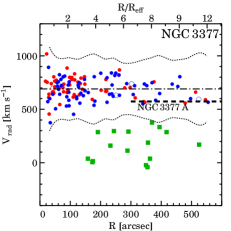
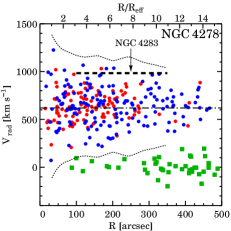
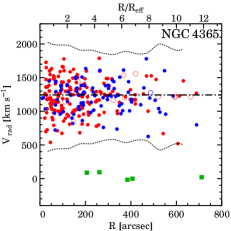
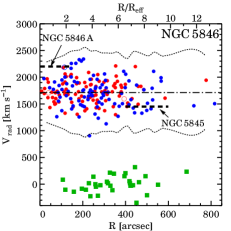
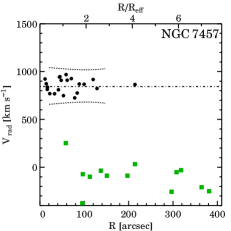
In Figure 7 we show the distribution of all the spectroscopically confirmed GCs and Galactic stars in a radius-velocity phase space. In this plot and hereafter, galactocentric distances are expressed as a equivalent radius, that is defined as:
| (2) |
where is the axis ratio defined as the ratio of minor over the major axis of the galaxy (see Table 1), and are Cartesian coordinates of an object in the galaxy rest frame, with the origin at the galaxy centre, and with and aligned along the photometric major axis and minor axis respectively. The final spectro-photometric catalogues of our galaxy sample are available on-line and they include spectroscopically confirmed GCs, “marginal” GCs, Galactic stars and galaxies.


4.2 Repeated GC measurements
We searched through the literature for GCs observed in our surveyed galaxies, finding existing datasets for three galaxies. In summary, we have re-observed: 1. 6 GCs of the 26 GCs confirmed by Puzia et al. (2004) in NGC using VLT/FORS2; 2. 7 GCs of the 13 GCs found by Chomiuk et al. (2008) in NGC using Keck/LRIS ; 3. 24 GCs of the 33 GCs resulting from the combination of the Brodie et al. (2005) and Larsen et al. (2003) catalogues of NGC , both observed with Keck/LRIS.
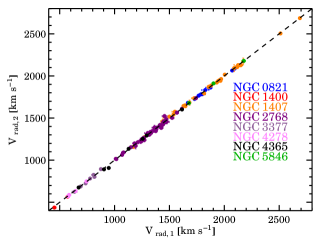
In Figure 8 we compare our DEIMOS dataset with literature studies. There is a rough agreement between external datasets and our DEIMOS radial velocities, although the root-mean-square of the velocity difference between the two datasets is larger than what was found with DEIMOS repeated measurements.
We supplement our GC catalogues with external GC radial velocities corrected for the mean offset between the literature and our DEIMOS measurements. This offset is for both NGC and NGC . In NGC , the offset between DEIMOS radial velocities and Brodie et al. (2005) is effectively zero, and we only correct the dataset of Larsen et al. (2003) by .
We test the reliability of our spectroscopic measurements by comparing the radial velocity of two or three GCs observed over different nights. Overall, we have collected 118 repeated GC radial velocities and these are shown in Figure 9. One-third of the total repeated sample is from a NGC mask that was observed twice with a one night offset. We find that repeated GC measurements are in good agreement in all the galaxies. The root-mean-square (rms) of the velocity difference between two observations is .
4.3 Kinematic analysis
We study the kinematic properties of our GC systems using a maximum likelihood approach. We summarize here the main points of this analysis and refer to Foster et al. (2011) for the details. We divide the data in radial bins and then we fit the amplitude of the rotation (), the velocity dispersion () and the kinematic position angle () simultaneously. The bin size varies from galaxy to galaxy (wider for larger datasets) and it was set to have roughly the same number of objects per bin. For the radial bin we minimise the function:
| (3) |
where:
| (4) |
In eq. 4, , and are the position angle, recession velocity and uncertainty on the recession velocity for the GC, respectively. The axis ratio of GC systems is challenging to derive directly because of low number statistics, but it has been constrained in galaxies with large photometric datasets (Kissler-Patig et al. 1997, Strader et al. 2011, Blom et al. 2011). Therefore, the kinematic axis ratio of the GC system was assumed to be equal to the respective photometric axis ratio of the galaxy light (see Table 1). The galaxy systemic velocity was fixed to the values given in Table 1 because the GC mean velocity is in good agreement with the galaxy systemic velocity itself. Uncertainties on the fits to the GC kinematics are obtained using a bootstrapping method similar to that used by Côté et al. (2001). We obtain 1000 “mock” GC kinematic samples for each galaxy, by sampling with replacement from our measured distribution. Think kind of kinematic modelling tends to overestimate the rotation amplitude when the kinematic position angle is a free parameter. The correction for this bias is described in Appendix A.
By way of example, the best fit to eq. 4 for the GCs in NGC and its kinematic dataset are shown in Figure 10 and Table 5, respectively.
The kinematic method described above was used to investigate the kinematic properties of our surveyed galaxies in two different ways:
-
•
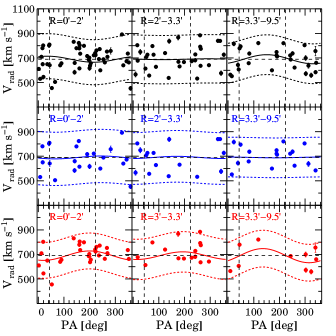
First, the kinematic properties of each GC system were calculated as a function of the galactocentric radius. This approach allows us to compare the kinematics of a given GC system to different kinematic probes (e.g., long-slit spectroscopy and/or PNe kinematics). We generally use between and GCs per bin depending on the galaxy. These results are shown in Figure 11.
-
•
Secondly, the confirmed GCs were sorted by their colour to study the GC kinematics as a function of colour. Here we use moving colour bins of equal width (with usually GCs per bin) to investigate the effect of each GC on the final fit. This analysis is independent of the photometric dividing colour and it has the advantage of testing whether or not there is a transition in the kinematics between the two subpopulations. These results are shown in Figure 13.
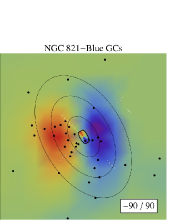
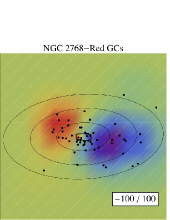
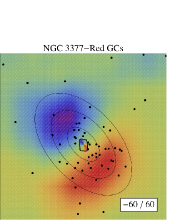
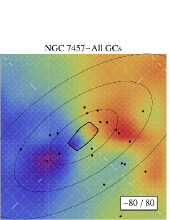
To better appreciate the global kinematic properties of our GC systems, we also construct a 2D smoothed velocity field for our elongated early-type galaxies (i.e., galaxies with : NGC , NGC , NGC , NGC ). These galaxies are all part of the ATLAS3D sample (Krajnović et al., 2011) and are indeed good candidates to compare their moderate–fast stellar rotation in the innermost regions with the kinematics of their GC system. At every position on the sky we compute the local radial velocity via interpolation of the weighted average radial velocities of the nearest neighbours, similar to the technique used in Coccato et al. (2009):
| (5) |
with the weights being the reciprocal of the square distance between two neighbour GCs. The 2D velocity field was smoothed using a Gaussian filter kernel of variable width for each galaxy on a regularly spaced grid. The kernel size was arbitrarily set between and kpc depending the sampling of the GC system and on the size of the galaxy. For the sake of comparison, we analysed the SAURON data-cubes (Emsellem et al., 2007) of the same four early-type ellipticals in order to reproduce their 2D stellar velocity fields using our technique. These results are shown in Figure 15.
We also compute the root-mean-square velocity:
| (6) |
This quantity coincides with the velocity dispersion in eq. 4 if the contribution of the rotation is negligible. The uncertainty on the is estimated with the formulae provided by Danese et al. (1980).
| ID | RA | Dec | Vrad | Vrad | ||||||
|---|---|---|---|---|---|---|---|---|---|---|
| [Degree] | [Degree] | [ km s-1] | [ km s-1] | [mag] | [mag] | [mag] | [mag] | [mag] | [mag] | |
| (1) | (2) | (3) | (4) | (5) | (6) | (7) | (8) | (9) | (10) | (11) |
| NGC_GC1 | 8 | 3 | ||||||||
| NGC_GC2 | 10 | |||||||||
| NGC_GC3 | 13 | |||||||||
| NGC_GC4 | 17 | |||||||||
| NGC_GC5 | 14 | 1 | ||||||||
| NGC_GC6 | 15 | |||||||||
| NGC_GC7 | 18 | |||||||||
| NGC_GC8 | 5 | |||||||||
| NGC_GC9 | 6 | |||||||||
| NGC_GC10 | 7 | |||||||||
| NGC_star1 | 1 | |||||||||
| NGC_star2 | ||||||||||
| NGC_gal1 | ||||||||||
| NGC_gal2 | ||||||||||
5 Notes on individual galaxies
In this section we briefly discuss the kinematic results for our new nine GC systems that are presented in Figure 11, Figure 13 and Figure 15.
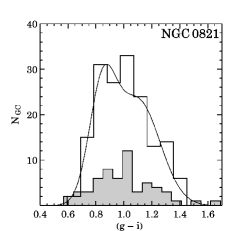
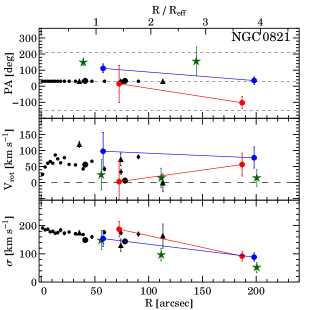
5.1 NGC 821
NGC is an isolated E6 galaxy (de Vaucouleurs, 1991) with photometric and kinematic signatures of an edge-on stellar disk (Emsellem et al. 2007; Proctor et al. 2009). The dark matter content of this galaxy has been debated in the literature. Romanowsky et al. (2003), and recently Teodorescu et al. (2010) found that the velocity dispersion of the PNe decreases with radius. In contrast, Weijmans et al. (2009), Forestell & Gebhardt (2010) and Proctor et al. (2009) found a flat velocity dispersion for the stellar component within 100 arcsec. A photometric study of the GC system of NGC was carried out by Spitler et al. (2008) using wide-field WIYN and HST observations. They were able to detect significant colour bimodality only after combining ground-based and space-based observations.
Our Subaru observations suffer from moderate band seeing ( arcsec). However, we detect significant GC colour bimodality, although the blue and the red peaks are not clearly visible. We confirm that the surface density profile of the GC system extends up to arcmin, as suggested from the WIYN imaging.
The combination of the poor band seeing, and the presence of the th magnitude star arcmin from the galaxy centre, resulted in a low return rate of spectroscopically confirmed GCs. In total, we obtained radial velocities for GCs over DEIMOS masks. We adopt a colour split at . This value was used to analyse the kinematics of blue and red GC subpopulations separately.
We detect significant rotation only for the blue GCs and for a small group of red GCs. The blue GCs are found to rotate at along PA deg, consistent with the photometric minor axis and in agreement with that found by Coccato et al. (2009) using PNe. Such a peculiarity is clearly visible in Figure 13. We will discuss this feature and its implications in more detail later. Interestingly, we note that the direction of the GC and PNe rotation coincides with an elongated jet/outflow structure detected in the X-ray (Pellegrini et al., 2007). With the adopted colour split, the kinematic position angle of the red GCs is generally unconstrained, except the outer red GCs that counter rotate with respect to the host galaxy stars. The velocity dispersion of both the red and the blue GCs declines with radius with a slope similar to that of the PNe and host galaxy stars.
| Galaxy ID | PAkin,A | PAkin,B | PAkin,R | |||||||
|---|---|---|---|---|---|---|---|---|---|---|
| [ km s-1] | [ km s-1] | [ km s-1] | [ km s-1] | [deg] | [deg] | [deg] | ||||
| (1) | (2) | (3) | (4) | (5) | (6) | (7) | (8) | (9) | (10) | (11) |
| NGC | ||||||||||
| NGC | ||||||||||
| NGC | ||||||||||
| NGC | ||||||||||
| NGC | ||||||||||
| NGC | ||||||||||
| NGC | ||||||||||
| NGC | ||||||||||
| NGC | ||||||||||
| NGC | ||||||||||
| NGC | ||||||||||
| NGC |
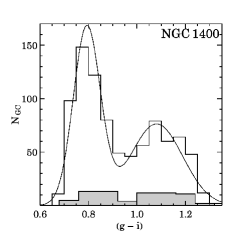
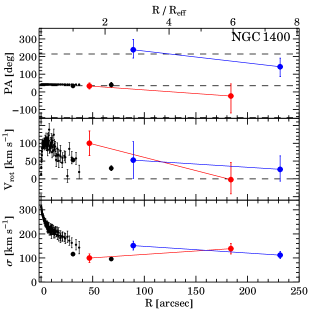
5.2 NGC 1400
NGC has been classified both as a face-on S (Jarrett et al., 2003) and as an E0 (e.g., da Costa et al. 1998). It is the second brightest galaxy in the Eridanus group after NGC . We have assumed that NGC and NGC lie at the same distance of Mpc. NGC is characterised by a uniformly old stellar age up to (Spolaor et al., 2008) and by an unusually low systemic velocity (V) for its distance. Forbes et al. (2006) studied the GC system of this galaxy using Keck/LRIS in imaging mode, detecting significant bimodality.
The photometric GC selection was performed within arcmin from the galaxy centre to minimise the contamination from NGC GC system, resulting in a clear bimodal distribution, with the colour separation occurring at . The GC surface density was corrected for the local NGC contribution. This galaxy shows the steepest red surface density profile among our galaxies, similar to the slope of the galaxy surface brightness. In contrast, the profile of the blue GC subpopulation is more radially extended and also requires a power-law fit, because a Sèrsic function does not return a satisfactory solution.
We present here radial velocities for blue and red GCs respectively, for a total of spectroscopically confirmed GCs. Despite their small angular separation arcmin), NGC and NGC also have a large peculiar velocity difference ( km s-1), assuring a reliable separation of their spectroscopically confirmed GCs. The red GCs mimic the rotation of the stars in the inner regions, whereas the rotation of the blue GCs is consistent with zero with a marginal signature of counter-rotation in the inner radial bin. The velocity dispersion of the red GCs is in agreement with long–slit data in the region of overlap, with a slightly increasing trend towards the outer regions. Conversely, the velocity dispersion of the blue GCs decreased with the radius.
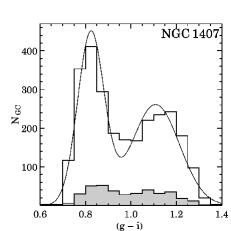
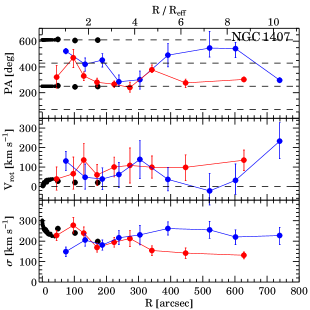
5.3 NGC 1407
NGC is a massive E galaxy at the centre of the dwarf galaxy dominated Eridanus A group (Brough et al., 2006). It shows moderate rotation along the photometric major axis and has a weak central AGN (Zhang et al., 2007). The stellar population analysis of Spolaor et al. (2008) found the galaxy to possess a uniformly old age within . A dynamical analysis of NGC was given by Romanowsky et al. (2009). They used Suprime-Cam imaging and DEIMOS spectra for GCs and found a massive dark halo.
In this work, we use the photometric results presented in Romanowsky et al. (2009) in which the Suprime-Cam imaging was reduced and analysed with the same methodology described in this paper. The colour distribution shows clear bimodality with the colour separation occurring at . We supplement the spectroscopic sample of Romanowsky et al. (2009) with additional DEIMOS masks, that make NGC , with a total of spectroscopically confirmed GCs, the most populous spectro-photometric dataset in our galaxy sample.
We detect rotation along the photometric major axis for both GC subpopulations. The blue GCs rotate in the innermost radial bin along the photometric minor axis and between and along the photometric major axis. Similarly, the rotation of the red GCs occurs along the photometric major axis directions, but in this case the rotation signal is generally larger and better constrained than that of the blue GCs. Both GC subpopulations appear to rotate in the outermost regions of the galaxy along the major axis of the galaxy. The velocity dispersion of the red GC subpopulation in the inner regions is consistent with stellar data from Spolaor et al. (2008) and Proctor et al. (2009) showing a decreasing profile up to 10 . Conversely, the velocity dispersion of the blue GCs increases with radius.
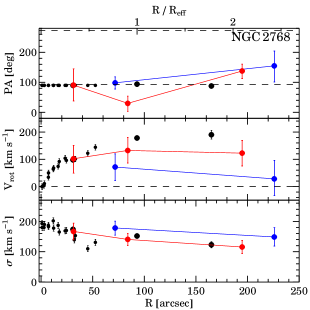
5.4 NGC 2768
NGC is classified as E in de Vaucouleurs (1991) and as S in Sandage & Bedke (1994). Spectroscopic studies of the very central regions (McDermid et al., 2006) have also suggested a young ( Gyr) stellar population associated with the disk, as supported by the recent supernova SN2000ds (Filippenko & Chornock, 2000). Kundu & Whitmore (2001) studied the HST/WFPC2 photometry for 113 GC candidates in this galaxy, finding a statistically significant probability of it having a bimodal colour distribution.
In this work, NGC was imaged with filters, in good seeing conditions but with the lowest exposure time among our sample of galaxies. Using KMM we found the colour distribution to be bimodal, with the blue and red peaks at and respectively. Bimodality was also found in the HST/ACS West pointing used to design the DEIMOS masks in the central region. The colour peaks occur at (F435W F814W) and respectively.
We find 109 spectroscopically confirmed GCs over 5 DEIMOS masks observed in sub-arcsec seeing conditions. Using a colour split at and excluding the marginal GCs, we investigate the kinematics of the resulting blue and red GCs respectively.
We find significant rotation only for the red GCs, which rotate roughly along the photometric major axis in agreement with the host galaxy stars. The –D velocity field of the red GCs is akin to that of ATLAS3D in the inner regions (Figure 15). The blue GCs have a marginally higher velocity dispersion profile than the red GCs.
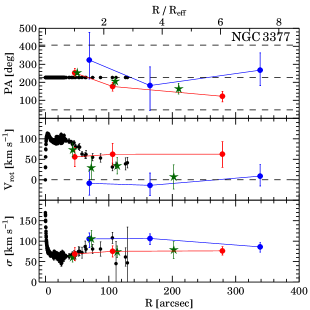

5.5 NGC 3377


NGC is a classical E6 elliptical in the Leo I group and the closest galaxy in our sample. The resolved stellar properties of NGC have been studied by (Harris et al., 2007) that found no evidence for any young ( Gyr) stellar population. Coccato et al. (2009) studied PNe in this galaxy, detecting significant rotation within arcmin and a kinematic major axis twist of deg from the major towards the minor axis. Kundu & Whitmore (2001), Chies-Santos et al. (2011) and Cho et al. (2012) studied the GC system of this galaxy using HST imaging, finding the colour distribution to be likely bimodal.
NGC was imaged with filters and gz filters for ground based and space based observations respectively. We found a high probability for the colour distribution to be bimodal, both in our Suprime-Cam and in the supplementary ACS archive imaging, as already found in Chies-Santos et al. (2011).
In this work, we present radial velocities for 126 GCs, observed in 4 DEIMOS masks. It is worth noting that we extend the kinematics of this galaxy to kpc, two times further than the PNe studies. We rule out two GCs that are likely to belong to the spiral galaxy NGC A (V 573 km s-1) that lies arcmin North-West from NGC . With a colour split at we study the kinematics of blue and red GCs, respectively.
We detect significant rotation for the red GC subpopulation along the photometric major axis in agreement with PNe and long–slit data (Coccato et al., 2009). As found for the PNe, we discover that the kinematic position angle of the red GC subpopulation twists with radius from deg to deg (see also Figure 10). The –D velocity field of the red GCs is consistent with ATLAS3D in the inner regions (Figure 15). The position angle of the blue GC subpopulation is unconstrained, implying an overall null rotation with radius. The velocity dispersion of the red GC subpopulation is very flat and it matches the stellar and the PNe. The blue GCs have an overall higher velocity dispersion profile than the red GC subpopulation.
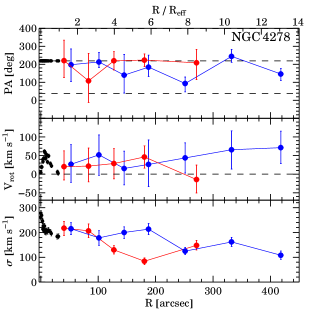
5.6 NGC 4278
NGC is an elliptical (E–) member of the Coma I cloud. It has been extensively studied at different wavelengths: in radio, Nagar et al. (2005) detected two sub-parsec jets; in X-rays, a long (months) time scale variability (Ho et al., 2001) and a dominant nuclear source (Younes et al., 2010) were detected. It has long been known for its massive ( M☉) H I disc extending beyond (Gallagher et al., 1977) and used to infer the dark matter content at large radii (Bertola et al., 1993). The bimodality of the GC system of NGC has been under debate. Both Forbes et al. (1996) and Kundu & Whitmore (2001) investigated the GC system of NGC with HST/WFPC2, finding a marginal or “likely” probability for the distribution to be bimodal. Recently, Chies-Santos et al. (2011) combined HST/ACS and WHT/LRIS imaging, finding evidence for bimodality in space-based but not ground-based datasets.
In this work we present new wide field Suprime-Cam imaging (with the band in poor seeing conditions), combined with four and HST/ACS pointings downloaded from the Hubble Legacy Archive (see Section 3.2). We find statistically significant bimodality both in our ground-based and space-based observations, with the colour separation occurring at and , respectively.
We spectroscopically confirm GCs over four DEIMOS masks observed in good seeing conditions. Given the wide field coverage of the four HST pointings, we decided to use HST magnitudes to divide the kinematics of blue and red GC subpopulations, converting colours into if only Subaru photometry was available. As for other group members, we exclude from the kinematics analysis GCs that might be associated with other galaxies. We select and remove three GCs whose position and radial velocity are consistent with the galaxy NGC that lies ( kpc) arcmin from NGC .
We find no clear evidence for red GC rotation, but there is a hint that the blue GCs rotate in the outer regions along a direction intermediate between the major and the minor axis. The velocity dispersion of the red and blue GCs seem to be in good agreement with long–slit data in the inner regions although there is no direct overlap between the two datasets. The blue GCs have an overall higher velocity dispersion at intermediate radii.
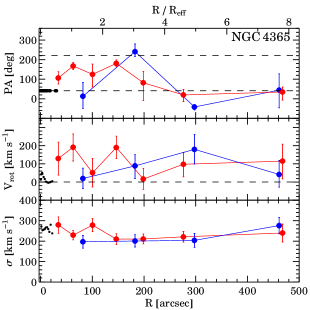
5.7 NGC 4365
NGC is a massive elliptical (E3) behind the Virgo cluster with signs of an ongoing merger (Mihos et al. 2012, in preparation). It has a kinematically distinct core (Krajnović et al., 2011) and an unusual stellar rotation along the photometric minor axis (Bender et al., 1994). Its GC system is mainly known for an odd GC colour distribution that seems to suggest the presence of three, instead of the classic two, subpopulations (Larsen et al., 2003; Larsen et al., 2005; Brodie et al., 2005; Blom et al., 2011).
We make use of the photometric results presented in Blom et al. (2011) based on HST/ACS and Suprime-Cam imaging. In this work, we will treat the GC system of NGC as made up of two classic subpopulations and we refer to Blom et al. (2012, in preparation) for a detailed study of the kinematics of the three subpopulations. We use a colour split at that includes the “green” GCs as part of the red subpopulation. We represent here the surface density profile published in Blom et al. (2011) that shows that red GCs is more centrally concentrated than the blue GC subpopulation, with a trend similar to that of the galaxy stellar light (Figure 6).
We spectroscopically confirm GCs over 6 DEIMOS masks. We study the kinematics of blue and red GCs respectively. We also add 9 GCs from the combined dataset of Larsen et al. (2003) and Brodie et al. (2005) as described in §4.2. We find that the red GCs rotate within arcsec along the photometric minor axis, mimicking the kinematics of the stars. The rotation of the blue GCs is only significant at intermediate radii. The velocity dispersion profile is identical for the blue and the red GCs.
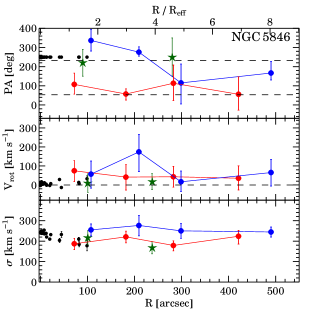
5.8 NGC 5846
NGC is the brightest member of a galaxy group. The dynamics of NGC has been modelled within 1 (Cappellari et al. 2007; Kronawitter et al. 2000). Recently, Das et al. (2008) derived the mass of this galaxy up to 11 exploiting X-ray and PNe observations. An HST/WFPC2 analysis of the NGC GC system was given in Forbes et al. (1997) and then revisited by Chies-Santos et al. (2006). In addition to the classic bimodality, they also discovered that the GC system is better aligned with the galaxy’s minor axis than its major axis and that this galaxy has an unusually low specific frequency compared to similar dominant ellipticals in groups or clusters.
In this work we present new Subaru photometry in filters, with the band in moderate seeing conditions ( arcsec). Although the red peak is not clearly visible (Figure 5), KMM returned a high probability for the colour distribution to be bimodal with a colour split at .
We spectroscopically confirm GCs over DEIMOS masks. We also note that some radial velocities might be associated with other bright members of the group as NGC A () and NGC (). However the similar systemic velocities of these galaxies with NGC () makes any attempt to distinguish their GC populations problematic. We also supplement our DEIMOS catalogue with 22 GCs from the dataset of Puzia et al. (2004) as described in §4.2. In summary, we study the kinematics of blue and red GCs.
We detect rotation only for the blue GCs, which rotate between and arcsec close to photometric major axis. This feature might be caused by the GCs of NGC A, which contaminates our sample within arcsec. The velocity dispersion of the red GCs is flat with radius and consistent with other studies, although the PNe seem to suggest a slightly decreasing slope. The blue GCs have a systematically higher velocity dispersion than the red GC subpopulation.
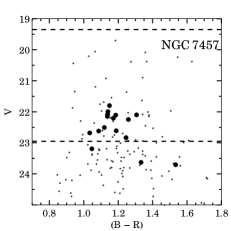
5.9 NGC 7457
NGC is an isolated S with a pseudo-bulge detected both photometrically (Tomita et al., 2000) and kinematically (Pinkney et al., 2003) that shows an unusually low central velocity dispersion for its luminosity. Emsellem et al. (2007) revealed that this galaxy has a small counter rotating core that might be the result of a merger. Chomiuk et al. (2008) gave an overview of the GC system of NGC using HST observations and Keck/LRIS spectra for GCs. They find evidence for a third intermediate population of GCs sharing the same age ( – Gyr) as the young nuclear (radius of 1 arcsec) stellar population discovered by Sil’chenko et al. (2002).
NGC is the only galaxy in our sample not observed with Suprime-Cam. We have instead used the photometric results of Hargis et al. (2011) to design our DEIMOS masks, and we refer to their paper for a detailed description of the data reduction and analysis. They provide wide field WIYN/Minimosaic photometry of the GC system of this galaxy, finding that the colour distribution is not bimodal and showing the total population to be made up of GCs with a radial extent of kpc.
We find 21 spectroscopically confirmed GCs in two DEIMOS masks observed in average arcsec seeing conditions. We also obtained spectra for of the GCs already observed by Chomiuk et al. (2008), finding their LRIS and our DEIMOS radial velocities to be consistent within the errors, but with a mean difference of (see §4.2). Therefore, we add the remaining Chomiuk GCs corrected for the velocity offset to our GC sample. The final GC catalogue consists of 27 GC radial velocities.
Our confirmed GCs appear to be distributed within 2 arcmin kpc from the galaxy centre, reflecting the expected poor extent of the underlying GC subpopulation. The mean velocity of the system () is in good agreement with both Chomiuk et al. (2008) and literature data. As this galaxy appears to be unimodal in colour, we fit the kinematics of all the GCs without any split in colour and we compare the results with the long-slit data of Simien & Prugniel (2000). We find that the GC system of NGC is rapidly rotating along the photometric major axis, with a flat rotation curve at up to . In contrast, the velocity dispersion is low at all radii. The agreement with the ATLAS2D velocity map is also very good (Figure 15). We will discuss the implication of these results in more detail in §10.4.
6 GC formation models
Having determined the photometric and kinematic properties of our GC sample, in the following sections we will discuss these results as a whole. We look for common kinematic features that might retain key information about the formation history of the galaxies themselves and then we compare these results to theoretical models. In order to do so, it is first worth giving a brief summary of the main GC formation scenarios proposed in the literature, focusing on their kinematic predictions.
To date, the formation of GC bimodality has been investigated both in a cosmological context (Kravtsov & Gnedin, 2005; Diemand et al., 2005; Moore et al., 2006) and at smaller scales, with models fine tuned to reproduce the properties of specific galaxies (see Vesperini et al. 2003 for NGC or Deason et al. 2011 for the Milky Way and M31). The challenge of producing simulations of GC bimodality formation is intertwined with our poor understanding of how GC systems formed in the first place (e.g., Beasley et al., 2002; Elmegreen et al., 2012). As a consequence, the three classic formation scenarios proposed in the literature and summarized below have few, if any, theoretical predictions directly comparable with the observations. In particular, there is a general dearth of GC kinematics predictions.
In the major merger scenario (Ashman & Zepf, 1992) two or more gas-rich disk galaxies with pre-existing blue and red GC subpopulations merge to form an elliptical galaxy. New red GCs may form from the star formation induced by the merger (Bekki et al., 2002).
This scenario has been simulated by Bekki et al. (2005) (hereafter B05). In this simulation the pre-existing blue and red GCs are assumed to have a Milky Way-like spatial distribution, but they are both pressure-supported. This is a reasonable assumption for the blue but not for the red GCs of the Milky Way that are known to be rotation-supported (Côté, 1999; Deason et al., 2011). B predicted that a merger with even mass-to-mass ratio produces strong rotation for both GC subpopualtions in the outer regions of the remnant. This result is independent of the orbital configuration of the merger. The velocity dispersion profile is predicted to decrease with radius, but it would be flatter in case of multiple mergers. Also, the blue GCs are expected to show a larger central velocity dispersion than red GC subpopulation. Finally, the ratio of the maximum rotational velocity to the central velocity dispersion of the GC systems ranges from 0.2 to 1.0 within 6 for both the blue and red GC subpopulations, but most GC systems, viewed from various angles, have . Bekki & Peng (2006) carried out a simulation similar to that of B (with the rotation of the disk in the spiral progenitors included), fine tuned to study the dynamics of the planetary nebulae (PNe) in elliptical galaxies. They found that the effect of the residual spin disk (additional to the initial orbital angular momentum) on the final PNe kinematics enhances the rotation at all radii, making the merger remnant rotation-supported.
In the multiphase dissipational collapse scenario (Forbes et al., 1997), GCs are the result of an early two phase collapse, and hence two main star formation episodes, that the galaxy undergoes. The blue GCs form during the first star formation episode in a metal-poor cloud, whereas red GC subpopulation form in a second phase after the gas in the galaxy is self-enriched. In this scenario, a fraction of blue GCs might also come from accreted satellite galaxies, similar to the most recent two-phase galaxy formation model (Oser et al., 2010). No numerical simulations have been performed so far to test this model. Since the red GCs are coeval with the galaxy stellar component, Forbes et al. (1997) infer that they should share the same kinematic properties as the galaxy stars, and hence also the same spatial distribution. No significant rotation is expected for the blue GC subpopulation.
In the dissipationless accretion scenario (Côté et al., 1998), the red GCs form from the monolithic collapse of a giant protogalactic cloud, whereas the blue GCs are accreted from low mass galaxies due to mergers or tidal stripping. To date, simulations based on similar scenarios have been performed (e.g., Oser et al., 2010) but they do not include GC particles, and they have not made kinematic predictions. In addition to the observation of infalling co-moving groups, Côté et al. (1998) also infer that we should expect to observe blue GCs with radially biased orbits without overall rotation.
Bekki et al. (2008) (hereafter B08) performed a high resolution N-body cosmological simulation combined with semi-analytic models. They found that almost half of the simulated galaxies show clear bimodality in their GC metallicity distribution. The majority of GCs form in low-mass galaxies at redshift greater than 3 with the blue GCs being slightly older ( Gyr) than the red GC subpopulation. B08 also made predictions for the overall kinematics of each GC system, whereas current spectroscopic observations only sample a smaller fraction of it. They find that the velocity dispersion of blue and red GC subpopulations increases with the total luminosity of the host galaxy and that the ratio of the velocity dispersion of the blue to red GC subpopulation is for a wide range of luminosity. Finally, they also predicted that the GC systems of most galaxies are mainly pressure supported with (. This is in contrast with the wider range of found by B.
7 Global results from our GC sample
In this section we summarize the results for the GC systems presented in this paper, including the three galaxies previously published by us (i.e., NGC , NGC , NGC ). Section 8 will incorporate other literature data, and tackle topics not covered here.
7.1 Spatial Distribution
Significant colour bimodality was detected in all the GC systems, except for NGC . All GC system formation scenarios, as well as numerical simulations, predict that this bimodality should be reflected in different spatial distributions of the two subpopulations around the parent galaxy. A glance at Figure 6 reveals that this is also the case for our galaxy sample. Generally speaking, the red GCs are more centrally concentrated than the blue GCs, as already found in other studies (e.g., Schuberth et al., 2010; Faifer et al., 2011; Strader et al., 2011).
The advent of wide field imaging has shown that the radial distribution of the red GC subpopulation matches that of the host galaxy light, suggesting that they might have shared a similar formation history (Bassino et al., 2006). Here we have exploited the arcmin2 field of view of our Suprime-Cam imaging to compare the GC surface density to the surface brightness of the respective host galaxy (shifted by an arbitrary constant). Qualitatively speaking, the galaxy starlight has a similar slope to that of the red GC subpopulation. The discrepancies between the surface brightness and the GC spatial distribution in innermost regions (e.g., see NGC and NGC in Figure 6) is due to the core-like distribution of the GCs, that makes the GC density profile flatter. This feature is interpreted as the effect of the GC disruption, stronger in the central regions (Baumgardt, 1998; Baumgardt & Makino, 2003).
7.2 Rotation
We find a large variety of GC rotation profiles. Both the blue and red GCs show some degree of rotation, but there does not seem to be a clear correlation between the rotation patterns and the property of the host galaxy. A glance at Figure 11 reveals that the red GCs rotate more consistently with the photometric major axis than the blue GC subpopulation does. For our galaxy sample the photometric position angle coincides with the photometric major axis of the galaxy stars (except for NGC ), which means that the rotation velocity of the red GC subpopulation is similar to that of the galaxy stars. This is also true for the overall GC system of NGC .
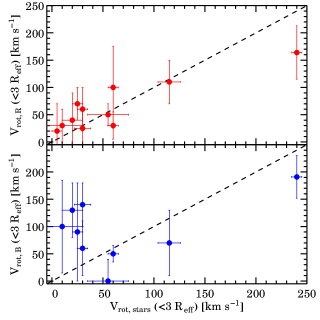
To quantify this phenomenon, in Figure 16 we compare the major axis rotation velocity of the blue and the red GC subpopulations within 3 to the rotation velocity of the stars and PNe (if available) at the same galactocentric distance. The exact extraction radius was set to 2, but in some cases this was relaxed by to maximise the overlap between the GCs and the stars. The rotation velocity of the host galaxy stars was extracted along the photometric major axis for all the galaxies, except for NGC in which the bulk of the stellar rotation is occurring along the photometric minor axis. The red GC rotation for our galaxies is similar to those of the host galaxy stars, at least for galaxies with a conspicuous amount of stellar rotation. On the other hand, the star-GC system coupling is also evident for only blue GC subpopulations, such as in NGC , NGC and NGC .
The rotation of the blue GCs is more puzzling than the red GCs. Overall the rotation of the blue GCs is lower than the red GCs and often consistent with zero, yet we also detect minor axis rotation in NGC , also seen in PNe, in contrast with integrated starlight.
We detect GC rotation at large galactocentric radii for some galaxies. This feature is only significant in NGC , NGC and only marginal in NGC . The outer rotation occurs in the same direction for both the blue and the red GC subpopulations and it usually coincides with the photometric major axis.
7.3 Velocity Dispersion
| Galaxy ID | Hubble | NGCs | Ref. | ||||||||
|---|---|---|---|---|---|---|---|---|---|---|---|
| Type | [mag] | [Mpc] | [ km s-1] | [ km s-1] | [ km s-1] | ||||||
| (1) | (2) | (3) | (4) | (5) | (6) | (7) | (8) | (9) | (10) | (11) | (12) |
| NGC | SA0 | P04 | |||||||||
| NGC | E1 | S | |||||||||
| NGC | cD | M | |||||||||
| NGC | E1 | P; B | |||||||||
| NGC | E6 | P04 | |||||||||
| NGC | E4 | N | |||||||||
| NGC | E2 | C | |||||||||
| NGC | E2 | L | |||||||||
| NGC | E2 | H | |||||||||
| NGC | S | W |
Our results show that the velocity dispersion profiles are quite flat for most of the galaxies, both as a function of radius (Figure 11) and as a function of the colour (Figure 13). The slope of the velocity dispersion profiles (including the contribution of the rotation) will be discussed below.
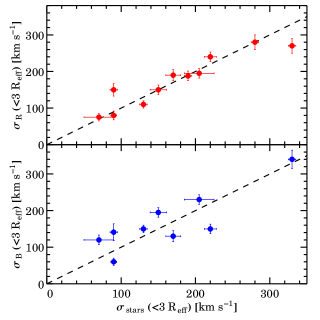
As for the rotation, we study how the velocity dispersion of the two GC subpopulations compares to the velocity dispersion of the host galaxy stars. We extract the velocity dispersion at the same galactocentric distances as done with the rotation. Figure 16 shows that the velocity dispersion of the red GC is very similar to that of the host galaxy stars in the region of overlap. Conversely, the blue GC subpopulations seem to avoid the one-to-one line. The standard deviation from the one-to-one line is and for the red and the blue GC subpopulations respectively.
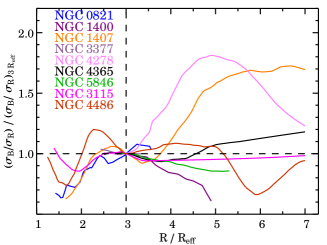
To quantify the differences between the velocity dispersion profiles of the two GC subpopulations, in Figure 17 we plot the ratio of the velocity dispersion of the blue GCs to the velocity dispersion of the red GCs () normalised to 3 as a function of the effective radius. In this case we show the velocity dispersion using rolling radial fits to appreciate the details of the profiles. Figure 17 shows that the ratio ratio is generally consistent with , but it increases towards the outer regions for some galaxies, as already observed for more massive galaxies (Lee et al., 2010).
The overall velocity dispersion profiles are in rough agreement with their merger remnants assembled via multiple mergers, with the velocity dispersion of the blue GCs being larger or equal to that of the red GCs. However, the model fails in reproducing the irregularity of some dispersion profiles (e.g., NGC and NGC ).
8 Including literature data
We examined the literature for galaxies with a reasonable number of GC radial velocity measurements. We require at least 20 spectroscopically confirmed GCs for a galaxy to be included in the literature sample. We use the same friendless algorithm as described in §4.1 to clip outliers in radius-velocity space. This selection returned ten GC systems, which are summarized in Table 7. Most of these galaxies are dominant group/cluster galaxies discussed in Lee et al. (2010), whereas the less massive galaxies are part of the survey of Puzia et al. (2004). We also include NGC from Norris et al. (2012) which shows strong signatures a recent interaction. A first comparison between our GC dataset and external datasets was already given in Figure 2 in which we showed that we cover a wider range of mass with three times better velocity accuracy than previous studies.
We ran the kinematic likelihood code on the literature galaxies to get the overall best fit values to eq. 4, but we do not show the kinematic radial profiles for the literature sample. We investigate the kinematics of blue and red GC subpopulations for seven out of ten galaxies using the dividing colour quoted in the respective papers. For consistency with the kinematic analysis of our galaxies, we do not exclude UCD candidates from the literature data. We find that our likelihood-method tends to reduce both the velocity dispersion (by ) and the rotation amplitude (up to ) if the contribution of the rotation is low (). We attribute this discrepancy to the fact that some previous GC kinematics studies have employed error-weighted least-square rotation fittings that are less appropriate for a system with an intrinsic dispersion. Another explanation might be that, to our knowledge, previous studies have never explicitly taken into account the bias introduced by an unconstrained position angle (see §4.3), which has an important effect at lower velocities. It is important to note that the maximum-likelihood approach does not alter the general results of previous works.
A final caveat to bear in mind concerns the different kinematic axes convention. Based on the fit of the GC radial velocities with the position angle (Figure 10), we define the kinematic position angle as the angle between the direction of maximum rotation amplitude and North, that is 90 degrees away from the angular momentum vector. Some previous studies have instead defined the kinematic position angle as the direction around which the rotation is occurring. In other words, our kinematic major axis would correspond to the kinematic minor axes quoted by Lee et al. (2010). Our convention is in line with that used in other galaxy kinematic studies (e.g. ATLAS3D). For the galaxy properties of the literature sample we use the same sources quoted in Table 1.
9 Results
In this section we analyze the extended sample of 22 GC systems (literature plus our own galaxies) , 18 of which have kinematics for both GC subpopulations. We carry out a number of tests to compare the kinematic properties of the two subpopulatinos with each other and with host galaxy properties.
9.1 Correlations with host galaxy properties
In Figure 18 we show the GC system kinematics as a function of the general properties of the host galaxies. We now have the chance to better constrain some relations examined by Lee et al. (2010) that were uncertain because of their limited sample size of six galaxies (see their figure 12).
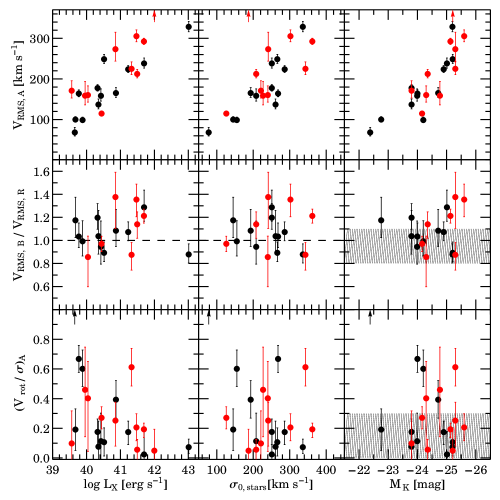
The upper panels of Figure 18 show that, as found from previous studies, a correlation exists between of the GC systems and their respective host galaxy X-ray luminosity , central velocity dispersion of the stars and absolute -band magnitude . We find that these correlations also hold for less massive galaxies. The correlations with galaxy properties are always tighter for our GC dataset as consequence of the improved reliability of our velocity measurements.
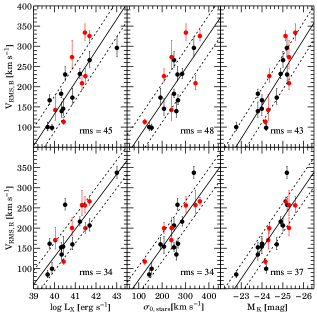
The correlation of with galaxy properties holds when we plot the of the blue and red GC subpopulations separately (see Figure 19). The main difference here is that the two subpopulations scatter differently with respect to the best fit lines. The rms of this difference for the blue GCs is systematically larger for the red GCs.
In Figure 18, the middle panel shows that most of the GC systems have . This is seen more clearly as a function of the X-ray luminosity which is larger in galaxies with an extended massive halo to which most of the blue GCs are thought to belong (Forbes et al., 2012). These results are in general agreement with the cosmological simulation of B that predicted the ratio to be slightly for a wide range of host galaxy magnitudes. We also tested the significance of the apparent correlation between and finding a Spearman’s rank correlation coefficient of , implying that a correlation is unlikely.
In the bottom panel of Figure 18 we quantify the GC system rotation by studying the overall (), which estimates the contribution of the GC rotation over its random motions. We find that galaxies are spread between except for NGC with . It also appears that galaxies with lower and lower are more rotation-supported than other galaxies. The bulk of GC systems with ( is consistent with cosmological simulation of B. However, as previously discussed, trends of rotation with radius and colour are also important to examine.
9.2 Rotation
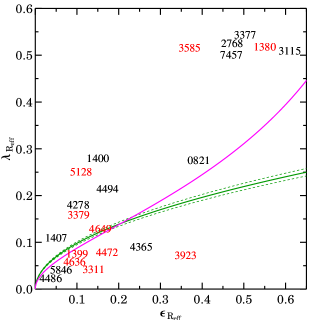
To make things clearer we divide the host galaxies into two kinematic groups that will be used throughout this section. After considering various possibilities, we finally decided to divide the GC systems according to the rotation dominance parameter of their host galaxy. We use the parameter within 1 as defined in Cappellari et al. (2007) with a threshold of to discriminate between slow and fast-rotators, where is the galaxy ellipticity. For our sample, we use from Emsellem et al. (2011) if the galaxy is in ATLAS3D, whereas we use the conversion formulae provided by the same authors to convert into , where and are the maximum rotation amplitude and the central velocity dispersion of the host galaxy respectively (Figure 20). This separation has the advantage of being independent of the galaxy inclination. It also allows us to test if the slow-fast rotator separation in the inner regions persists in the outer regions. The first group of galaxies is composed of slow-rotator galaxies and includes mostly round massive galaxies at the centre of groups or clusters. The second group includes fast-rotators but it covers a wide range of galaxy masses and morphologies, from E to S. Fast-rotator galaxies with have stellar disky-like structures (photometric and/or kinematic) in the inner regions.
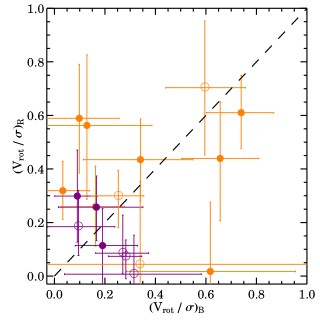
In Figure 21 we compare the overall rotational dominance parameter () of the blue and red GC subpopulations colour-coded according to their fast/slow rotator classification. We find that a dichotomy exists between the GC systems in slow and fast rotators. Most of the GC systems in the slow-rotator galaxies have . Again, we want to emphasise that this does not necessarily imply that these systems lack rotation because if their rotation occurs only in a limited radial range, it may have been smeared out in the overall (). The GC systems in fast-rotator galaxies are more rotation-supported and in general at least one GC subpopulation has a conspicuous amount of rotation. There is a group of galaxies with which includes the fast-rotator galaxies with large , but it also includes NGC with .
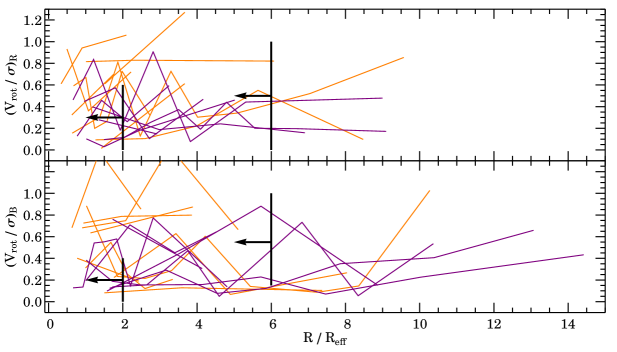
In Figure 22 we compare the radial profiles for the blue and red GC systems with the numerical simulations of B. We note that B quote the ratio of the maximum rotation velocity to the central velocity dispersion within and , whereas we plot the overall in each radial bin. Therefore, the predictions plotted in Figure 22 are typically upper limits. Another caveat is that B simulate dry mergers, which leads to a systematic mismatch with the observed rotation in the galaxy centers. However, this effect is small for (Hoffman et al., 2010), which is the radial range with better GC coverage and the most relevant for this study.
We find that for galaxies in the fast-rotator group, at least one GC subpopulation has . Slow-rotator galaxies have generally slower rotating GC systems. Although the comparison with B suggests an overall agreement of our results with their predictions, the scatter in both and in the simulations is too large to draw any strong conclusions. In more detail, the simulations predict increasing monotonically with radius but we see no evidence for this feature in our data. Moreover, a direct comparison with B simulations is not possible because they did not publish the profiles to . Figure 22 also shows that many GC systems are characterized by significant rotation spikes. These features might be partly caused by spatial incompleteness, outliers or projection effects. Alternatively, one speculative possibility is that these rotation spikes are the imprints of minor mergers. These events are expected (e.g., Vitvitska et al., 2002; Hetznecker & Burkert, 2006), and observed (e.g., Romanowsky et al., 2011), to perturb the halo kinematics of massive galaxies. Detailed studies of GC system phase-space for each galaxy are needed to quantify this effect. Norris et al. (2012) also suggested that the missing outer rotation could be explained if the reservoir of angular momentum was located beyond the radii mapped by current GC system studies. This idea would be supported by the large rotation we observe at for both GC subpopulations of NGC . However, at such galactocentric distances, results are uncertain because of spatial incompleteness and low number statistics. The same concerns were addressed by Strader et al. (2011) on the suspicious outer rotation observed in NGC .
9.3 Kinematic misalignment
It is also important to study how the rotation of the GC systems aligns with respect to the host galaxy isophotes. An eventual position angle misalignment might contain information about the triaxiality of the system (Krajnović et al., 2011).
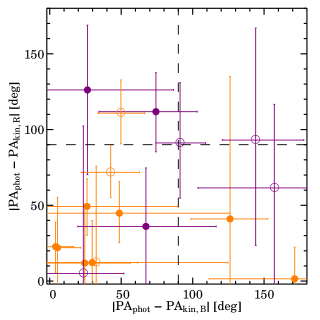
In Figure 23 we compare the PA misalignment of the blue and red GC subpopulations. For clarity, we have removed from the plot galaxies for which neither the of the blue nor of the red GC subpopulation was constrained. A caveat here is that we study overall that will be biased by kinematic twists with radius. Broadly speaking, we note that most of the galaxies are located in the bottom-left quadrant of Figure 23 towards , suggesting that the red GC subpopulation rotates more consistently with the photometric major axis than the blue GC subpopulation. We do not see a sharp separation between the GC systems in fast and slow-rotator galaxies. The GC rotation in fast-rotator galaxies seems to be equally consistent with the photometric major axis for both GC subpopulations.
The B simulations also predicted kinematic misalignments with respect to the galaxy isophotes, albeit with an amplitude smaller than our findings. Depending on the orbital configuration, these authors can also reproduce the minor-axis rotation for the blue and red GC subpopulations, but they do not quantify this effect. Unfortunately, B do not provide radial kinematic misalignments profiles, but they find that the rotation of both GC subpopulations in the outer regions of a merger remnant should be aligned along the photometric major axis, which is in rough agreement with our findings.
9.4 The slope of the profile
The , sometimes freely named as velocity dispersion if the contribution of the rotation is low, is related the line-of-sight kinetic energy of a galaxy per unit of mass. Its profile has been classically used to model dark matter halos. Here, instead of showing the detailed profile for our GC system sample, we think it is more convenient to parametrize these profiles and to study their overall slopes. We use a maximum-likelihood approach to fit a power-law function to the non-binned profile, similarly to that done in eq. 4 for the GC system kinematics. In this case the function to be minimized is (Bergond et al., 2006):
| (7) |
and the function to be modelled is:
| (8) |
where is a scale parameter, set here to the median galactocentric distance of each GC system. and are two parameters free to vary, with the latter representing the slope of the power-law: increasing if and decreasing if . Uncertainties on this method were obtained by bootstrapping the sample 2000 times in order to obtain the per cent confidence levels.
Bearing in mind that the shape of the profile might change with radius (see the velocity dispersion profile of NGC ), in Figure 24 we show the best fit for each GC subpopulation (including the combination of the two) as a function of the host galaxy magnitude. The overall slope of the profile () of the the GC systems is generally positive, but it becomes for brighter galaxies, implying a constant or even increasing profile. If we now consider the blue and red GC subpopulations separately, it is clear that this effect is caused only by the blue GC subpopulations in galaxies with mag. The red GC subpopulations are always consistent with having and a linear fit to the data suggest no significant trend with the magnitude. It is not clear why we do not observe also for the red GC subpopulation. The two GC subpopulations might have different orbital configurations as a consequence of different formation histories and this would alter the shape of the profiles. Therefore, it is important also to study the orbits of the GC systems.
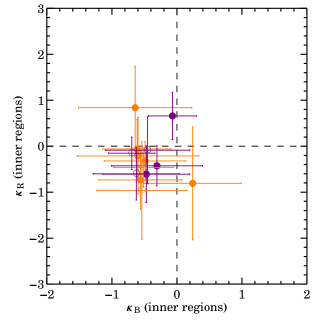
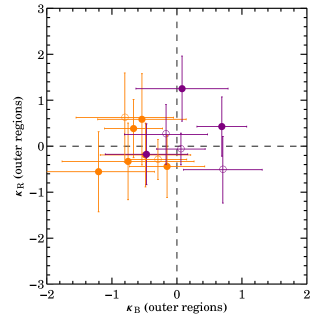
9.5 Kurtosis
The galaxy anisotropy has classically been measured through the parameter that gives the relative ratio of the tangential to the radial velocity dispersion for a given dynamical tracer (Binney & Tremaine, 2008). The calculus of for our GC systems is not a topic of this paper and we will instead keep things simple by calculating the kurtosis that measures the deviation of a velocity distribution from a Gaussian. In the regime of a constant velocity dispersion the kurtosis provides a rough estimate of the GC orbits. These will be will be radial , isotropic or tangential , respectively. Broadly speaking we measure the fourth-order velocity moment:
| (9) |
but in practice we will use a more complicated bias-corrected formula from Joanes & Gill (1998).
We divide the radial kurtosis profiles in two radial bins in order to have roughly the same number of GCs in each bin. In this case the required number of GC radial velocities per bin is larger because the uncertainties are . We require at least GCs per bin and this excludes smaller galaxies like NGC or NGC . As the calculation of does not take the GC radial velocity uncertainties into account, a bias might be present due to the different velocity resolution of the literature and of our GC samples. Results are presented in Figure 25.
We find that in the innermost bin most of the GC systems have and , suggesting isotropic or even tangential orbits. This is also true for kurtosis in the outer bin, but some galaxies (such as NGC , NGC and NGC ) have the tendency of having more radially-biased orbits. In all cases the kurtosis of the blue and red GCs are consistent with isotropic orbits.
10 Discussion
10.1 GC kinematic bimodality
The origin of GC colour bimodality is still an area of debate. On the theoretical side, there is a lack of consensus regarding the leading processes that drive the formation of GC systems (i.e. merging, collapse, accretion) and whether one (see Muratov & Gnedin, 2010) or more of these processes (e.g., Lee et al. 2010) are needed to explain the observed colour bimodality. The contrasting numerical predictions are in part due to the diverse recipes with which simulations were built (Bekki et al., 2005, 2008; Moore et al., 2006; Kravtsov & Gnedin, 2005; Diemand et al., 2005), but they might also reflect a real diversity of formation mechanisms that built up the GC systems in the first place.
On the observational side, the GC colour bimodality has been generally accepted because the two colour subpopulations differ in mean size and spatial distribution, and they depend differently on host galaxy properties (Forbes et al., 1997; Peng et al., 2006). Recently, the colour bimodality itself has been claimed to be an artifact of a strongly non-linear colour-metallicity relation (Yoon et al., 2006; Yoon et al., 2011), which would make the metallicity distribution of a GC system unimodal, skewed towards metal-poor metallicities. The resulting metallicity distribution function would be more metal-rich than the one classically obtained with linear, or broken linear, colour-metallicity relations (Peng et al., 2006; Faifer et al., 2011; Sinnott et al., 2010; Alves-Brito et al., 2011).
We have found that GC systems around most of the surveyed galaxies have different kinematics between the blue and red sides of their GC colour distribution. This includes different kinematic position angle, rotation amplitudes and velocity dispersions. The kinematics generally change smoothly with the GC colour, but we also observe cases in which there is a sharp kinematic transition corresponding to the blue-red dividing colour (see NGC , NGC and NGC in Figure 13). Our kinematic results are therefore strong evidence against colour bimodality simply being a consequence of a strong non-linear colour-metallicity relation.
Most of the surveyed galaxies have small, yet significant, blue/red kinematic diversity (especially in their velocity dispersion profiles). The fact that we do not see any sharp kinematic transition with colour in all galaxies is not surprising because these systems lack intrinsic rotation of both GC subpopulations. Therefore, the rotation amplitude of GC systems can be insensitive for testing kinematic bimodality, especially for massive galaxies, for which one has instead to rely on other proxies such as the slope of the profile (Figure 24).
10.2 The star-GC system connection
Although the link between the red GCs and the host galaxy was somewhat expected from their similar spatial distributions, its kinematic confirmation was limited to a handful of galaxies (Schuberth et al., 2010; Norris et al., 2012; Romanowsky et al., 2009; Strader et al., 2011). The results that we found for our galaxy sample are diverse in this regard.
On one side we find excellent agreement between the kinematics of the stars (and/or PNe) and that of the red GCs, indicating that the coupling between stars and GC systems holds also for less massive galaxies. On the other hand, we have also found galaxies in which the blue GCs behave as the galaxy stars or, more interestingly, as the PNe. NGC and NGC are two examples. These are very similar field disk galaxies with a falling stellar rotation curve. However, the blue GCs in NGC do not rotate and are decoupled from the PNe. Conversely, in NGC blue GCs mimic the minor axis rotation of the PNe, but not of the stars. What is most surprising in the latter case is indeed the fact that the PNe are decoupled from the stars as well. Based on stellar population inferences, Proctor et al. (2005) concluded that NGC has undergone a minor merger or tidal interaction in the last Gyr. Our results would support this scenario. However, it remains to be explained why the PNe are not akin to the underlying stars and how this feature can influence the dark matter estimate of this galaxy (Romanowsky et al., 2003).
How the star-GC system connection arose in the early times is still an open debate. Galaxy mergers may contribute to building the GC system of the remnant. Bekki et al. (2002) have shown that tidal shocks induced by galaxy merging can compress giant molecular clouds to form both new metal-rich GCs and stars. However, based on stellar population studies, Forbes et al. (2007) have shown that most of the red GCs are consistent with being uniformly old, and few, if any, formed in late epoch gaseous mergers.
A possible consensus scenario may arise from the idea that part of the red GCs might have formed during the early turbulent phases of galaxy formation at (Kravtsov & Gnedin, 2005; Shapiro et al., 2010). At this redshift, galaxies are characterised by fast rotating thick discs (Elmegreen et al., 2009) fragmented into super-star forming clumps. Observations have shown that the origin of these clumps is related to disc instability processes (Wisnioski et al., 2011), but they may be also caused by cold flows (Dekel et al., 2009). It is thought that these gas-rich clumps migrate inwards to feed the nascent bulge (dragging along newly formed metal-rich GCs) and losing their rotational motion to dynamical friction, finally acquiring a typical for the bulge. During this migration, of the clump mass will be stripped off and it will end up forming a rotationally supported disk (Bournaud et al., 2007).
This formation mechanism seems to qualitatively explain the spatial and kinematic similarity between stars and red GCs. However, as far as we know, no numerical simulations have to date been produced to directly compare observations with the kinematics of the red GCs forming during the ‘gas-rich clump-driven phase’. Also, the study of dwarf ellipticals in the Virgo cluster (Beasley et al., 2009) and in the Sculptor group (Olsen et al., 2004) suggested that disks may have been significant sites of GC formation at early times.
The poor radial overlap between studies of galaxy stars and GC systems complicates the kinematic comparison between these two. Extended stellar kinematic studies, a la Proctor et al. (2009), will help to test the galaxy star-GC system connection. Also, it will be interesting to see what is the role of the PNe in this scenario and if the PNe-GCs connection in NGC is the rule rather than the exception.
10.3 Orbital anisotropy
The GC orbital anisotropy, in this context represented by the kurtosis , can provide other clues about the formation of GC bimodality. Theoretical studies predict that dark matter haloes, including the baryonic tracers within them, have radially-biased orbits in their outer regions (McMillan et al., 2007; Prieto & Gnedin, 2008; Dekel et al., 2005). However, the small number of studies in this field, which have usually employed deep integrated stellar light and PNe, seems to suggest that early-type galaxies harbour quasi-isotropic orbits (Gerhard et al., 1998; Douglas et al., 2007; de Lorenzi et al., 2009; Napolitano et al., 2009; Napolitano et al., 2011; Deason et al., 2011). How does this compare to the GC anisotropy?
Our analysis suggest that in the inner regions both GC subpopulations have isotropic or tangential orbits, whereas in the outer regions there is a hint that some red GC systems might have radial orbits. We recognise that in both cases the GC orbits are still consistent with being isotropic.
As already pointed out by Romanowsky et al. (2009), the lack of radially-biased orbits for the blue GC subpopulation might be connected to the evolutionary history of the GC system within the galaxy. Processes such as evaporation, dynamical friction and the consequent disruption of GCs may change the anisotropy. The disruption of GCs will be more efficient for those on radial orbits because they plunge deepest into the galaxy centre (Baumgardt, 1998; Baumgardt & Makino, 2003). Accordingly, they will become less luminous and eventually vanish altogether, making GCs on tangential and isotropic orbits the most likely ones to survive and be observed today.
The GC orbital anisotropy will need further in-depth investigation but the overall pattern suggests that, if the blue GCs formed from the accretion or minor merger of satellite galaxies, some disruption effects have to be taken into account to explain the general absence of blue GC on radially-biased orbits. The scenario discussed above supports the idea that present day blue GCs were brought into the host galaxy via accretion and/or minor mergers.
The key point here is that the different GC orbits mean that the resulting profiles will be shaped by the orbits themselves (the mass-anisotropy degeneracy). Tangential anisotropy, for example, could mimic the presence of dark matter, whereas radial anisotropy could deplete it. Interestingly, we find that the blue GC subpopulations with tangentially-biased orbits tend to have increasing profiles (suggesting a more dominant dark-matter halo), whereas the red GC subpopulation is consistent with having a decreasing profile and more radial orbits. It will be interesting to test how a classic Jeans analysis that makes use of the different GC anisotropies found in this paper compares with recent studies that do not require assumptions on the dark matter halo (Walker & Peñarrubia, 2011).
10.4 NGC 7457: a case study for the formation of S0s
GC systems have been exploited to study the unsolved conundrum of the formation of lenticular galaxies (Barr et al., 2007; Arnold et al., 2011). In fact, it is still not clear whether Ss are quenched spirals: the remnant of a gentle gas shut off process that would preserve the kinematic signature of the progenitor spiral (Byrd & Valtonen, 1990; Williams et al., 2010), or very disky ellipticals: the products of violent merging events (Bekki, 1998; Cretton et al., 2001) that would diminish the original disk-rotation. The observational differences between these two scenarios are minimal and it also depends upon the galaxy environment (Kormendy & Bender, 2012). Ss might still be rotationally supported if they form in uneven-mass galaxy mergers, with mass-ratio ratio between : and : (Bournaud et al., 2005).
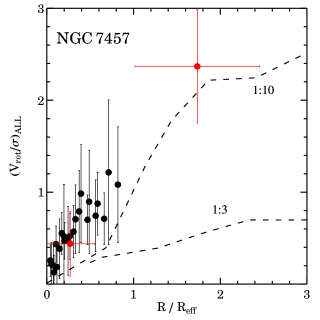
In this context, a particularly interesting case study is offered by NGC that we have discussed in §5.9. This nearby lenticular galaxy contains in fact both signatures of a recent merger (Chomiuk et al., 2008) and a disky GC kinematics with a possible counter-rotating core in the innermost regions (Sil’chenko et al., 2002). In Figure 26 we compare the profile of the stars (Simien & Prugniel, 2000) and of our GC measurements (including the dataset of Chomiuk) with N-body simulations of merging with different mass-ratios of 1:3 (Cretton et al., 2001) and 1:10 (Bournaud et al., 2005), respectively. To do this, we select all the GCs within arcmin from the photometric major axis and we construct two bins of objects each.
Results in Figure 26 show that our data are in good agreement with the : remnant, even though the discrepancies occurring at small and large radii seem to suggest that the mass-ratio involved in the formation of this galaxy was probably smaller than this value. These results, along with the counter-rotating core in the centre and the intermediate-age GCs, seem to favour the minor merger scenario. We also note that the S galaxies simulated in B are characterised by a strong rotation of the blue GC subpopulation if formed via merging, but we do not see any significant change of the GC kinematics with the GC colour in NGC . This effect could indeed be real, but it could also be driven by the low number statistics or by the large uncertainties ( mag) due to the conversion from HST to WIYN magnitudes.
11 Summary and Conclusions
We have examined the GC systems in twelve early-type galaxies (from lenticular to large ellipticals over a range of galaxy mass), nine of which published for the first time, with particular emphasis on the kinematics of their blue and red GC subpopulations.
For the new presented data, we have used wide-field ground-based imaging (mainly from Subaru/Suprime-cam) and HST observations, finding that eight out of nine galaxies have a significant bimodal GC colour distribution. The study of the spatial distribution of these two subpopulations has revealed that red GCs are generally more centrally concentrated and that they have a slope similar to the surface brightness of the underlying galaxy. This is in agreement with the idea that red and blue GC subpopulations trace the spheroidal component and the halo component of the host galaxies, respectively.
Multi-object spectroscopy was performed for a bright sample of GCs using Keck/DEIMOS that provided an average velocity resolution of (a factor of 3 better than most previous studies). We find a variety of kinematic profiles for both the blue and the red GC subpopulations. The salient results are:
-
1.
The GC kinematics (rotation amplitude, velocity dispersion and rotation axis) varies with GC mean colour. In particular, we find GC systems which have a sharp kinematic transition at the blue-red dividing colour, implying that the GC colour bimodality is real and extends to kinematic bimodality.
-
2.
The rotation velocity and velocity dispersion of the red GC subpopulation mimics the host galaxy stellar kinematics (including those of planetary nebulae). This property supports the scenario in which the red GCs form together with the bulk of stars of the host galaxy, for instance during the ‘turbulent disk phase’ at high redshift. The rotation of the blue GCs is typically consistent with zero, but their velocity dispersion is always higher or equal to that of the red GCs, especially in the outer regions.
-
3.
The GC kinematics combined with other kinematic studies can reveal interesting features. We have found that the blue GCs in NGC mimic the minor axis rotation of the PNe, but not that of the stars, suggesting that there might be a blue GC-PNe connection that trace a recent merging event. Also, our data seem to be consistent with the idea that the S galaxy NGC was formed via a minor merger with a : mass ratio.
We have supplemented our dataset with ten additional GC systems from the literature and compared their kinematics to host galaxy properties. We have compared our results with numerical simulations, finding no strong evidence that GC systems have formed via major-mergers. We find that the correlation between the of the GC systems and the mass of the host galaxy (from lenticular to massive ellipticals) holds for less massive galaxies and that it is tighter for the red GC subpopulation. The blue GCs in more massive galaxies have increasing profiles, whereas the red GCs have always shallower profiles. A study of the GC velocity kurtosis, suggests that blue GCs generally appear to be isotropic or tangentially-biased in the outer regions, unlike the red GCs which instead have more radially-biased orbits.
12 Acknowledgements
We thank the anonymous referee for the constructive feedback. AJB acknowledges the support of the Gordon & Betty Moore Foundation. CF acknowledges co-funding under the Marie Curie Actions of the European Commission (FP7-COFUND). KLR and JRH acknowledge support from NSF Career award AST- (PI: Rhode). This work was supported by the National Science Foundation through grants AST-, AST- and AST-. Some of the data presented herein were obtained at the W. M. Keck Observatory, operated as a scientific partnership among the California Institute of Technology, the University of California and the National Aeronautics and Space Administration, and made possible by the generous financial support of the W. M. Keck Foundation. The authors wish to recognise and acknowledge the very significant cultural role and reverence that the summit of Mauna Kea has always had within the indigenous Hawaiian community. The analysis pipeline used to reduce the DEIMOS data was developed at UC Berkeley with support from NSF grant AST-0071048. Based in part on data collected at Subaru Telescope and obtained from the SMOKA (which is operated by the Astronomy Data Centre, National Astronomical Observatory of Japan), via a Gemini Observatory time exchange. The authors acknowledge the data analysis facilities provided by IRAF, which is distributed by the National Optical Astronomy Observatories and operated by AURA, Inc., under cooperative agreement with the National Science Foundation. We have used the data products from the 2MASS, which is a joint project of the University of Massachusetts and the Infrared Processing and Analysis Centre/California Institute of Technology, funded by the National Aeronautics and Space Administration and the National Science Foundation. This research has made use of the NASA/IPAC Extragalactic Database (NED) which is operated by the Jet Propulsion Laboratory, California Institute of Technology, under contract with the National Aeronautics and Space Administration. The figures for this article have been created using the excellent LevelScheme scientific figure preparation system (Caprio, 2005).
References
- Abazajian et al. (2009) Abazajian K. N., Adelman-McCarthy J. K., Agüeros M. A., Allam S. S., Allende Prieto C., An D., Anderson K. S. J., Anderson S. F., Annis J., Bahcall N. A., et al. 2009, ApJS, 182, 543
- Alves-Brito et al. (2011) Alves-Brito A., Hau G. K. T., Forbes D. A., Spitler L. R., Strader J., Brodie J. P., Rhode K. L., 2011, MNRAS, 417, 1823
- Arnold et al. (2011) Arnold J. A., Romanowsky A. J., Brodie J. P., Chomiuk L., Spitler L. R., Strader J., Benson A. J., Forbes D. A., 2011, ApJ, 736, L26
- Ashman et al. (1994) Ashman K. M., Bird C. M., Zepf S. E., 1994, AJ, 108, 2348
- Ashman & Zepf (1992) Ashman K. M., Zepf S. E., 1992, ApJ, 384, 50
- Ashman & Zepf (1998) Ashman K. M., Zepf S. E., 1998, The Observatory, 118, 387
- Baba et al. (2002) Baba H., Yasuda N., Ichikawa S.-I., Yagi M., Iwamoto N., Takata T., Horaguchi T., Taga M., Watanabe M., Ozawa T., Hamabe M., 2002, in Bohlender D. A., Durand D., Handley T. H., eds, Astronomical Data Analysis Software and Systems XI Vol. 281 of Astronomical Society of the Pacific Conference Series, Development of the Subaru-Mitaka-Okayama-Kiso Archive System. p. 298
- Barr et al. (2007) Barr J. M., Bedregal A. G., Aragón-Salamanca A., Merrifield M. R., Bamford S. P., 2007, A&A, 470, 173
- Bassino et al. (2006) Bassino L. P., Richtler T., Dirsch B., 2006, MNRAS, 367, 156
- Baumgardt (1998) Baumgardt H., 1998, A&A, 330, 480
- Baumgardt & Makino (2003) Baumgardt H., Makino J., 2003, MNRAS, 340, 227
- Beasley et al. (2002) Beasley M. A., Baugh C. M., Forbes D. A., Sharples R. M., Frenk C. S., 2002, MNRAS, 333, 383
- Beasley et al. (2009) Beasley M. A., Cenarro A. J., Strader J., Brodie J. P., 2009, AJ, 137, 5146
- Beasley et al. (2004) Beasley M. A., Forbes D. A., Brodie J. P., Kissler-Patig M., 2004, MNRAS, 347, 1150
- Beasley et al. (2000) Beasley M. A., Sharples R. M., Bridges T. J., Hanes D. A., Zepf S. E., Ashman K. M., Geisler D., 2000, MNRAS, 318, 1249
- Bekki (1998) Bekki K., 1998, ApJ, 502, L133
- Bekki et al. (2005) Bekki K., Beasley M. A., Brodie J. P., Forbes D. A., 2005, MNRAS, 363, 1211
- Bekki et al. (2002) Bekki K., Forbes D. A., Beasley M. A., Couch W. J., 2002, MNRAS, 335, 1176
- Bekki & Peng (2006) Bekki K., Peng E. W., 2006, MNRAS, 370, 1737
- Bekki et al. (2008) Bekki K., Yahagi H., Nagashima M., Forbes D. A., 2008, MNRAS, 387, 1131
- Bender et al. (1994) Bender R., Saglia R. P., Gerhard O. E., 1994, MNRAS, 269, 785
- Bergond et al. (2006) Bergond G., Zepf S. E., Romanowsky A. J., Sharples R. M., Rhode K. L., 2006, A&A, 448, 155
- Bertola et al. (1993) Bertola F., Pizzella A., Persic M., Salucci P., 1993, ApJ, 416, L45
- Binney & Tremaine (2008) Binney J., Tremaine S., 2008, Galactic Dynamics: Second Edition. Princeton University Press
- Blakeslee et al. (2010) Blakeslee J. P., Cantiello M., Peng E. W., 2010, ApJ, 710, 51
- Blom et al. (2011) Blom C., Spitler L. R., Forbes D. A., 2011, MNRAS, p. 2118
- Bournaud et al. (2007) Bournaud F., Elmegreen B. G., Elmegreen D. M., 2007, ApJ, 670, 237
- Bournaud et al. (2005) Bournaud F., Jog C. J., Combes F., 2005, A&A, 437, 69
- Box (1971) Box M. J., 1971, Journal of the Royal Statistical Society. Series B (Methodological), 33, pp. 171
- Brodie & Larsen (2002) Brodie J. P., Larsen S. S., 2002, AJ, 124, 1410
- Brodie et al. (2011) Brodie J. P., Romanowsky A. J., Strader J., Forbes D. A., 2011, AJ, 142, 199
- Brodie & Strader (2006) Brodie J. P., Strader J., 2006, ARA&A, 44, 193
- Brodie et al. (2005) Brodie J. P., Strader J., Denicoló G., Beasley M. A., Cenarro A. J., Larsen S. S., Kuntschner H., Forbes D. A., 2005, AJ, 129, 2643
- Brough et al. (2006) Brough S., Forbes D. A., Kilborn V. A., Couch W., Colless M., 2006, MNRAS, 369, 1351
- Byrd & Valtonen (1990) Byrd G., Valtonen M., 1990, ApJ, 350, 89
- Cappellari et al. (2007) Cappellari M., Emsellem E., Bacon R., Bureau M., Davies R. L., de Zeeuw P. T., Falcón-Barroso J., Krajnović D., Kuntschner H., McDermid R. M., Peletier R. F., Sarzi M., van den Bosch R. C. E., van de Ven G., 2007, MNRAS, 379, 418
- Cappellari et al. (2011) Cappellari M., Emsellem E., Krajnović D., McDermid R. M., Scott N., Verdoes Kleijn G. A., Young L. M., Alatalo K., Bacon R., Blitz L., Bois M., Bournaud F., Bureau M., Davies R. L., 2011, MNRAS, 413, 813
- Caprio (2005) Caprio M., 2005, Computer Physics Communications, 171, 107
- Chies-Santos et al. (2011) Chies-Santos A. L., Larsen S. S., Kuntschner H., Anders P., Wehner E. M., Strader J., Brodie J. P., Santos J. F. C., 2011, A&A, 525, A20
- Chies-Santos et al. (2011) Chies-Santos A. L., Larsen S. S., Wehner E. M., Kuntschner H., Strader J., Brodie J. P., 2011, A&A, 525, A19
- Chies-Santos et al. (2006) Chies-Santos A. L., Pastoriza M. G., Santiago B. X., Forbes D. A., 2006, A&A, 455, 453
- Cho et al. (2012) Cho J., Sharples R. M., Blakeslee J. P., Zepf S. E., Kundu A., Kim H.-S., Yoon S.-J., 2012, ArXiv e-prints
- Chomiuk et al. (2008) Chomiuk L., Strader J., Brodie J. P., 2008, AJ, 136, 234
- Coccato et al. (2010) Coccato L., Gerhard O., Arnaboldi M., 2010, MNRAS, 407, L26
- Coccato et al. (2009) Coccato L., Gerhard O., Arnaboldi M., Das P., Douglas N. G., Kuijken K., Merrifield M. R., Napolitano N. R., Noordermeer E., Romanowsky A. J., Capaccioli M., Cortesi A., de Lorenzi F., Freeman K. C., 2009, MNRAS, 394, 1249
- Cohen et al. (1998) Cohen J. G., Blakeslee J. P., Ryzhov A., 1998, ApJ, 496, 808
- Cooper et al. (2012) Cooper M. C., Newman J. A., Davis M., Finkbeiner D. P., Gerke B. F., 2012, in Astrophysics Source Code Library, record ascl:1203.003 spec2d: DEEP2 DEIMOS Spectral Pipeline. p. 3003
- Côté (1999) Côté P., 1999, AJ, 118, 406
- Côté et al. (1998) Côté P., Marzke R. O., West M. J., 1998, ApJ, 501, 554
- Côté et al. (2003) Côté P., McLaughlin D. E., Cohen J. G., Blakeslee J. P., 2003, ApJ, 591, 850
- Côté et al. (2001) Côté P., McLaughlin D. E., Hanes D. A., Bridges T. J., Geisler D., Merritt D., Hesser J. E., Harris G. L. H., Lee M. G., 2001, ApJ, 559, 828
- Cretton et al. (2001) Cretton N., Naab T., Rix H.-W., Burkert A., 2001, ApJ, 554, 291
- da Costa et al. (1998) da Costa L. N., Willmer C. N. A., Pellegrini P. S., Chaves O. L., Rité C., Maia M. A. G., Geller M. J., Latham D. W., Kurtz M. J., Huchra J. P., Ramella M., Fairall A. P., Smith C., Lípari S., 1998, AJ, 116, 1
- Danese et al. (1980) Danese L., de Zotti G., di Tullio G., 1980, A&A, 82, 322
- Das et al. (2008) Das P., Gerhard O., Coccato L., Churazov E., Forman W., Finoguenov A., Böhringer H., Arnaboldi M., Capaccioli M., Cortesi A., de Lorenzi F., Douglas N. G., Freeman K. C., Kuijken K. a., 2008, Astronomische Nachrichten, 329, 940
- de Lorenzi et al. (2009) de Lorenzi F., Gerhard O., Coccato L., Arnaboldi M., Capaccioli M., Douglas N. G., Freeman K. C., Kuijken K., Merrifield M. R., Napolitano N. R., Noordermeer E., Romanowsky A. J., Debattista V. P., 2009, MNRAS, 395, 76
- de Vaucouleurs (1991) de Vaucouleurs G., 1991, Science, 254, 1667
- Deason et al. (2011) Deason A. J., Belokurov V., Evans N. W., 2011, MNRAS, 411, 1480
- Dekel et al. (2009) Dekel A., Birnboim Y., Engel G., Freundlich J., Goerdt T., Mumcuoglu M., Neistein E., Pichon C., Teyssier R., Zinger E., 2009, Nature, 457, 451
- Dekel et al. (2005) Dekel A., Stoehr F., Mamon G. A., Cox T. J., Novak G. S., Primack J. R., 2005, Nature, 437, 707
- Diemand et al. (2005) Diemand J., Madau P., Moore B., 2005, MNRAS, 364, 367
- Dirsch et al. (2003) Dirsch B., Richtler T., Geisler D., Forte J. C., Bassino L. P., Gieren W. P., 2003, AJ, 125, 1908
- Douglas et al. (2007) Douglas N. G., Napolitano N. R., Romanowsky A. J., Coccato L., Kuijken K., Merrifield M. R., Arnaboldi M., Gerhard O., Freeman K. C., Merrett H. R., Noordermeer E., Capaccioli M., 2007, ApJ, 664, 257
- Elmegreen et al. (2009) Elmegreen B. G., Elmegreen D. M., Fernandez M. X., Lemonias J. J., 2009, ApJ, 692, 12
- Elmegreen et al. (2012) Elmegreen B. G., Malhotra S., Rhoads J., 2012, ArXiv e-prints
- Emsellem et al. (2011) Emsellem E., Cappellari M., Krajnović D., Alatalo K., Blitz L., Bois M., Bournaud F., Bureau M., Davies R. L., Davis T. A., de Zeeuw P. T., 2011, MNRAS, 414, 888
- Emsellem et al. (2007) Emsellem E., Cappellari M., Krajnović D., van de Ven G., Bacon R., Bureau M., Davies R. L., de Zeeuw P. T., Falcón-Barroso J., Kuntschner H., McDermid R., Peletier R. F., Sarzi M., 2007, MNRAS, 379, 401
- Faber et al. (2003) Faber S. M., Phillips A. C., Kibrick R. I., Alcott B., Allen S. L., Burrous J., Cantrall T., Clarke D., Coil A. L., Cowley D. J., Davis 2003, in Iye M., Moorwood A. F. M., eds, Society of Photo-Optical Instrumentation Engineers (SPIE) Conference Series Vol. 4841 of Society of Photo-Optical Instrumentation Engineers (SPIE) Conference Series, The DEIMOS spectrograph for the Keck II Telescope: integration and testing. pp 1657–1669
- Faifer et al. (2011) Faifer F. R., Forte J. C., Norris M. A., Bridges T., Forbes D. A., Zepf S. E., Beasley M., Gebhardt K., Hanes D. A., Sharples R. M., 2011, MNRAS, 416, 155
- Feigelson & Babu (1992) Feigelson E. D., Babu G. J., 1992, ApJ, 397, 55
- Filippenko & Chornock (2000) Filippenko A. V., Chornock R., 2000, IAU Circ., 7511, 2
- Forbes et al. (2001) Forbes D. A., Beasley M. A., Brodie J. P., Kissler-Patig M., 2001, ApJ, 563, L143
- Forbes et al. (1997) Forbes D. A., Brodie J. P., Grillmair C. J., 1997, AJ, 113, 1652
- Forbes et al. (1996) Forbes D. A., Brodie J. P., Huchra J., 1996, AJ, 112, 2448
- Forbes et al. (1997) Forbes D. A., Brodie J. P., Huchra J., 1997, AJ, 113, 887
- Forbes et al. (1996) Forbes D. A., Franx M., Illingworth G. D., Carollo C. M., 1996, ApJ, 467, 126
- Forbes et al. (2012) Forbes D. A., Ponman T., O’Sullivan E., 2012, ArXiv e-prints
- Forbes et al. (2007) Forbes D. A., Proctor R., Strader J., Brodie J. P., 2007, ApJ, 659, 188
- Forbes et al. (2006) Forbes D. A., Sánchez-Blázquez P., Phan A. T. T., Brodie J. P., Strader J., Spitler L., 2006, MNRAS, 366, 1230
- Forbes et al. (2011) Forbes D. A., Spitler L. R., Strader J., Romanowsky A. J., Brodie J. P., Foster C., 2011, MNRAS, 413, 2943
- Forestell & Gebhardt (2010) Forestell A. D., Gebhardt K., 2010, ApJ, 716, 370
- Foster et al. (2009) Foster C., Proctor R. N., Forbes D. A., Spolaor M., Hopkins P. F., Brodie J. P., 2009, MNRAS, 400, 2135
- Foster et al. (2011) Foster C., Spitler L. R., Romanowsky A. J., Forbes D. A., Pota V., Bekki K., Strader J., Proctor R. N., Arnold J. A., Brodie J. P., 2011, MNRAS, 415, 3393
- Fried & Illingworth (1994) Fried J. W., Illingworth G. D., 1994, AJ, 107, 992
- Gallagher et al. (1977) Gallagher J. S., Knapp G. R., Faber S. M., Balick B., 1977, ApJ, 215, 463
- Gebhardt & Kissler-Patig (1999) Gebhardt K., Kissler-Patig M., 1999, AJ, 118, 1526
- Geisler et al. (1996) Geisler D., Lee M. G., Kim E., 1996, AJ, 111, 1529
- Gerhard et al. (1998) Gerhard O., Jeske G., Saglia R. P., Bender R., 1998, MNRAS, 295, 197
- Graham et al. (2005) Graham A. W., Driver S. P., Petrosian V., Conselice C. J., Bershady M. A., Crawford S. M., Goto T., 2005, AJ, 130, 1535
- Hargis et al. (2011) Hargis J. R., Rhode K. L., Strader J., Brodie J. P., 2011, ApJ, 738, 113
- Harris et al. (2007) Harris W. E., Harris G. L. H., Layden A. C., Wehner E. M. H., 2007, ApJ, 666, 903
- Hetznecker & Burkert (2006) Hetznecker H., Burkert A., 2006, MNRAS, 370, 1905
- Ho et al. (2001) Ho L. C., Feigelson E. D., Townsley L. K., Sambruna R. M., Garmire G. P., Brandt W. N., Filippenko A. V., Griffiths R. E., Ptak A. F., Sargent W. L. W., 2001, ApJ, 549, L51
- Hoffman et al. (2010) Hoffman L., Cox T. J., Dutta S., Hernquist L., 2010, ApJ, 723, 818
- Hopkins et al. (2010) Hopkins P. F., Bundy K., Croton D., Hernquist L., Keres D., Khochfar S., Stewart K., Wetzel A., Younger J. D., 2010, ApJ, 715, 202
- Hopkins et al. (2009) Hopkins P. F., Cox T. J., Dutta S. N., Hernquist L., Kormendy J., Lauer T. R., 2009, ApJS, 181, 135
- Hwang et al. (2008) Hwang H. S., Lee M. G., Park H. S., Kim S. C., Park J.-H., Sohn Y.-J., Lee S.-G., Rey S.-C., Lee Y.-W., Kim H.-I., 2008, ApJ, 674, 869
- Jarrett et al. (2003) Jarrett T. H., Chester T., Cutri R., Schneider S. E., Huchra J. P., 2003, AJ, 125, 525
- Joanes & Gill (1998) Joanes D., Gill C. A., 1998, The Statistician, 47, 183
- Jordán et al. (2005) Jordán A., Côté P., Blakeslee J. P., Ferrarese L., McLaughlin D. E., Mei S., Peng E. W., Tonry J. L., Merritt D., Milosavljević M., Sarazin C. L., Sivakoff G. R., West M. J., 2005, ApJ, 634, 1002
- Jordán et al. (2007) Jordán A., McLaughlin D. E., Côté P., Ferrarese L., Peng E. W., Mei S., Villegas D., Merritt D., Tonry J. L., West M. J., 2007, ApJS, 171, 101
- Kissler-Patig et al. (1998) Kissler-Patig M., Brodie J. P., Schroder L. L., Forbes D. A., Grillmair C. J., Huchra J. P., 1998, AJ, 115, 105
- Kissler-Patig et al. (1997) Kissler-Patig M., Richtler T., Storm J., della Valle M., 1997, A&A, 327, 503
- Kormendy & Bender (2012) Kormendy J., Bender R., 2012, ApJS, 198, 2
- Krajnović et al. (2011) Krajnović D., Emsellem E., Cappellari M., Alatalo K., Blitz L., Bois M., Bournaud F., Bureau M., Davies R. L., Davis T. A., de Zeeuw P. T., 2011, MNRAS, 414, 2923
- Kravtsov & Gnedin (2005) Kravtsov A. V., Gnedin O. Y., 2005, ApJ, 623, 650
- Kronawitter et al. (2000) Kronawitter A., Saglia R. P., Gerhard O., Bender R., 2000, A&AS, 144, 53
- Kundu & Whitmore (2001) Kundu A., Whitmore B. C., 2001, AJ, 122, 1251
- Larsen et al. (2003) Larsen S. S., Brodie J. P., Beasley M. A., Forbes D. A., Kissler-Patig M., Kuntschner H., Puzia T. H., 2003, ApJ, 585, 767
- Larsen et al. (2001) Larsen S. S., Brodie J. P., Huchra J. P., Forbes D. A., Grillmair C. J., 2001, AJ, 121, 2974
- Larsen et al. (2005) Larsen S. S., Brodie J. P., Strader J., 2005, A&A, 443, 413
- Lee et al. (2010) Lee M. G., Park H. S., Hwang H. S., Arimoto N., Tamura N., Onodera M., 2010, ApJ, 709, 1083
- Lee et al. (2008) Lee M. G., Park H. S., Kim E., Hwang H. S., Kim S. C., Geisler D., 2008, ApJ, 682, 135
- Masters et al. (2010) Masters K. L., Jordán A., Côté P., Ferrarese L., Blakeslee J. P., Infante L., Peng E. W., Mei S., West M. J., 2010, ApJ, 715, 1419
- McDermid et al. (2006) McDermid R. M., Emsellem E., Shapiro K. L., Bacon R., Bureau M., Cappellari M., Davies R. L., de Zeeuw T., Falcón-Barroso J., Krajnović D., Kuntschner H., Peletier R. F., Sarzi M., 2006, MNRAS, 373, 906
- McMillan et al. (2007) McMillan P. J., Athanassoula E., Dehnen W., 2007, MNRAS, 376, 1261
- Mei et al. (2007) Mei S., Blakeslee J. P., Côté P., Tonry J. L., West M. J., Ferrarese L., Jordán A., Peng E. W., Anthony A., Merritt D., 2007, ApJ, 655, 144
- Merrett et al. (2003) Merrett H. R., Kuijken K., Merrifield M. R., Romanowsky A. J., Douglas N. G., Napolitano N. R., Arnaboldi M., Capaccioli M., Freeman K. C., Gerhard O., Evans N. W., Wilkinson M. I., Halliday C., Bridges T. J., Carter D., 2003, MNRAS, 346, L62
- Mieske et al. (2006) Mieske S., Jordán A., Côté P., Kissler-Patig M., Peng E. W., Ferrarese L., Blakeslee J. P., Mei S., Merritt D., Tonry J. L., West M. J., 2006, ApJ, 653, 193
- Misgeld et al. (2011) Misgeld I., Mieske S., Hilker M., Richtler T., Georgiev I. Y., Schuberth Y., 2011, A&A, 531, A4
- Miyazaki et al. (2002) Miyazaki S., Komiyama Y., Sekiguchi M., Okamura S., Doi M., Furusawa H., Hamabe M., Imi K., Kimura M., Nakata F., Okada N., Ouchi M., Shimasaku K., Yagi M., Yasuda N., 2002, PASJ, 54, 833
- Moore et al. (2006) Moore B., Diemand J., Madau P., Zemp M., Stadel J., 2006, MNRAS, 368, 563
- Muratov & Gnedin (2010) Muratov A. L., Gnedin O. Y., 2010, ApJ, 718, 1266
- Nagar et al. (2005) Nagar N. M., Falcke H., Wilson A. S., 2005, A&A, 435, 521
- Napolitano et al. (2011) Napolitano N. R., Romanowsky A. J., Capaccioli M., Douglas N. G., Arnaboldi M., Coccato L., Gerhard O., Kuijken K., Merrifield M. R., Bamford S. P., Cortesi A., Das P., Freeman K. C., 2011, MNRAS, 411, 2035
- Napolitano et al. (2009) Napolitano N. R., Romanowsky A. J., Coccato L., Capaccioli M., Douglas N. G., Noordermeer E., Gerhard O., Arnaboldi M., de Lorenzi F., Kuijken K., Merrifield M. R., O’Sullivan E., Cortesi A., Das P., Freeman K. C., 2009, MNRAS, 393, 329
- Newman et al. (2012) Newman J. A., Cooper M. C., Davis M., Faber S. M., Coil A. L., Guhathakurta P., Koo D. C., Phillips A. C., Conroy C., Dutton A. A., Finkbeiner D. P., Gerke B. F., Rosario D. J., Weiner 2012, ArXiv e-prints
- Norris et al. (2012) Norris M. A., Gebhardt K., Sharples R. M., Faifer F. R., Bridges T., Forbes D. A., Forte J. C., Zepf S. E., Beasley M. A., Hanes D. A., Proctor R., Kannappan S. J., 2012, MNRAS, p. 2399
- Norris et al. (2008) Norris M. A., Sharples R. M., Bridges T., Gebhardt K., Forbes D. A., Proctor R., Faifer F. R., Forte J. C., Beasley M. A., Zepf S. E., Hanes D. A., 2008, MNRAS, 385, 40
- Olsen et al. (2004) Olsen K. A. G., Miller B. W., Suntzeff N. B., Schommer R. A., Bright J., 2004, AJ, 127, 2674
- Oser et al. (2010) Oser L., Ostriker J. P., Naab T., Johansson P. H., Burkert A., 2010, ApJ, 725, 2312
- Ostrov et al. (1993) Ostrov P., Geisler D., Forte J. C., 1993, AJ, 105, 1762
- O’Sullivan et al. (2001) O’Sullivan E., Forbes D. A., Ponman T. J., 2001, MNRAS, 328, 461
- Ouchi et al. (2004) Ouchi M., Shimasaku K., Okamura S., Furusawa H., Kashikawa N., Ota K., Doi M., Hamabe M., Kimura M., Komiyama Y., Miyazaki M., Miyazaki S., Nakata F., Sekiguchi M., Yagi M., Yasuda N., 2004, ApJ, 611, 660
- Pellegrini et al. (2007) Pellegrini S., Siemiginowska A., Fabbiano G., Elvis M., Greenhill L., Soria R., Baldi A., Kim D. W., 2007, ApJ, 667, 749
- Peng et al. (2006) Peng E. W., Jordán A., Côté P., Blakeslee J. P., Ferrarese L., Mei S., West M. J., Merritt D., Milosavljević M., Tonry J. L., 2006, ApJ, 639, 95
- Pierce et al. (2006) Pierce M., Beasley M. A., Forbes D. A., Bridges T., Gebhardt K., Faifer F. R., Forte J. C., Zepf S. E., Sharples R., Hanes D. A., Proctor R., 2006, MNRAS, 366, 1253
- Pinkney et al. (2003) Pinkney J., Gebhardt K., Bender R., Bower G., Dressler A., Faber S. M., Filippenko A. V., Green R., Ho L. C., Kormendy J., Lauer T. R., Magorrian J., Richstone D., Tremaine S., 2003, ApJ, 596, 903
- Prieto & Gnedin (2008) Prieto J. L., Gnedin O. Y., 2008, ApJ, 689, 919
- Proctor et al. (2005) Proctor R. N., Forbes D. A., Forestell A., Gebhardt K., 2005, MNRAS, 362, 857
- Proctor et al. (2009) Proctor R. N., Forbes D. A., Romanowsky A. J., Brodie J. P., Strader J., Spolaor M., Mendel J. T., Spitler L., 2009, MNRAS, 398, 91
- Prugniel & Simien (1996) Prugniel P., Simien F., 1996, A&A, 309, 749
- Puzia et al. (2004) Puzia T. H., Kissler-Patig M., Thomas D., Maraston C., Saglia R. P., Bender R., Richtler T., Goudfrooij P., Hempel M., 2004, A&A, 415, 123
- Rhode & Zepf (2001) Rhode K. L., Zepf S. E., 2001, AJ, 121, 210
- Rhode & Zepf (2004) Rhode K. L., Zepf S. E., 2004, AJ, 127, 302
- Romanowsky et al. (2003) Romanowsky A. J., Douglas N. G., Arnaboldi M., Kuijken K., Merrifield M. R., Napolitano N. R., Capaccioli M., Freeman K. C., 2003, Science, 301, 1696
- Romanowsky et al. (2011) Romanowsky A. J., Strader J., Brodie J. P., Mihos J. C., Spitler L. R., Forbes D. A., Foster C., Arnold J. A., 2011, ArXiv e-prints
- Romanowsky et al. (2009) Romanowsky A. J., Strader J., Spitler L. R., Johnson R., Brodie J. P., Forbes D. A., Ponman T., 2009, AJ, 137, 4956
- Sandage & Bedke (1994) Sandage A., Bedke J., 1994, The Carnegie Atlas of Galaxies. Volumes I, II.
- Schlegel et al. (1998) Schlegel D. J., Finkbeiner D. P., Davis M., 1998, ApJ, 500, 525
- Schroder et al. (2002) Schroder L. L., Brodie J. P., Kissler-Patig M., Huchra J. P., Phillips A. C., 2002, AJ, 123, 2473
- Schuberth et al. (2010) Schuberth Y., Richtler T., Hilker M., Dirsch B., Bassino L. P., Romanowsky A. J., Infante L., 2010, A&A, 513, A52
- Sérsic (1963) Sérsic J. L., 1963, Boletin de la Asociacion Argentina de Astronomia La Plata Argentina, 6, 41
- Shapiro et al. (2010) Shapiro K. L., Genzel R., Förster Schreiber N. M., 2010, MNRAS, 403, L36
- Sil’chenko et al. (2002) Sil’chenko O. K., Afanasiev V. L., Chavushyan V. H., Valdes J. R., 2002, ApJ, 577, 668
- Simien & Prugniel (2000) Simien F., Prugniel P., 2000, A&AS, 145, 263
- Sinnott et al. (2010) Sinnott B., Hou A., Anderson R., Harris W. E., Woodley K. A., 2010, AJ, 140, 2101
- Skrutskie et al. (2006) Skrutskie M. F., Cutri R. M., Stiening R., Weinberg M. D., Schneider S., Carpenter J. M., Beichman C., Capps R., Chester T., Elias 2006, AJ, 131, 1163
- Spitler et al. (2008) Spitler L. R., Forbes D. A., Strader J., Brodie J. P., Gallagher J. S., 2008, MNRAS, 385, 361
- Spitler et al. (2006) Spitler L. R., Larsen S. S., Strader J., Brodie J. P., Forbes D. A., Beasley M. A., 2006, AJ, 132, 1593
- Spitler et al. (2012) Spitler L. R., Romanowsky A. J., Diemand J., Strader J., Forbes D. A., Moore B., Brodie J. P., 2012, MNRAS, p. 2978
- Spolaor et al. (2008) Spolaor M., Forbes D. A., Hau G. K. T., Proctor R. N., Brough S., 2008, MNRAS, 385, 667
- Spolaor et al. (2008) Spolaor M., Forbes D. A., Proctor R. N., Hau G. K. T., Brough S., 2008, MNRAS, 385, 675
- Strader et al. (2005) Strader J., Brodie J. P., Cenarro A. J., Beasley M. A., Forbes D. A., 2005, AJ, 130, 1315
- Strader et al. (2006) Strader J., Brodie J. P., Spitler L., Beasley M. A., 2006, AJ, 132, 2333
- Strader et al. (2011) Strader J., Romanowsky A. J., Brodie J. P., Spitler L. R., Beasley M. A., Arnold J. A., Tamura N., Sharples R. M., Arimoto N., 2011, ApJS, 197, 33
- Tamura et al. (2006) Tamura N., Sharples R. M., Arimoto N., Onodera M., Ohta K., Yamada Y., 2006, MNRAS, 373, 601
- Teodorescu et al. (2010) Teodorescu A. M., Méndez R. H., Bernardi F., Riffeser A., Kudritzki R. P., 2010, ApJ, 721, 369
- Tomita et al. (2000) Tomita A., Aoki K., Watanabe M., Takata T., Ichikawa S.-i., 2000, AJ, 120, 123
- Tonry & Davis (1979) Tonry J., Davis M., 1979, AJ, 84, 1511
- Tonry et al. (2001) Tonry J. L., Dressler A., Blakeslee J. P., Ajhar E. A., Fletcher A. B., Luppino G. A., Metzger M. R., Moore C. B., 2001, ApJ, 546, 681
- van der Marel & Franx (1993) van der Marel R. P., Franx M., 1993, ApJ, 407, 525
- Vesperini et al. (2003) Vesperini E., Zepf S. E., Kundu A., Ashman K. M., 2003, ApJ, 593, 760
- Vitvitska et al. (2002) Vitvitska M., Klypin A. A., Kravtsov A. V., Wechsler R. H., Primack J. R., Bullock J. S., 2002, ApJ, 581, 799
- Walker & Peñarrubia (2011) Walker M. G., Peñarrubia J., 2011, ApJ, 742, 20
- Weijmans et al. (2009) Weijmans A.-M., Cappellari M., Bacon R., de Zeeuw P. T., Emsellem E., Falcón-Barroso J., Kuntschner H., McDermid R. M., van den Bosch R. C. E., van de Ven G., 2009, MNRAS, 398, 561
- Weil & Pudritz (2001) Weil M. L., Pudritz R. E., 2001, ApJ, 556, 164
- Whitmore et al. (1995) Whitmore B. C., Sparks W. B., Lucas R. A., Macchetto F. D., Biretta J. A., 1995, ApJ, 454, L73
- Williams et al. (2010) Williams M. J., Bureau M., Cappellari M., 2010, MNRAS, 409, 1330
- Wisnioski et al. (2011) Wisnioski E., Glazebrook K., Blake C., Wyder T., Martin C., Poole G. B., Sharp R., Couch W., Kacprzak G. G., Brough S., Colless M., Contreras C., 2011, MNRAS, 417, 2601
- Woodley et al. (2010) Woodley K. A., Gómez M., Harris W. E., Geisler D., Harris G. L. H., 2010, AJ, 139, 1871
- Yoon et al. (2011) Yoon S.-J., Lee S.-Y., Blakeslee J. P., Peng E. W., Sohn S. T., Cho J., Kim H.-S., Chung C., 2011, ApJ, 743, 150
- Yoon et al. (2011) Yoon S.-J., Sohn S. T., Lee S.-Y., Kim H.-S., Cho J., Chung C., Blakeslee J. P., 2011, ApJ, 743, 149
- Yoon et al. (2006) Yoon S.-J., Yi S. K., Lee Y.-W., 2006, Science, 311, 1129
- Younes et al. (2010) Younes G., Porquet D., Sabra B., Grosso N., Reeves J. N., Allen M. G., 2010, A&A, 517, A33
- Zepf & Ashman (1993) Zepf S. E., Ashman K. M., 1993, MNRAS, 264, 611
- Zhang et al. (2007) Zhang Z., Xu H., Wang Y., An T., Xu Y., Wu X.-P., 2007, ApJ, 656, 805
Appendix A Velocity bias correction
A feature of the kinematic modelling used in this work (equation 4) is that the rotation amplitude is biased to higher values when the kinematic position angle is unconstrained. This effect becomes important in systems with , because the rotation (and its direction) is fully embedded in the dispersion. There are two ways to approach this issue: numerically, via a Monte Carlo simulation, or analytically, using the Box’s bias measure in non-linear model theory (Box, 1971). The first method is the most straightforward, whereas the latter is computationally more complicated. Here we adopt a similar approach to Strader et al. (2011) and correct for the bias via a Monte Carlo simulation.
In practice, for each data bin containing GCs (see Figure 11), we compute the best fit rotation by minimizing equation 3. We then generate artificial datasets, of the same size , drawn from the best-fit model. We repeat the fit for each generated dataset using the original best-fit model as starting point. We define the velocity bias as the median difference between the computed and the simulated (known) rotation amplitude. This approach is adopted to correct for the bias also in Figure 13, Table 6 and Table 7.
We find that the magnitude of the bias correction depends both on the bin size and on the . In the case of , the bias is negligible regardless the bin size. For bins with and , the bias can be up to . Within the same values, the bias can decrease down to for . This agrees with the rule of the thumb of Strader et al. (2011) to identify the severity of the bias, i.e. the bias is small if . If this condition is satisfied, we find that the bias is of the order of (or less then) our nominal median uncertainty of 15 km s-1.