The journey of hydrogen to quantized vortex cores
Abstract
Nanoscale hydrogen particles in superfluid helium track the motions of quantized vortices. This provides a way to visualize turbulence in the superfluid. Here, we trace the evolution of the hydrogen from a gas to frozen particles migrating toward the cores of quantized vortices. Not only are the intervening processes interesting in their own right, but understanding them better leads to more revealing experiments.
pacs:
68.43.JkI Introduction
What makes liquid helium particularly useful for studies of fluid dynamics and turbulence is its small viscosity Skrbek (2004); Niemela and Sreenivasan (2006). Another interesting aspect of liquid helium is that in the superfluid phase circulation is quantized, and turbulence arises in it through the formation and interaction of quantized vortices Feynman (1955). The superfluid is present in liquid helium-4 at temperatures between 0 K and Tλ, where T 2.17 K when the liquid and vapor coexist Donnelly (1991).
The strides made in understanding classical turbulence have not been matched in quantum turbulence. Challenges lie in both the theoretical description of the fluid motions and in the acquisition and interpretation of experimental data Vinen and Niemela (2002). In an effort to surmount the latter hurdle, one of the authors (GB) developed a novel hydrogen-particle technique for visualizing the internal motions of superfluid helium. The technique involves the generation of the particles in situ, and sequential recording of their positions Bewley (2009).
What experimenters observe is the following. Nanoscale hydrogen particles appear in liquid helium close to its boiling point, after injection of a mixture of hydrogen and helium gas through a small tube. When the temperature is lower than Tλ, the particles gravitate toward quantized vortex cores. The entrapment does not occur when the temperature is close to Tλ, but only at significantly lower temperatures Bewley (2006).
The motions of quantized vortices become visible because particles become trapped on their cores Parks and Donnelly (1966). Once they are visible, it is possible to observe the vortex lattice in rotating helium Bewley et al. (2006), vortex reconnection Bewley et al. (2008), and vortex ring decay Bewley and Sreenivasan (2009). An increasing number of laboratories around the world are employing similar techniques. They do so for technological reasons, such as for the generation of nano-wires Gordon et al. (2012), but above all to study the fluid dynamics of helium.
Since the technique is employed in many ways, it makes sense to better understand it. The self-organization of hydrogen onto quantized vortices involves non-equilibrium processes occurring on many length scales. These start from the microscopic physics of demixing and freezing that produce the particles, to the mixing of the particles into the liquid and the migration of the particles toward the cores of vortices, to the macroscopic turbulent motions of the helium itself. This paper proposes descriptions for each process. These should be understood to be conjectural, as we have not tested the ideas experimentally.
Specifically, we set out to explain how the hydrogen particles form, how they end up in the liquid rather than the gas phase of helium, and why vortices do not entrap them when the temperature is close to Tλ. In Sec. II.1, we describe the experimental apparatus. In Sec. II.2, we survey briefly recent work that exploits particle-imaging to study superfluid helium dynamics. In Sec. III.1, we describe the phase transitions that produce hydrogen particles, and in Sec. III.2 the process dispersing the particles in the liquid helium. In Sec. III.3, we argue that thermodynamics does not limit the trapping of particles unless the temperature is very close to Tλ, and in Sec. III.4 we argue that particle dynamics, rather than thermodynamics, limit the ability to visualize vortices. Finally, in Sec. IV we comment on these interpretations.
II Hydrogen particle generation revisited
II.1 Experimental setup
La Mantia et al. (2012) and Bewley (2009) describe the relevant experimental apparatus, which we briefly review here. Hydrogen particles are created from a room temperature mixture of hydrogen gas diluted with helium. The method works also with other gases, such as deuterium, in place of hydrogen. The hydrogen-helium mixture ratio controls the size of the particles, the size increasing with the ratio of hydrogen to helium. Mixture ratios of the order of 1 : 100 He by volume produce particles about 1 m in diameter. The mixture is released into liquid helium through valves that control the injection rate and duration. For a 600 mL volume of liquid helium in a cryostat, 20 mg of the mixture injected over a period of 5 s yields a final particle volume fraction about times smaller than the total volume, which corresponds to a few million particles per cm3. The gas mixture passes through a tube that opens somewhere beneath the free surface of the helium, so that the mixture bubbles through the liquid.
II.2 Recent history
We cite a few papers to give an impression of the field’s breadth. Paoletti et al. (2008) shows that the distribution of particle velocities in superfluid helium is non-Gaussian, in contrast to the near Gaussian statistics of particle motions in classical flows. Chagovets and Van Sciver (2011) measures in a counterflow the heat flux required to dislodge hydrogen particles from vortices. Jin and Maris (2011) describes some interesting behavior of dust particles in superfluid helium, and La Mantia et al. (2012) confirms that hydrogen particle velocities equal the normal fluid velocity at low heat fluxes. Fuzier et al. (2008) shows that superfluid helium can be used to segregate particles by size. Guo et al. (2009) images electron bubbles and speculates that this technique could be used to track quantized vortices. Metastable helium molecules can also be tracked, an approach employed by Guo et al. (2010) to measure the velocity profile of superfluid helium in a channel. Gordon et al. (2012) discusses the role of vortices in the generation of metallic nanocrystals and nanowires in superfluid helium. Taken together, the collected works indicate that under some conditions, such as in weak counterflows, quantized vortices trap particles on their cores, while in other conditions, the particle-vortex interactions yield more complicated behavior. At low particle number densities and when the particles are trapped, the particle motions reveal that vortex reconnection is a self-similar process Bewley et al. (2008), while at high number densities, networks are formed where crossing vortices stick rather than reconnect Bewley et al. (2006).
The behavior of particles in superfluid helium and in particular the interaction between particles and quantized vortices have been the subject of many numerical and theoretical investigations. Notable examples include Poole et al.’s (2005) discussion of the motions of particles in the context of the equations of particle motion. Fujiyama et al. (2007) demonstrates the pinning of quantized vortices by solid spheres, an interaction explored further by Kivotides et al. (2008). Barenghi and Sergeev (2009) and Bewley and Sreenivasan (2009) consider the influence of bound particles on quantized vortex dynamics. This work inspired interpretations of experimental observations. It also argued that particles are trapped when the relative velocity between the normal fluid and the quantized vortex is not too large, and that the process of particle trapping by a quantized vortex curves the vortex core and causes Kelvin waves along the core. Once trapped, the particles increase the strength of the coupling between the quantized vortices and the normal fluid.
III Physical Mechanisms
No one has yet found a way to observe particle formation directly. In the following, we lay out our personal view of the underlying mechanisms, which involve physical problems worth studying in their own right.
III.1 Particle generation
In a typical hydrogen particle generation experiment, gas is injected at a rate of g/s through a pipe with a diameter of about 0.15 cm. Given the mass density, g/cm3, this amounts to a flow velocity of 14 cm/s. For a 1 m tall cryostat, the gas takes about 7 s to exit the tube into the liquid helium bath. As it descends through the injector into the cryostat, the mixture of hydrogen and helium gas has a higher temperature than the ambient helium bath. The generation of particles should therefore be understood as a problem of cooling predominantly helium gas bubbles that cool until hydrogen condenses. In such a setting, we expect that the initial hydrogen particles are created by homogeneous nucleation Doremus (1985). This process occurs in analogous binary fluids cooled into the miscibility gap Vollmer et al. (2007); Lapp et al. (2012). At the low temperatures of helium, quantum tunneling may promote crystallization of the hydrogen Levi and Mazzarello (2001).
Specifically, the hydrogen starts as a warm gas strongly diluted by helium. After injection, the gas mixture bubbles cool as they rise through the liquid helium. The melting and boiling temperatures of hydrogen at the relevant pressures (e.g. 14 K and 22 K at 1 bar) exceed the boiling point of helium (4.2 K at 1 bar), so that the hydrogen condenses out of the mixture even while the helium fraction remains gaseous. Cooling proceeds even after particle nucleation. In this way, the condensation is similar to the formation and growth of rain droplets in orographic rain formation, where clouds cools slowly due to adiabatic expansion (e.g. Shaw, 2003), to the formation of droplets in laboratory experiments where binary fluid mixtures are slowly pushed into a phase coexistence region by an applied temperature drift Vollmer et al. (2007); Lapp et al. (2012), and to the formation of slow dust in Enceladus’ plume from the condensation of water Schmidt et al. (2008). Understanding of phase separation in such settings is presently a subject of active research due to the importance of clouds in climate dynamics Bodenschatz et al. (2010); Pierrehumbert (2010). Based on the studies of phase separation in the presence of a temperature drift, we expect a wide distribution of particle sizes (e.g. Lapp et al., 2012). The distribution results from the interplay of growth and ripening Lifshitz and Slyozov (1961); Wagner (1961); Slezov (2009).
III.2 Deposition of the particles into the liquid
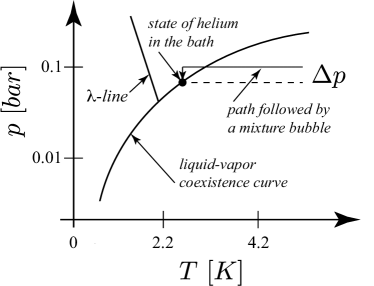
From the analogy with boiling water, one might expect that the bubbles would grow in size and then break through the liquid helium surface, dispersing the hydrogen particles in the gaseous phase of helium. However, a bubble is not stable in a liquid with a free surface, due to the high free energy associated with the surface tension. In experiments, bubbles grow smaller at a rate that is limited by how quickly the heat of the bubble can be transferred from it to the surrounding liquid. This occurs even if the system is on the liquid-vapor coexistence curve.
The bubbles cool at approximately constant ambient pressure, as illustrated in Fig. 1, due to the low density of liquid helium. One must consider six contributions to the heat of the bubble. These are due to the temperature differences between the surrounding helium and the hydrogen and helium in the bubble, the heat of condensation and of freezing of the hydrogen, the heat of condensation of the helium, and the heat released as the surface area of the bubble decreases.
The key point is that each contribution to the free energy of the bubble constitutes an amount of heat that must be transferred to the surrounding liquid Chaikin and Lubensky (2000). The rate at which the bubble collapses is determined by the rate at which this heat can be carried away from the bubble by diffusion or convection. Initially, the mass of the bubble will increase due to this heat transfer, because some of the surrounding helium will evaporate into the bubble. Eventually, however, the temperature of the bubble is low enough that it condenses. Here, we consider each contribution in turn.
The heat due to the initial warmth of the droplets is
where kg/m3, m2/sK, and K, are the gas density, its heat capacity and a conservative estimate of the initial temperature difference, respectively.
The latent heat of the phase transitions include those from the fluidization and solidification of hydrogen, and from the fluidization of the helium in the bubble. They are J/kg, J/kg, and J/kg, respectively. For the cooling of the bubbles they give rise to the contributions
where , and denote the material constants for the respective materials and transitions; in particular, is the mass fraction of hydrogen in the droplets. It is so small that for the helium. The latent heat released upon going through these phase changes, , accounts for about half of the total heat, , to be released from the droplets.
The bubbles collapse when, upon rising, they dissipate the excess heat into the fluid helium bath before they reach the interface to the macroscopic gas phase. Note that the heat from the temperature mismatch of the bubbles exceeds the contribution from the surface energy by five orders of magnitude, such that the latter may be neglected.
We estimate how long it takes for the bubble to collapse by comparing to the experimental observations of Maris et al. (1987) and to the numerical study of Unlusu et al. (2008). Both studies treated pure hydrogen droplets in a liquid helium bath. Maris et al. (1987, see their Fig. 3) observed that the temperature of droplets equilibriated in about seconds. Unlusu et al. (2008) found that the droplets released their heat in a few seconds. We must bear in mind that the heat content of the hydrogen droplets is more than times that of helium bubbles, due to the very high heat of solidification of the hydrogen. Our mixtures of He and H2 will therefore cool faster.
How long does it take for the bubbles to reach the free surface in the cryostat, setting aside any changes in size? Due to the low viscosity of liquid helium, the bubbles generate a turbulent wake upon rising. The resulting rising velocity is approximately
One can check that the assumption of a turbulent wake is justified. Given the density, kg/m3, and the viscosity, Kg/m s, of liquid helium, the rising bubble has a Reynolds number Re , which lies well in the turbulent regime. Consequently, when they are released at a depth of about ten centimeters, the bubbles need seconds to rise to the surface. This is considerably longer than the time needed for the heat content of the bubbles to be carried away.
We conclude that the helium bubbles condense and release their hydrogen particles to the liquid helium before they reach the top of the liquid helium column. According to Silvera (1984), the hydrogen particles have no difficulty crossing the liquid-gas interface of helium, so that they will move to the liquid phase continuously as the bubbles shrink, rather than being caked into a single large aggregate before release. Hence, we observe a much larger number of small hydrogen clusters than the number of bubbles released into the cryostat.
 |
III.3 Thermodynamics of particle trapping
We have already observed experimentally that quantized vortices trap hydrogen particles only when the temperature of the helium is sufficiently far below Tλ. We now show that thermodynamics does not explain this link. The strength of the interaction between quantized vortices and particles is proportional to the mass density of the superfluid part of the helium, which rises sharply from zero as temperatures fall below the phase transition temperature. However, for some range of temperatures immediately below Tλ, the interaction is still negligible relative to the thermal energy, T, so that particles reside on the vortex cores only accidentally. It follows that as the temperature falls, the transition between free particles and trapped particles occurs later than the transition from normal to superfluid helium.
In the absence of other effects, such as macroscopic flows, the nature of the trapping transition can be determined with a lattice model where the lattice constant amounts to the characteristic size of the hydrogen particles. In this context, we say that vortices run through a fraction of the lattice sites, such that there are sites occupied by vortices, and sites making up the fluid bulk, where is the total number of sites in the lattice. In the Appendix, we show that the fraction of particles on vortices is then
| (1) |
where is the volume fraction of particles, T, and is the change in the system energy due to the trapping of a single particle on a vortex (which is negative). The factor contains the most important temperature dependence, which is that due to the rapid change in density of the superfluid part near Tλ (e.g. Tam and Ahlers, 1987). It can be seen in Fig. 2 that according to this model, the vortices saturate with particles at temperatures only 50 K below Tλ. Because experimentally we observe little particle entrapment up to 20 mK below Tλ, it follows that the ability to track vortices is not limited by thermodynamic considerations. Instead, it is dominated by the dynamics of particle trapping.
III.4 Dynamics of particle trapping
At temperatures far enough below the phase-transition temperature, quantized vortices begin to gather particles on their cores Parks and Donnelly (1966); Bewley et al. (2006), provided the relative velocity between the quantized vortices and the normal fluid is not too high Chagovets and Van Sciver (2011). We estimate here the time required for a newly-formed length of quantized vortex to collect enough particles to make it visible.
Consider a stationary vortex that extends through a fluid filled with initially stationary particles, whose total volume fraction relative to the fluid is , and whose characteristic diamter is . The distance between particles in the fluid is then typically . At a large distance from the core, the force exerted by the vortex on the particle is approximately , where is the pressure, is the density of the superfluid, cm2/s is the circulation of the vortex, is Planck’s constant, and is the mass of a helium-4 atom. Let the vortex be considered marked when all particles within this distance from the vortex centerline have reached the core. It can be readily confirmed that this corresponds to a core with particles every 20 diameters, for a typical particle volume fraction of 10-5. If the particle’s inertia is small, we can balance the vortex pressure gradient force by the drag force along its whole trajectory. In this picture, the particles are drawn toward the core by the superfluid pressure field, but are damped by their motion relative to the stationary, viscous normal fluid. The drag force for small particles was given by Stokes as , where is the viscosity of the normal fluid and is the velocity of the particle relative to the normal fluid Batchelor (1967). The velocity, , is induced by the pressure gradient such that . Altogether, the time scale for marking is given by integrating the velocity from a distance to the vortex core,
| (2) |
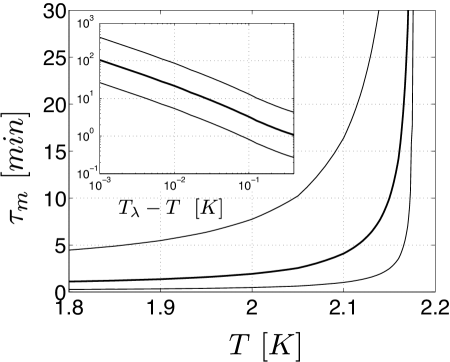
The time scale is temperature dependent through the material properties, and particularly through , which rises from zero for temperatures decreasing from the phase transition temperature, Tλ. Figure 3 shows the dependence of on temperature for values of and typical in an experiment. The sharp decrease in the trapping time as the temperature decreases may explain the observation that marked vortices typically do not appear within about 20 mK of the phase transition temperature. That is, they might become visible if the experimenter waited long enough.
IV Discussion and Conclusion
The journey of hydrogen from a molecular gas to crystallites that are trapped on quantized vortices encompasses a hierarchy of problems on many length scales. Novel problems arise in applied mathematics through the analysis of nonlinear evolution equations, in non-equlibrium statistical physics through the condensation of hydrogen and the collapse of bubbles, and in fluid dynamics through the mixing of particles into a fluid, the trapping of particles onto vortices, and the turbulent motions of the vortices. These challenges call for a combined effort from experimentalists and computational physicists to provide data, and from theoreticians to identify approaches and questions.
In this spirit of providing guidance for future experiments, where efficient particle generation is desired or where manipulation of the particle sizes and densities are necessary, we make the following propositions. There should be many small injectors, which produce small bubbles that disappear quickly. The injectors should be as far below the surface of the liquid helium as is possible, and the injector tube could be coiled within the cryostat in order pre-cool the mixture it flows into the helium liquid. The cryostat should be as tall as possible. The particles should be as small as possible in order to become trapped quickly.
Acknowledgements.
The authors appreciate suggestions from P. Toennies. We also acknowledge discussions with B. Altaner and J.-H. Trösemeier about the thermodynamics of particle entrapment. GB gratefully thanks the Turbulent Mixing and Beyond committee members, in particular S. Abarzhi and K.R. Sreenivasan.Appendix A Condensation of Hydrogen crystallites on vortices
To support our discussion of the trapping of the crystallites on the vortices in Sec. III.3, we estimate their equilibrium distribution based on a simple lattice model, where the trapping amounts to condensation into bound states of particles on the vortex. The binding energy is , and the particles have a monodisperse size distribution with diameter . We assume that the particles do not interact (in particular, they do not merge).
A.1 Model
We consider a lattice model with a lattice constant of the order of the particle diameter . In a volume there are
lattice sites. Vortices run through a fraction of these sites such that there are sites occupied by a vortex and sites making up the fluid bulk.
We choose a description in terms of a grand-canonical potential T where T is the temperature and the chemical potential will be adjusted to achieve that a fraction of the sites are occupied by particles. Finally, particles that condense onto a vortex change the system energy by an amount .
A.2 Partition functions
For non-interacting particles the grand-canonical potential T is the sum of the functions and describing particles in the bulk and on the vortices, respectively,
They take the respective forms Callen (1985); Widom (2002)
where is the Boltzmann constant.
The total number of particles, , is obtained as the negative derivative of T with respect to , such that the volume fraction of the particles amounts to
| (4a) | |||||
| where | |||||
| (4b) | |||||
| (4c) | |||||

A.3 Fixing the chemical potential
To compare to the experiments we have to fix the chemical potential, i.e., the parameter in Eq. (4a), in order to fix the particle volume fraction to the particular value . The exact expression for can be determined straight-forwardly by multiplying Eq. (4a) by and solving the resulting quadratic equation.
For the following discussion, however, we observe that in order to find a more transparent expression. Rewriting Eq. (4a) in the form
we see that the expression in square brackets is of order for small where . For one must then have a value of of the order of and the second term in the sum may be neglected. Consequently,
On the other hand, when becomes much smaller than such that , the second term in the square bracket may be neglected and the one in the denominator of its first term will approach , such that
The exact solution varies monotonously between these limits, and in view of we may safely assume in the following that
| (5) |
A.4 Fraction of condensed particles
From Eq. (4a) we see that the volume fraction of particles condensed onto the vortices amounts to
To find the fraction of particles condensed to the vortices we divide by the overall volume fraction of particles, . Together with Eq. (5),
| (6a) | |||||
| (6d) | |||||
This result states that for a fraction of the particles reside on sites with vortices. In this limit the energy change for residing on a vortex is small as compared to T so that particles do not feel the vortices. They are randomly distributed, and the particles are found on a vortex only by coincidence.
In the opposite limit the particles are strongly attracted to the vortices. However, since , not all particles can be placed on a vortex. Eventually, when all sites on the vortices are occupied, the fraction of condensed particles amounts to the number of lattice sites on vortices, , over the number of particles, , such that .
A.5 Comparison to the experiments
The cross-over from freely-moving particles to condensing particles arises when , i.e., for T. In order to pin down the locus of the transition we observe that
Finally, the binding energy T is estimated as the amount of kinetic energy of superfluid which would still be circling around the vortex core in the absence of the droplet Parks and Donnelly (1966),
| (7) |
where cm is the diameter of the vortex core, g is the mass of helium atoms, and is the mass density of the superfluid component of helium which is approximated according to Tam and Ahlers (1987). Due to the rapid rise of the mass density of the superfluid phase upon crossing Tλ this function rises rapidly when T drops below Tλ (Fig. 4). Inserting this data into Eq. (6a) provides the prediction for shown in Fig. 2.
References
- Atkins and de Paula (2002) Atkins, P., and J. de Paula, 2002, Physical Chemistry (Oxford UP, Oxford).
- Barenghi and Sergeev (2009) Barenghi, C. F., and Y. A. Sergeev, 2009, Physical Review B 80, 024514.
- Batchelor (1967) Batchelor, G. K., 1967, An introduction to fluid dynamics (Cambridge University Press).
- Bewley (2006) Bewley, G., 2006, Using frozen hydrogen particles to observe rotating and quantized flows in liquid helium, Ph.D. thesis, Yale University.
- Bewley (2009) Bewley, G. P., 2009, Cryogenics 49, 549.
- Bewley et al. (2006) Bewley, G. P., D. P. Lathrop, and K. R. Sreenivasan, 2006, Nature 441(7093), 588.
- Bewley et al. (2008) Bewley, G. P., M. S. Paoletti, K. R. Sreenivasan, and D. P. Lathrop, 2008, Proceedings of the National Academy of Sciences 105(37), 13707.
- Bewley and Sreenivasan (2009) Bewley, G. P., and K. R. Sreenivasan, 2009, Journal of Low Temperature Physics 156(3-6), 84.
- Bodenschatz et al. (2010) Bodenschatz, E., S. P. Malinowski, R. A. Shaw, and F. Stratmann, 2010, Science 327, 970.
- Callen (1985) Callen, H. B., 1985, Thermodynamics and an Introduction to Thermostatistics (Wiley, New York).
- Chagovets and Van Sciver (2011) Chagovets, T. V., and S. W. Van Sciver, 2011, Physics of Fluids 23, 107102.
- Chaikin and Lubensky (2000) Chaikin, P. M., and T. C. Lubensky, 2000, Principles of Condensed Matter Physics (Cambridge, Cambridge).
- Donnelly (1991) Donnelly, R. J., 1991, Quantized Vortices in Helium II (Cambridge University Press).
- Doremus (1985) Doremus, R., 1985, Rates of Phase Transformations (Academic Press, Orlando).
- Feynman (1955) Feynman, R. P., 1955, Progress in Low Temperature Physics 1, 17.
- Fujiyama et al. (2007) Fujiyama, S., R. Hänninen, and M. Tsubota, 2007, Journal of Low Temperature Physics 148(3), 263.
- Fuzier et al. (2008) Fuzier, S., N. Kalechofsky, and S. W. Van Sciver, 2008, Journal of Low Temperature Physics 152, 164.
- Gordon et al. (2012) Gordon, E. B., A. V. Karabulin, V. I. Matyushenko, V. D. Sizov, and I. I. Khodos, 2012, Chemical Physics Letters 519-520, 64.
- Guo et al. (2010) Guo, W., S. B. Cahn, J. A. Nikkel, W. F. Vinen, and D. N. McKinsey, 2010, Physical Review Letters 105, 045301.
- Guo et al. (2009) Guo, W., D. Jin, G. M. Seidel, and H. J. Maris, 2009, Physical Review B 79, 054515.
- Jin and Maris (2011) Jin, D., and H. J. Maris, 2011, Journal of Low Temperature Physics 162, 329.
- Kivotides et al. (2008) Kivotides, D., C. F. Barenghi, and Y. A. Sergeev, 2008, Physical Review B 77, 014527.
- La Mantia et al. (2012) La Mantia, M., T. V. Chagovets, M. Rotter, and L. Skrbek, 2012, Review of Scientific Instruments 83, 055109.
- Lapp et al. (2012) Lapp, T., M. Rohloff, J. Vollmer, and B. Hof, 2012, Experiments in Fluids 52, 1187.
- Levi and Mazzarello (2001) Levi, A. C., and R. Mazzarello, 2001, Journal of Low Temperature Physics 122, 75.
- Lifshitz and Slyozov (1961) Lifshitz, I., and V. Slyozov, 1961, Journal of Physics and Chemistry of Solids 19(1–2), 35.
- Maris et al. (1987) Maris, H. J., G. M. Seidel, and F. I. B. Williams, 1987, Physical Review B 36(13), 6799.
- Niemela and Sreenivasan (2006) Niemela, J. J., and K. R. Sreenivasan, 2006, Journal of Low Temperature Physics 143, 163.
- Paoletti et al. (2008) Paoletti, M. S., M. E. Fisher, K. R. Sreenivasan, and D. P. Lathrop, 2008, Physical Review Letters 101(15), 154501 (pages 4).
- Parks and Donnelly (1966) Parks, P. E., and R. J. Donnelly, 1966, Physical Review Letters 16(2), 45.
- Pierrehumbert (2010) Pierrehumbert, R. T., 2010, Principles of Planetary Climate (Cambridge UP, New York).
- Poole et al. (2005) Poole, D. R., C. F. Barenghi, Y. A. Sergeev, and W. F. Vinen, 2005, Physical Review B 71(6), 64514.
- Schmidt et al. (2008) Schmidt, J., N. Brilliantov, F. Spahn, and S. Kempf, 2008, Nature 451, 685.
- Shaw (2003) Shaw, R. A., 2003, Annual Review of Fluids Mechanics 35, 183.
- Silvera (1984) Silvera, I. F., 1984, Physical Review B 29, 3899.
- Skrbek (2004) Skrbek, L., 2004, Physica C 404, 354.
- Slezov (2009) Slezov, V. V., 2009, Kinetics of First-Order Phase Transitions (Wiley-VCH, Weinheim).
- Tam and Ahlers (1987) Tam, W. Y., and G. Ahlers, 1987, Journal of Low Temperature Physics 66, 173.
- Unlusu et al. (2008) Unlusu, B., J. Xu, M. Y. Hussaini, D. Celik, and S. W. Van Sciver, 2008, Journal of Thermophysics and Heat Transfer 22, 83.
- Vinen and Niemela (2002) Vinen, W. F., and J. J. Niemela, 2002, Journal of Low Temperature Physics 128(5/6), 167.
- Vollmer et al. (2007) Vollmer, J., G. K. Auernhammer, and D. Vollmer, 2007, Physical Review Letters 98, 115701.
- Wagner (1961) Wagner, C., 1961, Zeitschrift für Elektrochemie B 1.65, 581.
- Widom (2002) Widom, B., 2002, Statistical Mechanics: A concise introduction for chemists (Cambridge, Cambridge).