Compact sources in the Bologna Complete Sample:
high resolution VLA observations and optical data.
Abstract
Context. Among radio galaxies, compact sources are a class of objects not yet well understood, and most of them cannot be included in classical populations of compact radio sources (flat spectrum AGN or compact steep spectrum sources).
Aims. Our main goal is to analyze the radio and optical properties of a sample of compact sources and compare them with FRI/FRII extended radio galaxies.
Methods. We selected in the Bologna Complete Sample a sub sample of Compact sources, naming it the C BCS sample. We collected new and literature sub-arcsecond resolution multi-frequency VLA images and optical data. We compared total and nuclear radio power with optical emission line measurements.
Results. The [OIII] luminosity 408 MHz total power relation found in High and Low excitation galaxies, as well as in young (CSS) sources, holds also for the C BCSs. However, C BCSs present higher [OIII] luminosity than expected at a given total radio power, and they show the same correlation of Core Radio Galaxies, but with a higher radio power.
Conclusions. C BCSs appear to be the high power tail of Core Radio Galaxies. For most of the C BCSs, the morphology seems to be strongly dependent to the presence of dense environments (e.g. cluster or HI-rich galaxies) and to a low age or restarted radio activity.
Key Words.:
radio continuum: galaxies - galaxies: individual - galaxies: active - galaxies:jets1 INTRODUCTION.
According to their radio power and morphologies, radio galaxies are classified as FRI and FRII (Fanaroff Riley 1974) and Compact sources. FR I and FR II are extended sources on kpc up to Mpc scale. Their properties have been analyzed by several authors (e.g. Fanaroff Riley 1974, Laing et al. 1983, Fanti et al. 1986, Ledlow Owen 1996). Recently, Capetti et al. 2011 (and references therein) discussed the correlation between optical and radio properties at the light of unification models and accretion properties.
Sources with a projected linear size smaller than 15-20 kiloparsec are usually defined as compact sources and can be high or low power radio sources. High radio power sources can have flat or steep spectrum. Flat spectrum sources are small because of projection and relativistic effects being identified (in agreement with unified models, see e.g. Urry Padovani 1995) as objects dominated by the emission of a relativistic jet oriented at a small angle with respect to the line of sight. According to their radio power and optical properties, they are classified as FSRQ (Flat Spectrum Radio Quasars) or BL Lac objects.
High power, compact steep spectrum (CSS) sources can be small because they are young sources (e.g. Stanghellini et al. 2005 and references therein). CSS sources are not beamed sources and they are likely to be young radio galaxies that could evolve into large radio objects, FR I/FR II (see Fanti et al. 1995; Readhead et al. 1996; O’Dea 1998, for reviews, but also van Breugel et al. 1984). Strong support to this scenario comes from the measurements of proper motions of the hot spots of some of them (Polatidis Conway 2003, Giroletti Panessa 2009), with separation velocities of 0.1-0.4 h-1 c, and then small kinematic ages which are in agreement with spectral ages derived from flux density measurements (Murgia et al. 1999; Murgia 2003). Kunert-Bajraszewska et al. 2010 selected and studied the properties of low power CSS sources with flux density 70 mJy at 1.4 GHz and 0.7. These authors suggest the existence of a large population of short-lived objects, poorly known. Some of these could be precursor of large-scale FR I galaxies.
To better investigate the nature and properties of compact radio galaxies, we selected from the Bologna Complete Sample (BCS, Giovannini et al. 2001, 2005, Liuzzo et al. 2009b) all sources with a projected linear size smaller than 20 kpc. We will name this sub-sample the C BCS (Compact BCS sources) and it is composed by 18 objects. This complete sub-sample is selected at low frequency, therefore should present no bias with respect to the source orientation, possible beaming effects and spectral index. We note that most sources in our sample show a moderately steep spectral index, and could not be included in samples as the one presented by Kunert-Bajraszewska et al. 2010.
The radio power of C BCS sources is low with respect to powerful FR II or FSRQ, but in the same range of giant FR I radio galaxies (1023-26W/Hz at 408 MHz). Some of them were previously analyzed by us in the radio band (Giroletti et al. 2005b). We present in this paper radio data of the 5 remaining ones with new high resolution Very Large Array (VLA) observations. We also discuss their optical properties, showing for the first time their optical spectra, since the emission lines analysis is fundamental in order to understand the nature and properties of these objects.
Moreover we include in this paper data of few extended BCS sources in order to usefully compare the C BCS radio and optical properties with different radiogalaxy types (e.g. FRII and FRI extended sources).
The layout of the paper is the following:
- in Sect. 2, we describe radio and optical data for C BCS sample, in particular the new
high resolution VLA images and TNG (Telescopio Nazionale Galileo) observations;
- in Sect. 3, we present optical results for all our targets;
- in Sect. 4, we analyze the relation between the optical and radio emissions;
- in Sect. 5, we report notes on single sources ;
- in Sect. 6, we discuss our main results with literature ones;
- in Sect. 7, we resume our main conclusions.
Throughout this paper, we use of H0 = 70 km s-1 Mpc-1, and . Spectral indices are defined such that .
2 RADIO AND OPTICAL DATA.
Table 1 summarizes references for radio and optical data of all C BCS; N indicates sources for which new data are presented for the first time in this paper. We added also a few extended BCSs with new data presented here, to increase the statistics in the comparison between compact and extended sources.
2.1 New Radio Data
In this Section, we describe the data analysis done for the new sub-kpc scale VLA data obtained by us for B2 0149+35, B2 0708+32B, B2 0722+30, B2 1254+27, and B2 1557+26. We report also the new sub-kpc VLA observations of two peculiar BCS radio sources, B2 0331+39 and B2 1512+30.
The new high resolution VLA observations were obtained in two observing runs in 2006 March 11 and 2006 April 04. The array was in A configuration, and the observing frequencies were 8.4 GHz and 22 GHz. Standard observing schedules for high frequency observations were prepared, including scans to determine the primary reference pointing, and using a short (3 s) integration time and fast switching mode (180 s on source, 60 s on calibrator) for K band (22 GHz) scans. Post-correlation processing and imaging were performed with the NRAO (National Radio Astronomy Observatory) Astronomical Image Processing System (AIPS). Parameters of natural uv-weighted images are reported in Table 2. Our new VLA images for resolved sources are shown in Sect.5. To separate the different source components and relative fluxes, dimensions, we used in AIPS the JMFIT task which is a sophisticated least-squares fit of image with Gaussian components. Taking into account also spectral index considerations, we identified the core as the unresolved (point-like, see Tab.5) component having the higher flux density in the source. If given, the spectral index maps are made with AIPS using the same uv-range. Typical errors for flux density measurements are 3 for 8.4 GHz, and 10 for 22 GHz.
| Name | Type | Radio | Optical |
| data | data | ||
| B2 0116+31 | C BCS | 3 | N |
| B2 0149+35 | C BCS | N | 10 |
| B2 0222+36 | C BCS | 5 | N |
| B2 0258+35 | C BCS | 5 | N |
| B2 0648+27 | C BCS | 5 | N |
| B2 0708+32B | C BCS | N | - |
| B2 0722+30 | C BCS | N | 11 |
| B2 1037+30 | C BCS | 5 | N |
| B2 1101+38 | C BCS | 6 | 12 |
| B2 1217+29 | C BCS | 4 | 13 |
| 3C 272.1 | C BCS | 1 | 14 |
| B2 1254+27 | C BCS | N | 15 |
| B2 1257+28 | C BCS | 9 | 15 |
| B2 1322+36B | C BCS | 1 | 15 |
| B2 1346+26 | C BCS | 7 | 16 |
| 3C 305 | C BCS | 8 | 15 |
| B2 1557+26 | C BCS | N | 15 |
| B2 1855+37 | C BCS | 5 | N |
| B2 0331+39 | E BCS | N | - |
| B2 0844+31 | E BCS | 2 | N |
| B2 1003+35 | E BCS | 2 | N |
| B2 1144+35 | E BCS | 1 | 15 |
| B2 1512+30 | E BCS | N | N |
| B2 1626+39 | E BCS | 1 | 14 |
N: New high resolution VLA and/or optical data; 1: Giovannini et al. 2001; 2: Giovannini et al. 2005: 3: Giroletti et al. 2003; 4: Giroletti et al. 2005a; 5: Giroletti et al. 2005b; 6: Giroletti et al. 2006; 7:Liuzzo et al. 2009a; 8: Massaro et al. 2009; 9.Liuzzo et al. 2010 ; 10:Crawford et al. 1999 , 11: Morganti et al. 1992, 12: Capetti et al. 2010, 13: Ho et al. 1997, 14: Buttiglione et al. 2009, 15: SDSS DR7, Abazajian et al. 2009, 16: Anton 1993.
| 8.4 GHz | 22 GHz | ||||||
| Name | beam | noise | peak | beam | noise | peak | |
| () | (mJy/beam) | (mJy/beam) | () | (mJy/beam) | (mJy/beam) | ||
| B2 0149+35 | 0.350.30, -86 | 0.05 | 5.4 | 0.120.10, +85 | 0.09 | 4.2 | |
| B2 0708+32B | 0.360.30, +60 | 0.03 | 12.3 | 0.120.11, +46 | 0.06 | 7.3 | |
| B2 0722+30 | 0.340.32, -88 | 0.02 | 14.6 | 0.090.08, +71 | 0.08 | 5.1 | |
| B2 1254+27 | 0.310.30, -56 | 0.02 | 1.0 | 0.120.12, +0 | 0.06 | 5.2 | |
| B2 1557+26 | 0.320.32, +60 | 0.03 | 13.1 | 0.120.11, +34 | 0.06 | 12.5 | |
| B2 0331+39 | 0.340.29, -43 | 0.08 | 146.7 | 0.130.11, -52 | 0.07 | 117.1 | |
| B2 1512+30 | 0.200.20, +40 | 0.05 | ND | 0.070.08, +23 | 0.06 | ND |
ND indicates sources non detected in our new VLA data.
2.2 Optical Data
We collected optical information available for all C BCS sources, presenting new optical spectra and completing with the emission line measurements from literature. In Tab.1 , we list references used for our optical analysis. With numbers, we indicate literature references for optical information. With N we indicate sources for which optical observations were taken by us with the TNG, a 3.58 m optical/infrared telescope located on the Roque de los Muchachos in La Palma Canary Island (Spain). Spectra for five C BCS objects are available from the Sloan Digital Sky Survey (SDSS) database, Data Release 7 (Abazajian et al. 2009). We add to the sample unpublished optical observations for some extended BCSs to compare the compact BCS sources with the extended ones. It is important to note that we are considering all optical information available up to now for the whole BCS sample.
2.2.1 TNG observations.
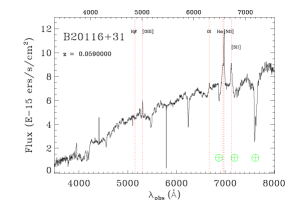
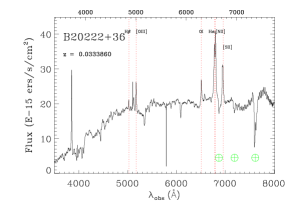
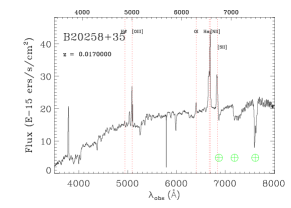
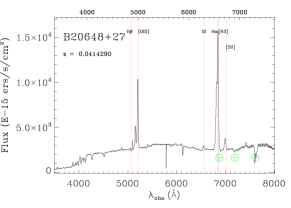
Tab. 3 contains the journal of observations and basic information for our targets. The TNG observations were made using the DOLORES (Device Optimized for the LOw RESolution) or LRS (Low Resolution Spectrograph) spectrograph installed at the Nasmyth B focus of the telescope. The detector is a Loral thinned and back-illuminated 2048x2048 CCD. Observations were performed in service mode during several nights between August 21 and December 18 2003. The seeing, measured from the acquisition images, varied between 0.8 arcsec and 1.3 arcsec. We used the low resolution LR-B grism and the 1.0 arcsec slit width. The dispersion is 2.8 Å per pixel and the spectral resolution about 11 Å. The typical useful spectral range is to Å with increasing fringing beyond 7200 Å. This range of wavelengths enables us to analyze all the relevant emission lines of the optical spectrum: H, [OIII] 4959,5007 Å, [OI] 6300,64 Å, H, [NII] 6548,84 Å, [SII] 6716,31 Å.
2.2.2 Data analysis
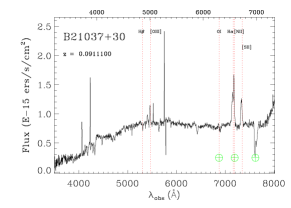
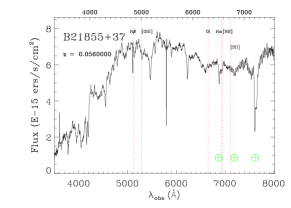
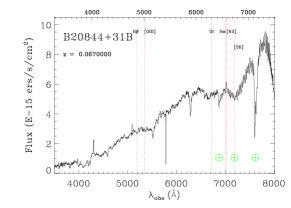
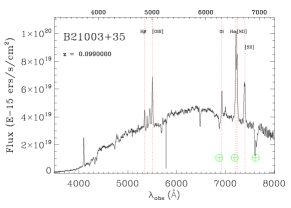
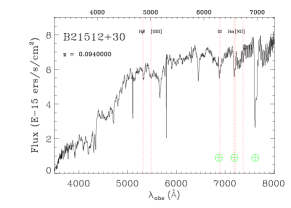
The data were reduced using the LONGSLIT package of NOAO’s (National Optical Astronomy Observatory) IRAF111IRAF (Image Reduction and Analysis Facility) is distributed by the National Optical Astronomy Observatories, which are operated by the Association of Universities for Research in Astronomy, Inc., under cooperative agreement with the National Science Foundation. It is available at http://iraf.noao.edu/ reduction software. A bias frame was subtracted from any frame, then the flat field correction was applied to remove the pixel-to-pixel gain variations. After that, the wavelength calibration, the optical distortions corrections and the background subtraction were applied. One-dimensional spectra were extracted by summing in the spatial direction over an aperture corresponding to the nuclear part of the source: we extracted and summed the 6 pixel rows closest to the center of the spectrum, corresponding to 1.65″. Lastly the relative flux calibration was made using spectro-photometric standard stars observed during each night. In Fig. 1 we present the C BCS sources optical spectra after the calibration.
In order to properly measure the emission lines intensities, we needed to subtract the stellar emission of the host galaxies. Before removing the stellar continuum, we corrected for reddening due to the Galaxy (Burstein et al. 1982, 1984) using the extinction law of Cardelli et al. 1989. The galactic extinction E(B-V) used for each object was taken from the NASA Extragalactic Database (NED) database. The adopted method consists on modeling the nuclear spectra with a single stellar population taken from the Bruzual et al. 2003 library and then subtracting the best fit model spectrum from the nuclear one. The templates assume a Salpeter Initial Mass Function (IMF) formed in an instantaneous burst, with solar-metallicity stars in the mass range M⊙. The parameters free to vary independently each other in order to obtain the best fit are the stellar age (from 1 to 13 Gyr), the metallicity (from 0.0008 to 0.5 solar metallicity), the normalization of the model, the velocity dispersion, the continuum emission from the AGN (Active Galactic Nucleus) and its slope. Even if this method of stellar removal gives also an estimate of the velocity dispersion, for the resolution of our spectra this value is dominated by the instrumental broadening. The spectral regions chosen for the fit are centered on the H and H emission lines, with a range of 3600 - 5500 Å for the H and 5700 - 7100 Å for the H. The emission lines are excluded from the fit, since they are strongly affected by the nuclear emission more than the stellar one. Other small regions are excluded because of telluric absorption, cosmic rays or other kind of impurities. At the end of this operation, as a result, we obtained the non stellar nuclear emission produced by the AGN activity. In Fig. 2 we show as an example of the adopted procedure, the spectra of 2 C BCS sources. The source spectra are in solid lines, the top spectra are before the stellar removal and the bottom spectra are the results of the host galaxy stellar population subtraction. The dotted line through the top spectra indicates the single stellar population model. The dashed line across the bottom spectra indicates the zero flux level. These spectra have a quite flat continuum emission with the overlap of emission lines produced by the photoionised gas.
| Name | redshift | Date | Texp |
| B2 0116+31 | 0.059 | 2003/08/22 | 1800x2 |
| B2 0222+36 | 0.033 | 2003/08/22 | 2400 |
| B2 0258+35A | 0.017 | 2003/08/22 | 2400 |
| B2 0648+27 | 0.041 | 2003/09/22 | 2400 |
| B2 1037+30 | 0.091 | 2003/12/17 | 1800x2 |
| B2 1855+37 | 0.056 | 2003/08/21 | 1800x2 |
| B2 0844+31B | 0.067 | 2003/11/14 | 2400 |
| B2 1003+35 | 0.099 | 2003/11/18 | 1800x2 |
| B2 1512+30 | 0.094 | 2003/08/23 | 1800x2 |
In Col.1 there are target names. Upper sources are C BCS while sources below the two solid lines are extended BCSs. In Col.2 there is the redshift of the sources. In Col. 3 we report the date of observation and in Col. 4 the exposure time in sec where x2 means that the image was repeated.


3 OPTICAL RESULTS.
3.1 Measure of the emission lines luminosities
In Tab.4 we report the emission lines fluxes. For targets observed with the TNG, we measured the lines intensities using the specfit package to fit Gaussian profiles to each emission line in our sources: H, [OIII] 4959.5007 Å, [OI] 6300.64 Å, H, [NII] 6548.84 Å, [SII] 6716.31 Å. To reduce the number of free parameters, we forced the velocity and FWHM to be the same for all the lines. The integrated fluxes of each line were free to vary except for those with known ratios from atomic physics: in this case the [OI] 6300.64 Å, [OIII] 4959.5007 Å and [NII] 6548.84 Å doublets. Where required, we insert a flat continuum. In some cases, we tried to fit a broad component for both the H and H lines, but the resulting lines intensities were smaller enough with respect to the narrow components to let us ignore them. For objects with information available in literature, we took emission line measurements as reported by the authors (see References in Tab.1).
| Name | H | [NII]6584 Å | [OI]6364 Å | [SII]6716 Å | [SII]6731 Å | H | [OIII]5007 Å |
| B2 0116+31 | (3.9 0.4) | (9.2 0.4) | (2.5 0.3) | (5.4 0.4) | (2.5) | (0.540.09) | (3.050.11) |
| B2 0222+36 | (3.3 0.1)e+1 | (4.0 0.1)e+1 | (1.7 0.1)e+1 | (2.1 0.1)e+1 | (1.7)e+1 | (9.2 0.4) | (2.100.05)e+1 |
| B2 0258+35A | (3.1 0.1)e+1 | (6.4 0.1)e+1 | (1.8 0.1)e+1 | (3.2 0.1)e+1 | (1.7)e+1 | (8.1 0.9) | (3.8 0.1 )e+1 |
| B2 0648+27 | (1.4 0.1)e+4 | (3.550.02)e+4 | (1.9 0.2)e+3 | (2.3 0.2)e+3 | (1.9)e+3 | (8.7 0.8)e+3 | (9.880.01)e+4 |
| B2 1037+30 | (1.000.05) | (1.7 0.05) | (3.2 0.4)e-1 | (8.4 0.6)e-1 | (3.2)e-1 | (0.4 0.2)e-1 | (6.0 0.3)e-1 |
| B2 1855+37 | - | 7.8e-1 | - | - | - | - | - |
| B2 0844+31B | (7.5 1.5)e-1 | (1.5 0.2) | - | - | - | - | (2.1 0.3) |
| B2 1003+35 | (6.5 0.1) | (4.660.08) | (2.3 0.1) | (3.510.09) | (2.33) | (1.5 0.1) | (4.8 0.1) |
| B2 1512+30 | - | - | - | - | - | 2.0 e-1 | (5.1 0.9)e-1 |
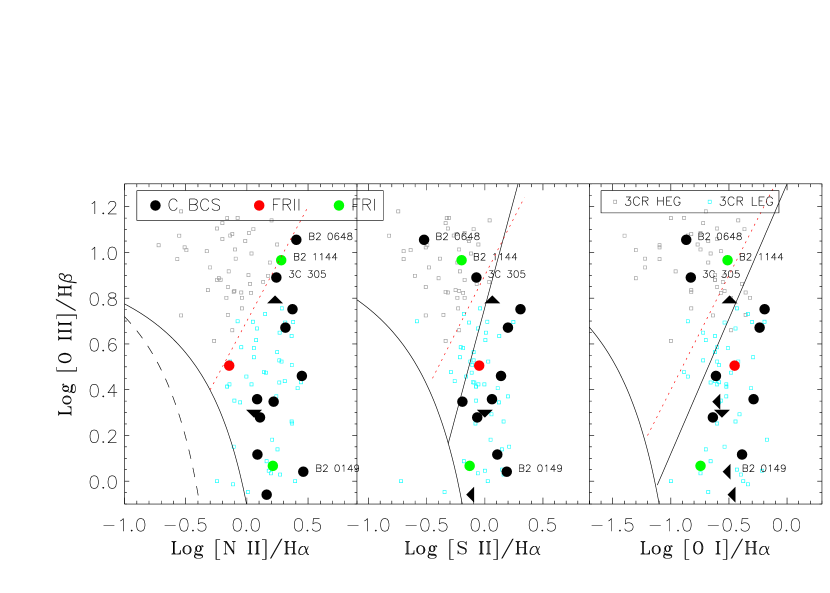
3.2 Diagnostic diagrams.
Diagnostic diagrams are constructed from pairs of observed line ratios which reveal information on ionizing continuum, ionization parameter, gas temperature and other physical properties of the emission line regions. According to Heckman 1980, Baldwin et al. 1981, Kewley et al. 2006 and other works, star forming galaxies are separated from AGNs and AGNs into High Excitation Galaxies (HEG) and Low Excitation Galaxies (LEG).These ratios are chosen so that considered lines are very close to avoid reddening and extinction problems (strongest for the bluer part of the spectrum), and also the ratios can be measured even if there are uncertainties on the flux calibration of the spectra. Moreover, the chosen lines are often the strongest features of the optical spectra, easily found also in low luminosity galaxies.
In Fig. 3 we show the three diagnostic diagrams in Tab. 1:
([OIII]H) versus ([NII]H),([OIII]H) versus ([SII]H) and the
([OIII]H) versus ([OI]H).
The standard optical diagnostic diagram is the
([OIII]H) versus ([NII]H).
These line ratios are used to separate the star-forming galaxies from AGNs,
since the [NII]H is more sensitive to the presence of low level
AGN than other lines due to its sensitivity to metallicities, while the [OIII]H
line ratio is sensitive to the ionization parameter of the gas (the amount of ionization
transported by the radiation moving through the gas).
The ([OIII]H) versus
([SII]H) and the
([OIII]H) versus
([OI]H) diagnostic diagrams are more sensitive to
the hardness of ionizating radiation field, dividing the AGNs into two
branches: high ionization sources (i.e. High Excitation Galaxies, HEG)
lie on the upper branch, low ionization sources
(i.e. Low Excitation Galaxies, LEG) lie on the lower branch.
In Fig. 3, B2 0708+32B, B2 0722+30, B2 1257+28, B2 1855+37, B2 0331+39, B2 0844+31, B2 1101+38, B2 1512+30 are not considered due to their upper limits or undetected lines in at least one of the diagnostic ratios. The star forming, HEG and LEG regions are separated by solid lines according to Kewley et al. 2006. The region between the dashed line and the solid line in the Log ([OIII]H) versus Log([NII]H) diagram indicates the region of composite galaxies, sources with both star-forming and nuclear activity. We also plotted in color the HEG (grey) and LEG (cyan) regions occupied by the radio-loud AGN with redshift taken from the 3CR Third Cambridge Catalog of Radio Sources) sample (Buttiglione et al. 2010). The red dotted lines represent the HEG/LEG separation derived for 3CR. The 3CR catalog of radio sources is characterized by unbiased selection criteria with respect to optical properties and orientation, and it spans a relatively wide range in redshift and radio power, covering the whole range of behavior of radio-loud AGN. BCS sources, with detected enough emission lines to make diagnostic diagrams (see Tab. 4), are shown as colored dots according to their classification. The position of C BCS sources on the diagnostic diagrams indicates that the majority of our sources belongs to the LEG group. The only exceptions are B2 0648+27 and 3C 305, located in the HEG region. We note also that in this region is present B2 1144+35 a BCS FRI radiogalaxy. We also labeled the source B2 0149+35, source in a low activity phase detailed discussed in Sect. 5.1.2.
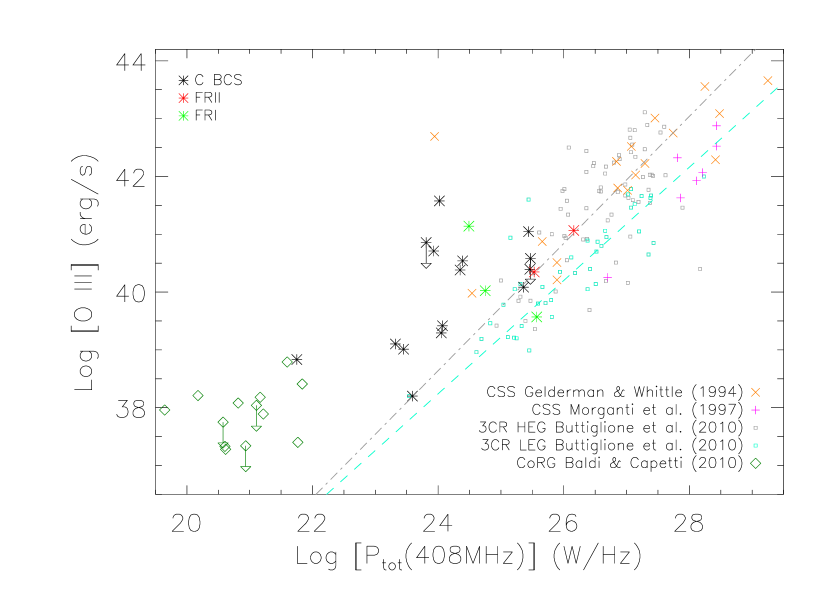
4 OPTICAL-RADIO CORRELATION
The correlation between AGN optical narrow emission line and radio power is verified since long time (e.g. Baum et al. 1989a, 1989b). This correlation is explained thinking of a common energy source for both the optical lines and radio emission: the isotropically emitted radiation from the active nucleus ionizes the optical emitting gas and the radio luminosity is determined by the properties of the central engine.
As shown by Morganti et al. 1997, the same optical-radio relation holds both for extended sources and compact sources. They compared the [OII] 3727 Å and [OIII] 5007 Å emission line luminosities of a sample of CSS sources with the values found for extended sources of similar radio power and redshift. They found a very intriguing result: in the correlation between the [OII] 3727 Å - radio luminosities, both compact and extended radio sources lie on the same linear correlation; instead, looking at the [OIII] 5007 Å - radio luminosities, compact sources tend to be at the lower side of the [OIII] 5007 Å luminosity.
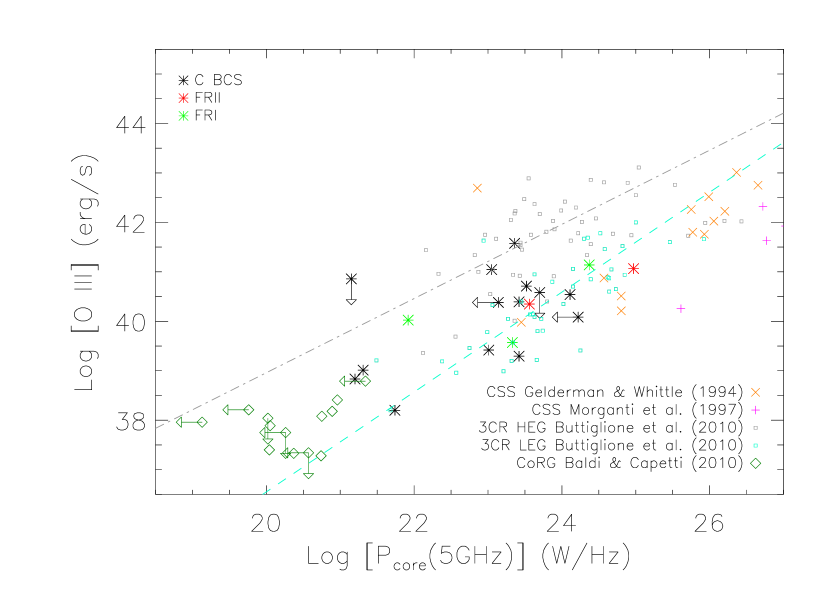
In Figs. 4 and 5, we have done respectively the [OIII] 5007 Å - 408 MHz radio extended luminosities and [OIII] 5007 Å - 5 GHz radio core luminosities plots. We have included C and E BCS sources with available optical data, comparing our results with different samples. B2 0708+32B and B2 0331+39 are not included because we have no information on the [O III] emission line flux. As we used a combination of our TNG, SDSS and other telescopes spectra, a potential issue concerning our optical spectroscopic data is the difference in the spatial size of the associated spectral aperture. This is due to the different angular sizes of the aperture and also to the range of redshift covered by our sample. However, we verified that no link is present between the instrumental setup (or redshift) and the location of the various objects in Fig. 4 and 5.
We added samples of more powerful compact sources (orange crosses: Gelderman et al. 1994, magenta plus: Morganti et al. 1997), in order to verify the presence of an optical-radio correlation. Moreover, we superimposed the 3CR LEG and HEG sources (grey and cyan small squares, Buttiglione et al. 2010) to compare compact sources with extended ones. Finally, we plot also (green diamonds) the Core Radio Galaxies (CoRG) sample of Baldi Capetti 2010 to compare our sample with these peculiar faint compact sources.
From Fig. 4, we note that C BCS sources show a lower total radio power than the LEG objects discussed by Buttiglione et al. 2010 or that their optical emission line is higher than expected from the radio power. C BCS sources show a significantly higher optical luminosity with respect to the best linear fit obtained by Buttiglione et al. 2010 for HEG and LEG sources (see cyan and green dashed lines). CoRGs studied by Baldi Capetti 2010 follow the same trend of C BCS. It looks like that core radio galaxies and C BCS have in general a low total radio power with respect to HEG, LEG and CSS radio sources, but the line optical luminosity is a factor two higher with respect to the correlation with the total radio power.
We compared also at the [OIII] 5007 Å luminosity with the 5 GHz radio core luminosities for all samples discussed before (Fig. 5). In this diagram CoRGs as well as C BCS sources are in between the HEG and LEG best linear fit. Our C BCS sources seems to be intermediate objects between 3CR LEG + CSS sources and the CoRGs of Baldi Capetti 2010. Nuclear emission of 3CR HEG sources is definitely brighter in [OIII] luminosity, while C BCS at a given core radio power are near to the linear bets fit of LEG sources but on average C BCS are optically brighter.
We note that also CSS sources do not follow the two linear fits suggesting a possible common fit of CSS, C BCS and Core radio galaxies. It seems that they follow an independent track with respect to HEG and LEG sources. Kunert-Bajraszewska et al. 2010, discussing a sample of Low Luminosity Compact Objects, suggest two parallel evolutionary tracks for HEG and LEG sources, evolving from GPS (Gigahertz Peaked Sources) to CSS to FR. Our diagram, thanks to the addition of low power Core Radio galaxies and C BCS sources selected at low frequency and without any constrain on their spectral index, suggest a more complex scenario.
5 NOTES ON SINGLE SOURCES.
5.1 Compact BCS sources
In this Section, we give short notes on the whole sample of C BCSs. For all resolved targets in our new radio maps, we present here also an image. For all these sources, if not specified, the beam size and the noise level of each map are those reported in Tab.2. In Tab.5, we give basic source parameters at 8.4 GHz and 22 GHz for our new VLA images. The reported core positions are obtained from our new VLA observations.
The arcsecond core flux density at 5 GHz and total flux density at 408 MHz are from Liuzzo et al. 2009b.
| 8.4 GHz | 22 GHz | ||||||
| Source | Component | RA (J2000) | DEC (J2000) | flux | flux | size | |
| h m sec | d ′ ″ | (mJy) | (mJy) | ′′ | |||
| B2 0149+35 | core | 01 52 46.458 | 36 09 06.50 | 5.5 | 4.9 | 0.12 | P |
| B2 0708+32B | core | 07 11 47.704 | 32 18 35.12 | 12.6 | 7.5 | 0.54 | P |
| N lobe | - | - | 2.7 | - | - | 3.5 | |
| S lobe | - | - | 3.2 | - | - | 3.0 | |
| total | - | - | 18.5 | - | - | 13.0 | |
| B2 0722+30 | core | 07 25 37.256 | 29 57 14.96 | 14.6 | 6.7 | 0.77 | P |
| E lobe | - | - | 4.9 | - | - | 8.0 | |
| total | - | - | 19.0 | 6.7 | 1.08 | 12.0 | |
| B2 1254+27 | core | 12 57 24.356 | 27 29 52.23 | 1.1 | 5.3 | -1.63 | P |
| total | - | - | 1.2 | 5.6 | -1.60 | 0.3 | |
| B2 1557+26 | core | 15 59 51.616 | 25 56 26.35 | 13.5 | 12.3 | 0.10 | P |
| NE jet | - | - | 1.8 | - | - | 0.7 | |
| total | - | - | 15.3 | 12.3 | - | 0.6 | |
| B2 0331+39 | core | 03 34 18.415 | 39 21 24.37 | 145.8 | 114.5 | 0.25 | P |
| S jet | - | - | 28.9 | 13.9 | 0.76 | 0.9 | |
| halo | - | - | 29.5 | - | - | 3.5 | |
| total | - | - | 204.2 | 136.2 | - | 3.5 |
In Col.8, P indicates point-like structure and it is related to the core morphology (see text in Sect. 2.1).
5.1.1 B2 0116+31.
The radio galaxy B2 0116+31 (4C 31.04) is classified as a low-redshift CSO (Compact Symmetric Object) (Giovannini et al. 2001, Cotton et al. 1995). VLBA (Very Long Baseline Array) images at 5 GHz show a compact core component with hot spots and lobes on either side (Giroletti et al. 2003). Spectral line VLBI (Very Long Baseline Interferometer) observations reveal the presence of an edge-on circumnstellar H I disk (Perlman et al. 2001). The optical nucleus is also found to have cone-like features well aligned with the radio axis.
According to Perlman et al. 2001, optical data suggest a relatively recent merger having occurred yrs ago. In our TNG spectrum we detect all the diagnostic emission lines and their ratios clearly settle the source among LEG.
5.1.2 B2 0149+35.
B2 0149+35 is identified with NGC 708, a D/cD galaxy associated with the brightest galaxy in the central cooling flow cluster Abell 262 (Braine Dupraz 1994). B2 0149+35 is a low brightness galaxy whose nuclear regions are crossed by an irregular dust lane and dust patches (Capetti et al. 2000).
The interaction between the cooling gas and the radio source is discussed by
Blanton et al. 2004.
The comparison between the total and core
radio power and between radio and X-ray images suggests that at present the
radio core is in a low activity phase (Blanton et al. 2004,
Liuzzo et al. 2010).
Our VLA observations show an unresolved component with a flux density of
5.5 mJy at 8.4 GHz, 4.9 mJy at 22 GHz, and a flat spectrum
( 0.12).
The lower flux density in 5 GHz VLBA maps can be due to a slightly inverted
spectrum or to some extension lost in VLBA
images and/or because of variability.
From the diagnostic diagrams and the [O III]-radio plots the source is classified as LEG.
5.1.3 B2 0222+36.
This source shows an halo-core structure at arcsecond resolution (Fanti et al. 1986). Sub-arcsecond 8 GHz VLA map resolve the structure into a core and two components on either side, while at 22 GHz it shows an S-shaped morphology with a dominant core and two lobes (Giroletti et al. 2005b).
In VLBI images at 1.6 GHz, B2 0222 + 36 is two sided, with jets emerging in opposite directions along the north-south axis. Since there is evidence of a change of the jet direction in the inner region, Giroletti et al. 2005b speculate that the jet orientation is rotating because of instabilities of the AGN. This could explain the small size of the source because an unstable jet did not allow the growth of a large scale radio galaxy. In this case the old round halo could be due to the diffusion of radio emission during the orbit of the inner structure.
From the diagnostic diagrams, this source is classified as a LEG-type.
5.1.4 B2 0258+35.
This source was studied with VLA and Merlin + EVN (European VLBI Network) by Sanghera et al. 1995, who classified it as a CSS source. VLA data show a double structure with a separation of 1.1 ″. EVN + MERLIN images reveal an extended plume-like feature at both ends of the source and a jet-like feature in between. Sub-arsecond VLA images at 8 and 22 GHz reveal the same structure. The source appears to strongly interact with the ISM (InterStellar Medium) as shown by the large bending of the arcsecond structure of the SE lobe and the presence of a surrounding low brightness extended structure in the VLA images. Large amount of extended HI-disk in the central region of the source is detected (Emonts et al. 2006a, 2006b).
From the diagnostic diagrams, it is a LEG-type source.
5.1.5 B2 0648+27
This object is only slightly extended at the lowest frequencies (Parma et al. 1986). It was resolved into a double source extended about 1 ′′ with VLA observations at 8.4 GHz (Giroletti et al. 2005b). Morganti et al. 2003 detect a large amount of H I. The two radio lobes do not show any evidence for jet-like structure or the presence of hot spots.
Giroletti et al. 2005b estimated a minimum age for this source of about 1 Myr. Probably the external lobe regions are much older, confirming that this source is confined, and it is expected to remain compact similar to NGC 4278 (Giroletti et al. 2005a). The connection between the small size of the radio emission and the presence of a major merger in this galaxy about 109 years ago, with the presence of a large amount of H I in this galaxy (Morganti et al. 2003) is remarkable.
From the optical spectrum, we observe very strong high excitation emission lines and the Balmer lines in absorption, as the spectra produced by a dominant young stars population. In the diagnostic diagrams, this source occupies the region of HEG galaxies. This is the most powerful source in optical band in our sample.
5.1.6 B2 0708+32B.
This source reveals an extended morphology in direction NS (Fanti et al. 1986) with two symmetric lobes about 10 ′′ in size (10 kpc). In VLBA images at 5 GHz (Liuzzo et al. 2009b), a double structure oriented along P.A. (Position Angle) 150∘ and extended 4 mas is observed. Since no spectral index information is available, the identification of the core is not possible.
Our 8.4 GHz map (Fig.6) shows an unresolved nucleus (Tab. 5) and two symmetric lobes in agreement with the structure present in the 1.4 GHz observations. No jet-like structure is visible. In our 22 GHz VLA observation, only the core is visible (Tab. 5). The angular resolution of VLA images is too low to resolve the double structure visible in VLBA images. Using VLA data at 1.4 GHz from Fanti et al. 1986, we estimated the spectral index for lobes and central component. We derived 1 for the two lobes and for the central component: = 0.3 and = 0.54. The steepening of the high frequency spectrum and the high degree of symmetry of the source suggests that the compact central component could be identified as Compact Symmetric Source (CSO) and this small size radio source is a restarted young source. We want also emphasize how rare it is to see extended emission in a CSO. Up to now the only known with this properties are 0108+388 (Stanghellini et al. 2005) and 0402+379 (Zhang et al. 2003). We have no optical spectroscopic information on this sources, so its classification is not possible.

5.1.7 B2 0722+30.
This radio source is associated with a disk galaxy. Strong absorption is associated with its disk and a bulge-like component is also clearly visible. The radio emission originates from two symmetric lobe-like features in E-W direction, i.e. at an angle of 45∘ to the disk (Capetti et al. 2000). In Fig. 7, we report the optical image from the HST (Hubble Space Telescope) overimposed to a VLA radio image at 5 GHz.
At arcsecond resolution, this source shows an FRI radio morphology with a total power of 3.1 1023W Hz-1 at 408 MHz and a linear size of 13.5 kpc.
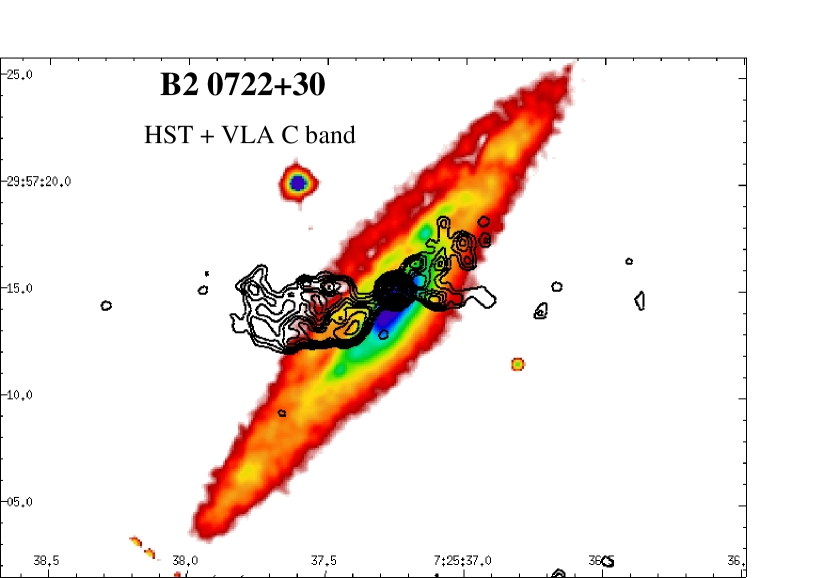
Our 8.4 GHz VLA observations (Fig. 8) show an unresolved nucleus, and a marginal detection of the East lobe which appears completely resolved. At 22 GHz, only the core is detected. It is unresolved with a total flux of 6.5 mJy (Tab. 5). The radio core position is slightly offset with respect to the brightest optical region ( 1″), however we note that the optical core is not well defined because of the large dust absorption.
The core radio spectrum shows a clear steepening: = 0.2, = 0.64, and = 0.85 suggesting a sub-arcsecond resolved structure in agreement with the not detection in our VLBA data (Liuzzo et al. 2009b).

This source is one of the rare objects where a disk galaxy in the nearby Universe hosts a radio emission FR I like shape. Literature research can provide information on only other three cases: 1) the spiral galaxy 0313-192 in Abell 428 exhibiting a giant (350 kpc) double-lobed FRI (Ledlow et al. 1998, 2001; Keel et al. 2006); 2) NGC 612 is a typical S0 galaxy with a large-scale star-forming H I disc and a powerful FR-I/FR-II radio source (Véron-Cetty Veŕon 2001; Emonts et al. 2008); 3) the BL Lac object PKS 1413+135 (McHardy et al.1994; Lamer et al. 1999).
In the optical, we do not found either spectrum or the [O III] emission line for this source: an optical classification is so not possible.
5.1.8 B2 1037+30
The source is only slightly resolved at 1.4 GHz (Fanti et al. 1986). At subarsecond resolution, at 8 GHz an edge-brightened structure, with complex sub-structures: jets, and lobes with hot spots is detected, while at 22 GHz only a point-like component, probably the core, and the resolved NW hot spot are evident. In VLBI images, the core is clearly revealed with a faint, diffuse emission detected on the shortest baselines (Giroletti et al. 2005b). According to its radio properties Giroletti et al. 2005b classified it as a young CSO source.
In the optical, B2 1037+30 is identified with the brightest galaxy in the cluster Abell 923. From analysis, it follows the LEG sources: the optical line ratios set the source LEG region close to the boundary with HEG sources. The same position is found in the optical-extended radio plot, while in the optical-core radio plot and in the accretion rate plot the source in clearly identified with LEG types. The optical line ratios set the source close to the HEG-LEG boundary. The same position is found in the optical-radio plots.
5.1.9 B2 1101+38
Mrk 421 (B2 1101+38) is a well-known BL Lac, widely studied at all frequencies and detected at TeV energies (Punch et al. 1992). The NVSS (NRAO VLA Sky Survey) image shows a 30″core-dominated source, with emission on either side. The estimated viewing angle is . For more details on radio structure of this BL Lac, see Giroletti et al. 2006.
5.1.10 B2 1217+29
This source is identified with the nearby galaxy NGC 4278. In the radio band reveals a compact structure at all frequencies between 1.4 and 43 GHz ( Condon et al. 1998; Di Matteo et al. 2001: Nagar et al. 2000, 2001). Only at 8.4 GHz, at a resolution of 200 mas, it is slightly resolved into a two-sided source with an extension to the south (Wilkinson et al. 1998). VLBA data show a two-sided emission on sub-parsec scales in the form of twin jets emerging from a central compact component (Giroletti et al. 2005a). Large amount of extended HI disc is detected in its central region (Emonts et al. 2006a, 2006b).
This source shows low [O III]/H ratio, settling in the LEG region of the diagnostic diagrams. In particular, it shows low [O III] luminosity, as confirmed by its position in the lower left side of the [O III]- radio plots.
5.1.11 B2 1257+28
This is one of two dominant members of the Coma cluster (Abell 1656) and considered the BCG. It is a cD galaxy whit a small size WAT (Wide Angle Tail) structure. Arcsecond scale properties are discussed in Feretti & Giovannini 1987: it has a total flux density at 1.4 GHz of 190 mJy and the core flux density at 6 cm is 1.1 mJy. The radio emission is completely embedded in the optical galaxy, and a gap of radio emission is present between the core and the SW lobe, while a faint jet connecting the core and the NE lobe is detected. Parsec scale properties are discussed in details in Liuzzo et al. 2010: the source shows a one-sided structure with a total flux density of 10.1 mJy, and the core flux density is 7.27 mJy.
Our optical analysis classified this source as LEG type object.
5.1.12 3C 272.1
3C 272.1 is identified with a giant elliptical galaxy. It shows strong radio emission and a two-sided jet emerging from its compact core. HST images reveal dust lanes in the core of the galaxy while no significant amount of diffusely distributed cold dust was detected at sub-millimeter wavelengths (Leeuw et al. 2000). At parsec scale, this nearby source shows a clear one-sided structure (Giovannini et al. 2001).
This source has low [O III] luminosity, as confirmed by its position in the lower left side of the [O III]- radio plots.
5.1.13 B2 1254+27
This radio galaxy is identified with the BCG (Brightest Cluster Galaxy) of a sub-group merging into the Coma cluster. The optical galaxy, NGC 4839, is classified as a cD galaxy (Parma et al. 1986, and references therein).
In VLA observations at 1.4 GHz, it appears as a FRI radio source with 2 lobes in direction N-S. At 5 GHz, the arcsecond core flux density is 1.5 mJy (Giovannini et al. 2005).
Our VLA maps at 8.4 GHz and at 22 GHz show a marginally resolved structure with an inverted spectral index (see Tab. 5), suggesting the presence of a compact nuclear emission.
The LEG classification of this source derived from the diagnostic diagrams is confirmed also by the [O III]-radio plots.
5.1.14 B2 1322+36B
On VLA scales, this source shows a twin-jet morphology. On parsec scale, it has a core-jet structure extending 10 mas in the same direction as the main large-scale jet.
According to its position in all optical plots, this source is classified as LEG.
5.1.15 B2 1346+26
This galaxy is the central galaxy of the cool core cluster A1795, which hosts the bright FR I radio source 4C 26.42. We studied in details its parsec scale morphology in Liuzzo et al. 2009a. Our multi-frequency and multi-epoch VLBA observations reveal a complex, reflection-symmetric morphology over a scale of a few mas. The source appears two-sided with a well defined and symmetric Z-structure at 5 mas from the core. The kiloparsec-scale morphology is similar to the parsec-scale structure, but reversed in P.A., with symmetric 90∘ bends at about 2 arcsec from the nuclear region. A strong interaction with the ISM can explain the spectral index distribution and the presence of sub-relativistic jets on the parsec scale.
In the optical, even if we detect upper limits on the [O III] emission line, the position of this source in diagnostic diagrams reveals a LEG nature.
5.1.16 3C 305
This small FR I radio galaxy shows a plumed double structure with two faint hot spots and symmetric jets. The optical galaxy is peculiar, with continuum emission on the HST scale perpendicular to the radio jet (Giovannini et al. 2005, and references therein). The X-ray emission of this source is extended but it is not connected with radio structure. However, the X-ray emission is cospatial with the optical emission line region dominated by the [O III]5007. This could be interpreted as due to the interaction between the radio jet and the ISM (Massaro et al. 2009).
From our optical analysis, according to its position in Fig. 3, this source is classified as HEG.
5.1.17 B2 1557+26
The host galaxy IC 4587 is a smooth and regular elliptical galaxy (Capetti et al. 2000).
In our 8.4 GHz VLA observations (Fig. 9), the radiosource is resolved in a core and a NE jet aligned with the emission observed in the 5 GHz VLBA images by Giovannini et al. 2005. The jet is extended about 0.6 arcsec from the core. At 22 GHz, the jet is not detected and the core has a total flux of 12.3 mJy (Tab. 5).
According to its position in all the optical plots, this source is classified as LEG.

5.1.18 B2 1855+37
This source shows a distorted double structure on the kiloparsec scale, with no detection on VLBA scale, that suggests its identification with a small symmetric source with a faint core (Giovannini et al. 2005, and references therein). The extended structure of this source seems to be confined by external gas pressure.
Due to upper limits on the optical emission lines, an optical classification is not possible.
5.2 Extended C BCS sources.
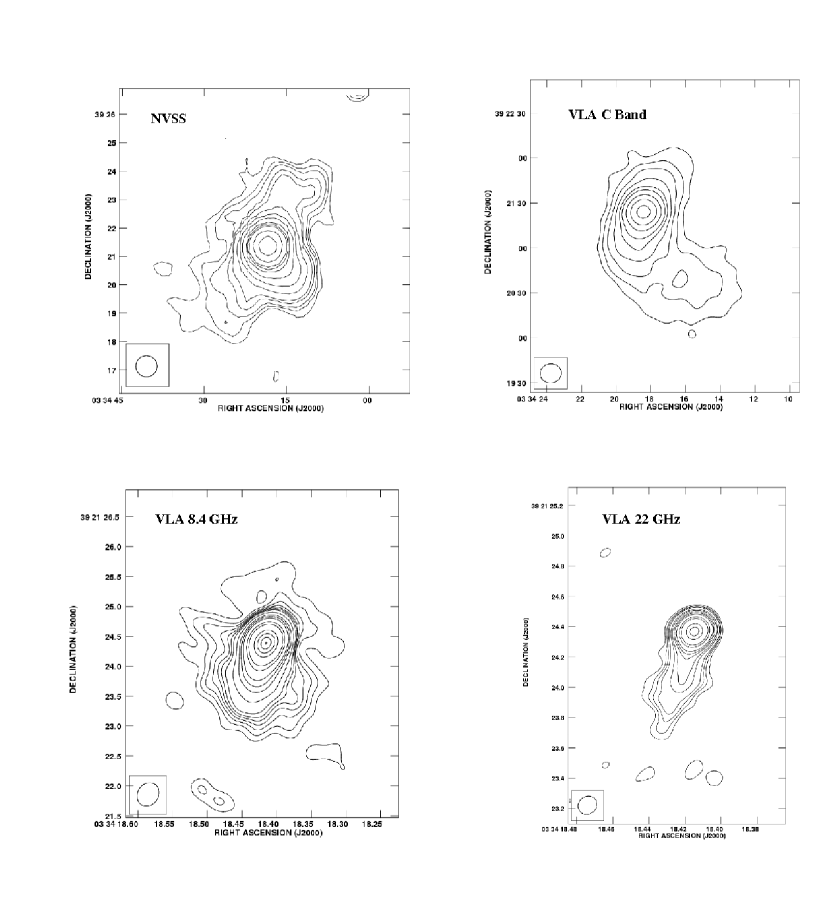
5.2.1 B2 0331+39.
Previous high resolution VLA observations at 1.4 GHz (A and B configuration) of this source (4C 39.12) revealed a resolved core plus a faint halo 1 arcmin in diameter (Parma et al. 1986, Fanti et al, 1986). Data at 5 GHz also show that the core is resolved and the inner source region is dominated by a bright one-sided structure extended 1 ″, and surrounded by a symmetric low brightness halo.
This structure is confirmed by our 8.4 GHz VLA image (Fig. 10): the radio source is characterized by a nuclear emission plus one sided jet in South direction and a halo around it. We note that the bright jet extension is not limited by sensitivity, but it looks like that the bright jet really ends after 1 ″.
Our 22 GHz VLA map (Fig. 10) shows an unresolved core and the Southern jet. However, because of the high angular resolution and low surface brightness at this high frequency, the extended halo is not visible (see Tab.5).
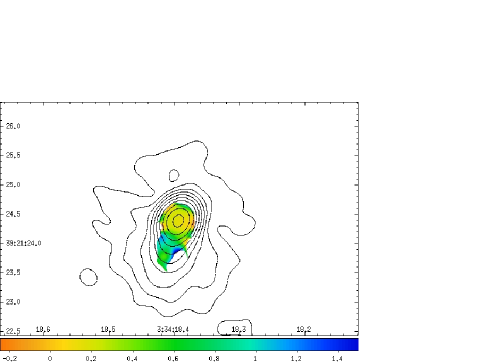
From Parma et al. 1986, we derived the spectral index between 1.4 GHz and 8.4 GHz of the halo: 0.4. We produced also a spectral index image of the arcsecond jet comparing 8.4 and 22 GHz images obtained using the same uv-range and angular resolution (Fig. 11). The core region has a flat spectral index with a clear steepening up to 0.9 along the jet, which appears steeper than the surrounding halo.
The one-sided jet structure is in good agreement with previous VLBA observations of this source presented in Giovannini et al. 2001 where the parsec scale jet is found at the same P.A. of the arcsecond jet presented here.
At lower resolution this source is highly peculiar. From the NVSS image (see Fig. 10), we see a bright one-sided structure with a size of 3 arcmin (70 kpc) oriented at P.A.= 220∘, i.e. very different from the jet and inner halo P.A. (160∘). Moreover, a fainter symmetric diffuse emission is present on a larger angular scale (more than 6 arcmin, 150kpc) at about the same P.A. of the inner one-sided jet and halo. The total NVSS flux density is 1.1 Jy. The total spectral index is 0.5 – 0.6 from 74 MHz up to 4.8 GHz (see NED archive data), with a clear evidence that the new restarted component is dominant at all frequencies.
This complex morphology suggests a restarting activity with a change of the P.A. in the different epochs. A more detailed study is necessary to understand this peculiar source.
We do not found either the optical spectrum or the [O III] emission line for this source: an optical classification is not possible.
5.2.2 B2 0844+31
This is a symmetric narrow-line FR II radio galaxy. At parsec resolution a bright core and two-sided jets are visible. The image from the FIRST Survey shows two extended FR I lobes at a larger distance from the core beyond the FR II-type hot spot, indicating a prior phase of radio activity. For this reason, this source could be classified as a restarted source, i.e., a source in which the extended FR I structure is related to previous activity, whereas the inner FR II structure originates from more recent core activity (Giovannini et al. 2005).
According to its position in all the optical plots, this source is classified as LEG.
5.2.3 B2 1003+35
It is the largest known FRII radio galaxy with its projected linear size of more than 6 Mpc. It shows a complex structure at arcsecond resolution with evidence of relativistic jets oriented in the same direction as the large-scale structure with some oscillations (Giovannini et al. 2005). Its peculiar radio structure has been interpreted as evidence of restarted activity (O’Dea et al. 2001).
According to its position in all the optical plots, this source is classified as LEG type, but close to the HEG boundaries.
5.2.4 B2 1144+35
This is a large scale ( 0.9 Mpc) FRI radio source, core dominated with a short and bright two-sided jet. The bright arcsecond scale core is resolved at milliarcsecond resolution into a nuclear source, a main jet with an apparent superluminal velocity, and a faint counter-jet. Evidences of a dynamic interaction with the surrounding medium are present. The radio morphology of this source shows clear discontinuities at different linear scales suggesting a continuous activity but with high and low level periods (Giovannini et al. 2007).
From the optical point of view, this galaxy falls among HEG sources in the diagnostic diagrams, showing a very strong [O III] 4959,5007 Ådoublet. This classification is confirmed with the optical line luminosity - total and core radio power plots, as well as in the accretion rate plot.
5.2.5 B2 1512+30.
The host galaxy does not show any outstanding morphological features, except for very faint elongated dust absorption at the center (Capetti et al. 2000). In VLA image at 1.4 GHz with 5 arcsec of resolution, it appears as double source with two lobes in direction NS (Fanti et al. 1987), in agreement with the FIRST (Faint Images of Radio Sky at Twenty-Centimeters) image. The angular size is 22 arcsec corresponding to 38 kpc.
Both in our 8.4 GHz and 22 GHz images, the source is undetected above
0.25 mJy/beam and 0.30 mJy/beam in X and K bands respectively.
Using the total flux at 408 MHz and at 1.4 GHz, we derived a spectral index
2.
The non detection of a core emission at high frequency together with the steep low frequency spectral index suggest that
this object is a dying radiosource with a radio quiet core.
From our optical study, according to its position in the diagnostic diagrams (Fig. 3), this source is classified as LEG.
5.2.6 B2 1626+39
This source is identified with the central galaxy 3C 338 in the cool core cluster A2199. It is a multiple nuclei cD galaxy with the presence of dust lanes (Jensen et al. 2001). On kiloparsec scales it has two symmetric extended radio lobes, characterized by a steep spectrum and misaligned with the central emission. The two radio lobes are connected by a bright filamentary structure. Both the steep radio spectrum and strong filamentary emission may be caused by interactions with the dense intracluster medium (Gentile et al. 2007). 3C 338 was the first radio source in which a two-sided jet was observed on parsec scales (Feretti et al. 1993).
In the optical, according to its position in the optical-radio plots, this source is classified as LEG source.
.
6 DISCUSSION.
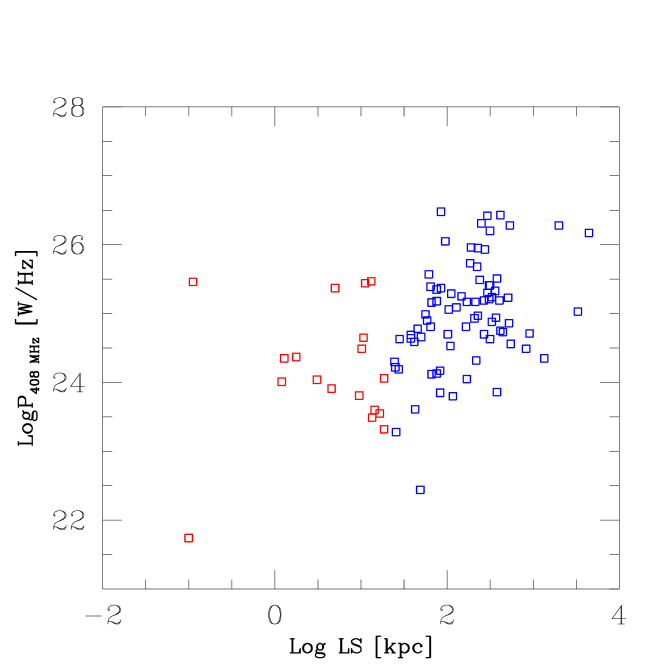
We show in Fig. 12 a radio power vs linear size diagram for the 95 sources of the whole BCS sample. Looking at the radio properties of C BCSs (red squares), some compact sources are in agreement with a general correlation between the linear size and the radio power, and they show a radio power at 408 MHz lower than 1024 W/Hz. However, about half of compact sources show a radio power larger than 1024 W/Hz .i.e. are in the same range of classical extended radio galaxies.
To better investigate the nature and properties of C BCS properties we compared optical and radio data. From Fig. 3, we note at first that the majority of C BCS sources are LEG. Only a couple of exceptions are present. These peculiar compact sources are B2 0648+27 identified with a high rich HI galaxy (Emonts et al. 2006a, 2006b), and 3C 305 identified with a peculiar gas rich galaxy discussed in detail by Massaro et al. 2009. We note that also one FR I BCS is among HEG galaxies. This source studied in details by Giovannini et al. 2005 show evidence of a multi phase radio activity. Recently, it restarted the radio activity and it shows on the parsec scale structures moving with an apparent velocity larger than c. We conclude that for all the 3 cases, the optical type could be explained by the peculiar activity of the source inner region (restarted activity or strong confinement and interaction with the surrounding medium).
From Fig. 4, we point out that C BCS sources show a correlation between total radio power and [OIII] Luminosity in agreement with Core Radio galaxies of Baldi Capetti 2010 and not with FR I radio galaxies. Also the three HEG sources discussed just before are in the same correlation while the few other BCS FR I or FR II sources show the same correlation of 3C radio galaxies. These considerations seem to suggest us that among LEG galaxies two different populations are present according to their radio and [OIII] luminosity: FR I radio galaxies and Core radio galaxies + C BCS. In particular, we note that, at given total radio power, compact sources have an overluminous [O III] emission at a given radio power with respect to HEG and LEG 3CR sources. Moreover, if we consider the core radio power at 5 GHz, compact sources show a different trend with respect to LEG radio galaxies: they are overluminous in optical at low radio power (CoRGs) and with properties similar to 3CR FRI at higher radio power (C BCS). Finally, data suggest that CSS could follow the same trend of compact sources, becoming optically underluminous at very high radio power. A larger statistics is necessary to clarify this point.
To better understand this correlation we take the opportunity of many data available for C BCS sources to investigate their origin.
Among C BCSs, we have quite different sources:
-
•
a source can be compact because of projection effects:
In our sample only one source is clearly oriented at a small angle with respect to the line of sight: B2 1101+38 (Mkn 421, Tab. 6). This source is a well known BL-Lac type object (Giroletti et al.2006) and its size is affected by strong projection effects. We note, that as discussed in Liuzzo et al. 2009b, the percentage of sources oriented at small angle with respect to the line of sight in the BCS is in agreement with unified models prediction.
-
•
a source can be compact because young or restarted activity:
In our sample many sources show evidence of recent nuclear activity as CSO and CSS sources (e.g. B2 0258+35, Tab. 6), or restarted/recurrent activity (e.g. B2 0149+35, Tab. 6). These sources are expected to have a strong interaction with the dense inner ISM (see e.g. B2 1346+26, the BCG in A1795, Tab. 6). Peculiar source is B2 1855+37 which is characterized by a low-no jet emission could be in the final stage of this scenario, and we do not know if it will die or will restart a new radio activity.If we compare these type of compact sources with the extended BCSs with evidence of a restarted (e.g. B2 0331+39, B2 0844+31, B2 1144+35, Tab.6) or dying activity (e.g. B2 1512+30, Tab.6) we do not found any differences in their OIII luminosity and 408 MHz total power.
We note also that on 18 C BCSs, 6 sources are in clusters/groups and they are the BCGs. Literature studies (O’Dea et al. 2001) observed that compact, low power and steep spectrum radio sources in BCGs are not rare. Radio properties of these objects could be explained if nuclear fueling is related to the AGN activity cycle and we can see galaxies in a period of relative AGN quiescence, or just restarted (young). The presence of restarted and cyclic radio activity in such clusters are requested by the cooling scenario (McNamara et al. 2005, and references therein). We claim that the fraction of C BCS sources that are BGCs is considerable, corresponding, as discussed above, to the 1/3 (6/18) of the C BCSs. If we consider the whole BCS sample, the fraction of BGCs is 10/95. Among the 10 BCGs, the majority of them (6/10) are compact BCS sources. This seems to suggest that the strong interaction with the dense ISM of the cluster environment increases the source probability to be compact radiosource, due to frustration effect and/or jet instability. However, optical properties of extended BCGs (see Tab. 6 and Sect. 5) and compact BCGs are similar.
Table 6: Properties of Compact and Extended BCS sources. Name Morphology Optical LLS logP(408) Log Type Notes clas kpc W/Hz (erg/s) B2 0116+31 CSO LEG 0.1 25.46 40.39 young 4C31.04 B2 0149+35 FR I LEG 18.8 23.32 39.10 dying/recurrent BCG in A262 B2 0222+36 C LEG 4.5 23.93 40.71 young/restarted jet instability B2 0258+35 CSS LEG 1.3 24.35 40.38 HI rich frustrated B2 0648+27 C HEG 1.2 24.02 41.58 HI rich frustrated B2 0708+32B FR I ? 10.2 24.49 - young CSO -like B2 0722+30 FR I ? 13.5 23.49 - peculiar Disk galaxy B2 1037+30 CSO LEG 5.0 25.36 40.08 young BCG in A923 B2 1101+38 BL-Lac ? 18 24.39 40.54 orientation MKN421 B2 1217+29 C LEG 0.01 21.75 38.83 HI rich N4278 low power/frustrated 3C 272.1 FR I LEG 14.6 23.59 38.20 young B2 1254+27 FR I LEG 16.7 23.45 39.01 young BCG group B2 1257+28 FRI LEG 9.6 23.81 40.86 frustrated N4874, BCG in Coma B2 1322+36B FR I LEG 18.7 24.07 39.42 young B2 1346+26 FR I LEG 13.2 25.47 40.58 frustrated/jet instability BCG A1795 3C 305 FR I HEG 11.2 25.44 41.05 frustrated B2 1557+26 C LEG 3.1 24.05 39.29 low power/frustrated B2 1855+37 C LEG 10.6 24.75 dying/restarted B2 0331+39 FRI In 70 24.19 - restarted B2 0844+31 FRII LEG 383.2 25.50 40.35 restarted IC 2402 B2 1003+35 FRII LEG 4475 26.12 41.07 restarted 3C 286 B2 1144+35 FRI HEG 839 24.41 41.14 high/low phase B2 1512+30 FRI LEG 38 24.71 40.02 dying B2 1626+39 FRI LEG 61.9 25.56 39.57 3C 338, BCG in A2199 Col.1: names of the sources are listed; Col.2: radio morphologies; Col.3: optical identification, where ? indicates source for which we could give a classification;
Col. 4: Linear size; Col. 5 : Logarithm of total radio power at 408 MHz in units of W/Hz; Col. 6: Log is the logarithm of [OIII] 5007 Å line luminosity in unit of 10-15 erg s-1; in Col.7, it is reported the classification based on our radio and optical analysis; Col. 8 gives some notes on sources properties. -
•
sources in HI-rich galaxies.
Results of Emonts et al. 2006a, 2006b revealed that FRI type lie in a particular region of the HI mass disk/radio power diagram. However, there are sources that differ from FRI type having a large value of HI mass. Studying in details these latter objects, they found that all these are compact sources, even if not all compact sources have large HI mass. Some of our C BCS sources (B2 0648+27, B2 0258+35 and NGC 4278, Tab. 6) show a large amounts of extended HI disk. For these HI rich compact objects Emonts et al. 2006a and 2006b suggest that they do not grow into extended sources because they are frustrated by the ISM in the central region of the galaxy, or because the fuelling stops before the sources can expand. If these H I-rich radio galaxies formed through a major merger of gas-rich galaxies, part of the gas is expelled in large-scale tidal structures, while another part is transported into the central kpc-scale region (e.g. Barnes 2002). The latter could be responsible for frustrating the radio jets if they are not too powerful. Alternatively, while the geometry and the conditions of the encounters appear to be able to form the observed large-scale HI structures, they might not be efficient in channeling substantial amounts of gas to the very inner pc-scale region. This might prevent stable fuelling of the AGN and hence large-scale radio structures do not develop. This hypothesis seems reasonable looking through our C BCSs: evidences that NGC 4278 and B2 0648+27 cannot grow as they are frustrated by the local ISM are present (Giroletti et al. 2005b); while B2 0258+35 displays variable levels of activity, suggestive of inefficient fuelling, to expand beyond the kpc scale (Giroletti et al. 2005b).We found also a slight correlation between the amount of HI mass and the central radio morphology: objects with high HI mass (e.g. B2 0258+35) show more diffuse radio emission in the central region.
Emonts et al. 2006a, 2006b discuss that HI-rich low power compact sources have different formation history from FRIs objects being likely the products of major merger as the detected large amounts of HI demonstrate. In this scenario, it will be interesting to note that in B2 0648+27 and B2 1217+29 the presence of a major merger is clearly confirmed (Emonts et al. 2006a, 2006b).
7 CONCLUSION.
Radio galaxies are classified as FRI, FRII and Compact sources according to their powers and morphologies. Compact objects show emission properties which are not yet well understood. To investigate this peculiar class of sources, we selected from the Bologna Complete Sample (BCS, Giovannini et al. 2001, 2005; Liuzzo et al. 2009b) all objects with a linear size smaller than 20 kpc, forming the C BCS. Part of these targets were previously analyzed by us in the radio band (Giroletti et al. 2005b). Here, we complete the radio analysis of the C BCS sample presenting new high resolution VLA observations for the remaining sources. Moreover, we discuss for the first time all optical available data for C BCSs.
From the comparison between C BCSs and other source samples/extended radiogalaxies, we derive that:
-
•
diagnostic diagrams reveal that with a few exceptions, C BCSs show optical LEG properties as 3CR FR I radio galaxies and CoRGs of Baldi Capetti 2010.
-
•
The optical [OIII] - radio correlations (total and nuclear radio power) suggest a common linear correlation for CoRGs and C BCS sources, different from the known linear correlation of HEG and LEG 3CR radio galaxies, suggesting that C BCSs could be the powerful tail of CoRGs.
A possible continuity with powerful CSS it is not yet clear.
-
•
From our sub-arcsec radio data, the compactness of C BCSs is mostly due to a low source age and/or restarted activity in a gas rich environment (e.g. BCG galaxies and HI-rich galaxies). Projection effects hold in a very few cases in agreement with unified models predictions.
Acknowledgements.
This work was supported by contributions of European Union, Valle D’Aosta Region and the Italian Minister for Work and Welfare. This research has made use of the NASA/IPAC Extragalactic Data Base (NED), which is operated by the JPL, California Institute of Technology, under contract with the National Aeronautics and Space Administration.References
- Abazajian et al. (2009) Abazajian, K. N., Adelman-McCarthy, J. K., Agüeros, M. A., et al. 2009, ApJS, 182, 543
- Anton (1993) Anton, K. 1993, A&A, 270, 60
- Baldi & Capetti (2010) Baldi, R. D., & Capetti, A. 2010, A&A, 519, A48
- Baldwin et al. (1981) Baldwin, J. A., Phillips, M. M., & Terlevich, R. 1981, PASP, 93, 5
- Barnes (2002) Barnes, J. E. 2002, MNRAS, 333, 481
- Baum & Heckman (1989) Baum, S. A., & Heckman, T. 1989a, ApJ, 336, 681
- Baum & Heckman (1989) Baum, S. A., & Heckman, T. 1989b, ApJ, 336, 702
- Blanton et al. (2004) Blanton, E. L., Sarazin, C. L., McNamara, B. R., & Clarke, T. E. 2004, ApJ, 612, 817
- Braine & Dupraz (1994) Braine, J., & Dupraz, C. 1994, A&A, 283, 407
- Buttiglione et al. (2009) Buttiglione, S., Capetti, A., Celotti, A., et al. 2009, A&A, 495, 1033
- Buttiglione et al. (2010) Buttiglione, S., Capetti, A., Celotti, A., et al. 2010, A&A, 509, A6
- Burstein & Heiles (1982) Burstein, D. & Heiles, C. 1982, AJ, 87, 1165
- Burstein & Heiles (1984) Burstein, D. & Heiles, C. 1984, ApJS, 54, 33
- Capetti et al. (2000) Capetti, A., de Ruiter, H. R., Fanti, R., et al. 2000, A&A, 362, 871
- Capetti et al. (2010) Capetti, A., Raiteri, C. M., & Buttiglione, S. 2010, A&A, 516, A59
- Capetti et al. (2011) Capetti, A., Buttiglione, S., Axon, D. J., et al. 2011, A&A, 527, L2
- Cardelli (1989) Cardelli, J. A., Clayton, G. C., & Mathis, J. S. 1989, ApJ, 345, 245
- Condon et al. (1998) Condon, J. J., Yin, Q. F., Thuan, T. X., & Boller, T. 1998, AJ, 116, 2682
- Cotton et al. (1995) Cotton, W. D., Feretti, L., Giovannini, G., et al. 1995, ApJ, 452, 605
- Crawford et al. (1999) Crawford, C. S., Allen, S. W., Ebeling, H., Edge, A. C., & Fabian, A. C. 1999, MNRAS, 306, 857
- Di Matteo et al. (2001) Di Matteo, T., Carilli, C. L., & Fabian, A. C. 2001, ApJ, 547, 731
- Emonts et al. (2006a) Emonts, B. H. C., Morganti, R., Oosterloo, T. A., et al. 2006a, Astronomische Nachrichten, 327, 139
- Emonts et al. (2006b) Emonts, B. H. C., Morganti, R., Tadhunter, C. N., et al. 2006b, A&A, 454, 125
- Emonts et al. (2008) Emonts, B. H. C., Morganti, R., Oosterloo, T. A., et al. 2008, MNRAS, 387, 197
- Fanaroff & Riley (1974) Fanaroff, B. L., & Riley, J. M. 1974, MNRAS, 167, 31P
- Fanti et al. (1986) Fanti, C., Fanti, R., de Ruiter, H. R., & Parma, P. 1986, A&AS, 65, 145
- Fanti et al. (1987) Fanti, C., Fanti, R., de Ruiter, H. R., & Parma, P. 1987, A&AS, 69, 57
- Fanti et al. (1995) Fanti, C., Fanti, R., Dallacasa, D., et al. 1995, A&A, 302, 317
- Feretti & Giovannini (1987) Feretti, L., & Giovannini, G. 1987, A&A, 182, 15
- Feretti et al. (1993) Feretti, L., Comoretto, G., Giovannini, G., Venturi, T., & Wehrle, A. E. 1993, ApJ, 408, 446
- Gelderman & Whittle (1994) Gelderman, R., & Whittle, M. 1994, ApJS, 91, 491
- Gentile et al. (2007) Gentile, G., Rodríguez, C., Taylor, G. B., et al. 2007, ApJ, 659, 225
- Giovannini et al. (2001) Giovannini, G., Cotton, W. D., Feretti, L., Lara, L., & Venturi, T. 2001, ApJ, 552, 508
- Giovannini et al. (2005) Giovannini, G., Taylor, G. B., Feretti, L., et al. 2005, ApJ, 618, 635
- Giovannini et al. (2007) Giovannini, G., Giroletti, M., & Taylor, G. B. 2007, A&A, 474, 409
- Giroletti et al. (2003) Giroletti, M., Giovannini, G., Taylor, G. B., et al. 2003, A&A, 399, 889
- Giroletti et al. (2005) Giroletti, M., Taylor, G. B., & Giovannini, G. 2005a, ApJ, 622, 178
- Giroletti et al. (2005) Giroletti, M., Giovannini, G., & Taylor, G. B. 2005b, A&A, 441, 89
- Giroletti et al. (2006) Giroletti, M., Giovannini, G., Taylor, G. B., & Falomo, R. 2006, ApJ, 646, 801
- Giroletti & Panessa (2009) Giroletti, M., & Panessa, F. 2009, ApJ, 706, L260
- Heckman (1980) Heckman, T. M. 1980, A&A, 87, 152
- Ho et al. (1997) Ho, L. C., Filippenko, A. V., & Sargent, W. L. W. 1997, ApJS, 112, 315
- Jensen et al. (2001) Jensen, J. B., Tonry, J. L., Thompson, R. I., et al. 2001, ApJ, 550, 503
- Keel et al. (2006) Keel, W. C., White, R. E., III, Owen, F. N., & Ledlow, M. J. 2006, AJ, 132, 2233
- Kewley et al. (2006) Kewley, L. J., Groves, B., Kauffmann, G., & Heckman, T. 2006, MNRAS, 372, 961
- Kunert-Bajraszewska et al. (2010) Kunert-Bajraszewska, M., Gawroński, M. P., Labiano, A., & Siemiginowska, A. 2010, MNRAS, 408, 2261
- Laing et al. (1983) Laing, R. A., Riley, J. M., & Longair, M. S. 1983, MNRAS, 204, 151
- Lamer et al. (1999) Lamer, G., Newsam, A. M., & McHardy, I. M. 1999, MNRAS, 309, 1085
- Ledlow & Owen (1996) Ledlow, M. J., & Owen, F. N. 1996, AJ, 112, 9
- Ledlow et al. (1998) Ledlow, M. J., Owen, F. N., & Keel, W. C. 1998, ApJ, 495, 227
- Ledlow et al. (2001) Ledlow, M. J., Owen, F. N., Yun, M. S., & Hill, J. M. 2001, ApJ, 552, 120
- Leeuw et al. (2000) Leeuw, L. L., Sansom, A. E., & Robson, E. I. 2000, MNRAS, 311, 683
- Liuzzo et al. (2009) Liuzzo, E., Taylor, G. B., Giovannini, G., & Giroletti, M. 2009a, A&A, 501, 933
- Liuzzo et al. (2009) Liuzzo, E., Giovannini, G., Giroletti, M., & Taylor, G. B. 2009b, A&A, 505, 509
- Liuzzo et al. (2010) Liuzzo, E., Giovannini, G., Giroletti, M., & Taylor, G. B. 2010, A&A, 516, A1
- Massaro et al. (2009) Massaro, F., Chiaberge, M., Grandi, P., et al. 2009, ApJ, 692, L123
- McHardy et al. (1994) McHardy, I. M., Merrifield, M. R., Abraham, R. G., & Crawford, C. S. 1994, MNRAS, 268, 681
- McNamara et al. (2005) McNamara, B. R., Nulsen, P. E. J., Wise, M. W., et al. 2005, Nature, 433, 45
- Morganti et al. (1992) Morganti, R., Ulrich, M.-H., & Tadhunter, C. N. 1992, MNRAS, 254, 546
- Morganti et al. (1997) Morganti, R., Tadhunter, C. N., Dickson, R., & Shaw, M. 1997, A&A, 326, 130
- Morganti et al. (2003) Morganti, R., Oosterloo, T. A., Capetti, A., et al. 2003, A&A, 399, 511
- Murgia et al. (1999) Murgia, M., Fanti, C., Fanti, R., et al. 1999, A&A, 345, 769
- Murgia (2003) Murgia, M. 2003, PASA, 20, 19
- Nagar et al. (2000) Nagar, N. M., Falcke, H., Wilson, A. S., & Ho, L. C. 2000, ApJ, 542, 186
- Nagar et al. (2001) Nagar, N. M., Wilson, A. S., & Falcke, H. 2001, ApJ, 559, L87
- O’Dea (1998) O’Dea, C. P. 1998, PASP, 110, 493
- O’Dea et al. (2001) O’Dea, C. P., Koekemoer, A. M., Baum, S. A., et al. 2001, AJ, 121, 1915
- Parma et al. (1986) Parma, P., de Ruiter, H. R., Fanti, C., & Fanti, R. 1986, A&AS, 64, 135
- Perlman et al. (2001) Perlman, E. S., Stocke, J. T., Conway, J., & Reynolds, C. 2001, AJ, 122, 536
- Polatidis & Conway (2003) Polatidis, A. G., & Conway, J. E. 2003, PASA, 20, 69
- Punch et al. (1992) Punch, M., Akerlof, C. W., Cawley, M. F., et al. 1992, Nature, 358, 477
- Readhead et al. (1996) Readhead, A. C. S., Pearson, T. J., Taylor, G. B., & Wilkinson, P. N. 1996, Extragalactic Radio Sources, 175, 88
- Sanghera et al. (1995) Sanghera, H. S., Saikia, D. J., Luedke, E., et al. 1995, A&A, 295, 629
- Stanghellini et al. (2005) Stanghellini, C., O’Dea, C. P., Dallacasa, D., et al. 2005, A&A, 443, 891
- Urry & Padovani (1995) Urry, C. M., & Padovani, P. 1995, PASP, 107, 803
- Véron-Cetty & Véron (2001) Véron-Cetty, M. P., & Véron, P. 2001, A&A, 375, 791
- van Breugel et al. (1984) van Breugel, W., Miley, G., & Heckman, T. 1984, AJ, 89, 5
- Wilkinson et al. (1998) Wilkinson, P. N., Browne, I. W. A., Patnaik, A. R., Wrobel, J. M., & Sorathia, B. 1998, MNRAS, 300, 790
- Zhang et al. (2003) Zhang, J.-S., Lin, R.-G., & Fan, J.-H. 2003, Publications of the Yunnan Observatory, 95, 98