ISSN 1225-1534 (Print)
DOI : 10.5303/PKAS.2012.27.3.01
Publications of the Korean Astronomical Society 27: 1 2, 2012 \small{c}⃝ 2012. The Korean Astronomical Society. All Rights Reserved.
AKARI FAR-INFRARED ALL-SKY SURVEY MAPS
Yasuo Doi1
Shinya Komugi2
Mitsunobu Kawada2
Satoshi Takita2
Ko Arimatsu2
Norio Ikeda2
Daisuke Kato2
Yoshimi Kitamura2
Takao Nakagawa2
Takafumi Ootsubo3
Takahiro Morishima3
Makoto Hattori3
Masahiro Tanaka4
Glenn J. White5,6
Mireya Etxaluze5,6,7
and
Hiroshi Shibai8
1. Department of Earth Science and Astronomy, the University of Tokyo, Tokyo 153-8902, Japan, 2. Institute of Space and Astronautical Science, Japan Aerospace Exploration Agency, Kanagawa 252-5210, Japan 3. Astronomical Institute, Tohoku University, Miyagi 980-8578, Japan, 4. Center for Computational Sciences, University of Tsukuba, Ibaraki 305-8577, Japan, 5. Department of Physical Sciences, The Open University, Milton Keynes MK7 6AA, England, 6. RALSpace, The Rutherford Appleton Laboratory, Chilton, Didcot, Oxfordshire OX11 0NL, England, 7. Centro de Astrobiología (CSIC/INTA), Instituto Nacional de Técnica Aeroespacial, Madrid Spain, 8. Department of Earth and Space Science, Osaka University, Osaka 560-0043, Japan
E-mail: doi@ea.c.u-tokyo.ac.jp
(Received July 1, 2012; Accepted ????)
\begin{center}{\bf{\smallABSTRACT}}\end{center}
Far-infrared observations provide crucial data for the investigation and characterisation of the properties of dusty material in the Interstellar Medium (ISM), since most of its energy is emitted between 100 and 200 m.
We present the first all-sky image from a sensitive all-sky survey using the Japanese AKARI satellite, in the wavelength range 50 – 180 m.
Covering % of the sky in four photometric bands with four filters centred at 65 m, 90 m, 140 m, and 160 m wavelengths, this achieved spatial resolutions from 1 to 2 arcmin and a detection limit of MJy sr-1, with absolute and relative photometric accuracies of %.
All-sky images of the Galactic dust continuum emission enable astronomers to map the large-scale distribution of the diffuse ISM cirrus, to study its thermal dust temperature, emissivity and column density, and to measure the interaction of the Galactic radiation field and embedded objects with the surrounding ISM.
In addition to the point source population of stars, protostars, star-forming regions, and galaxies, the high Galactic latitude sky is shown to be covered with a diffuse filamentary-web of dusty emission that traces the potential sites of high latitude star formation.
We show that the temperature of dust particles in thermal equilibrium with the ambient interstellar radiation field can be estimated by using 90 m, 140 m, and 160 m data.
The FIR AKARI full-sky maps provide a rich new data set within which astronomers can investigate the distribution of interstellar matter throughout our Galaxy, and beyond.
key words: Surveys – Atlases – ISM: general – Galaxy: general – Galaxies: general – Infrared: ISM – Infrared: galaxies
1. INTRODUCTION
Infrared continuum emission is ubiquitously observed across the celestial sky and is attributed to the thermal emission from interstellar dust particles. The spectral energy distribution (SED) of the dust continuum emission has been observed for various astronomical objects including diffuse interstellar medium, star-forming regions and galaxies. The dust continuum SED has its peak at far-infrared (30–300 m; FIR) wavelengths, with approximately two thirds of the energy being radiated at m (Draine 2003; also see Compiègne et al. 2011). Since the stellar radiation is mainly absorbed by large grains (LGs) in interstellar space, and converted to FIR continuum emission, it is important to measure the total FIR continuum emission energy as it is a good tracer of total stellar radiation energy and thus a good indicator of the star-formation activity (Kennicutt 1998). The modified black-body spectrum of temperature 15 – 30 K has its peak at 100 – 200 m. It is thus essential to observe the FIR continuum, including this wavelength range, to measure the total FIR emission energy from LGs to trace the star-formation activity.
An all-sky survey of FIR continuum was pioneered by the IRAS satellite (Neugebauer et al. 1984), which was, until the completion of the AKARI mission, the only available FIR all-sky survey with high spatial resolution. Given the importance of the FIR photometric data, it is valuable to upgrade the data by improving spatial resolution, and by adding more photometric bands, especially at longer wavelengths.
For that purpose, we performed new all-sky survey observations with AKARI (Murakami et al. 2007). In this paper, we describe the quality of the image data and its capability to investigate spatial distribution of ISM and its SED with improved spatial resolutions for the whole sky.
2. Observation and Data Reduction
The AKARI satellite (Murakami et al. 2007) was launched in February 2006 and the all-sky survey was performed between March 2006 – August 2007, which was the cold operational phase of the satellite with liquid Helium cryogen. The all-sky survey observations in FIR wavebands were carried out by using an FIR instrument called the Far-Infrared Surveyor (FIS: Kawada et al. 2007), which covered the 50 – 180 m waveband (Kawada et al. 2007).
Four photometric bands are used for the all-sky survey. Two of four bands had a broader wavelength coverage and continuously covered the whole waveband range: the WIDE-S band (50–110 m, centred at 90 m) and the WIDE-L band (110–180 m, centred at 140 m). The other two bands had narrower wavelength coverage and measured both the shorter and the longer ends of the wavebands: the N60 band (50–80 m, centred at 65 m) and the N160 band (140–180 m, centred at 160 m).
The observed fraction of the sky during the survey period (the cold operational phase) is tabulated in Table 1. About 97 % of the sky was multiply surveyed in the four photometric bands.
Table 1.
Scan coverage of the survey observations
Spatial scans
Single
Multiple
Unscanned
N60
99.1%
96.9%
60.3%
13.5%
0.9%
Wide-S
99.1%
97.0%
61.0%
13.8%
0.9%
Wide-L
99.5%
98.4%
78.7%
25.9%
0.5%
N160
99.5%
98.4%
76.8%
24.1%
0.5%
4 bands
99.1%
96.8%
60.0%
13.2%
0.9%
The data obtained during the observations was pre-processed using the AKARI pipeline tool, which was originally optimised for point source extraction (Yamamura et al. 2009). Following this initial pre-processing, a separate pipeline was then used to recover the large-scale spatial structures accurately. The main properties of the diffuse mapping pipeline are: 1) transient response correction of the detector signal, 2) subtraction of zodiacal emission, 3) image processing, 4) image destriping, and 5) recursive deglitching and flat-fielding of processed image. Processes 1) and 2) were performed on the time-series data and 3) – 5) were performed on the image plane data. The details of these procedures are found in Doi et al. (2009) and Doi et al. (2012).
3. Results
Intensity maps from the all-sky survey in the four photometric bands are shown in Fig. 1.
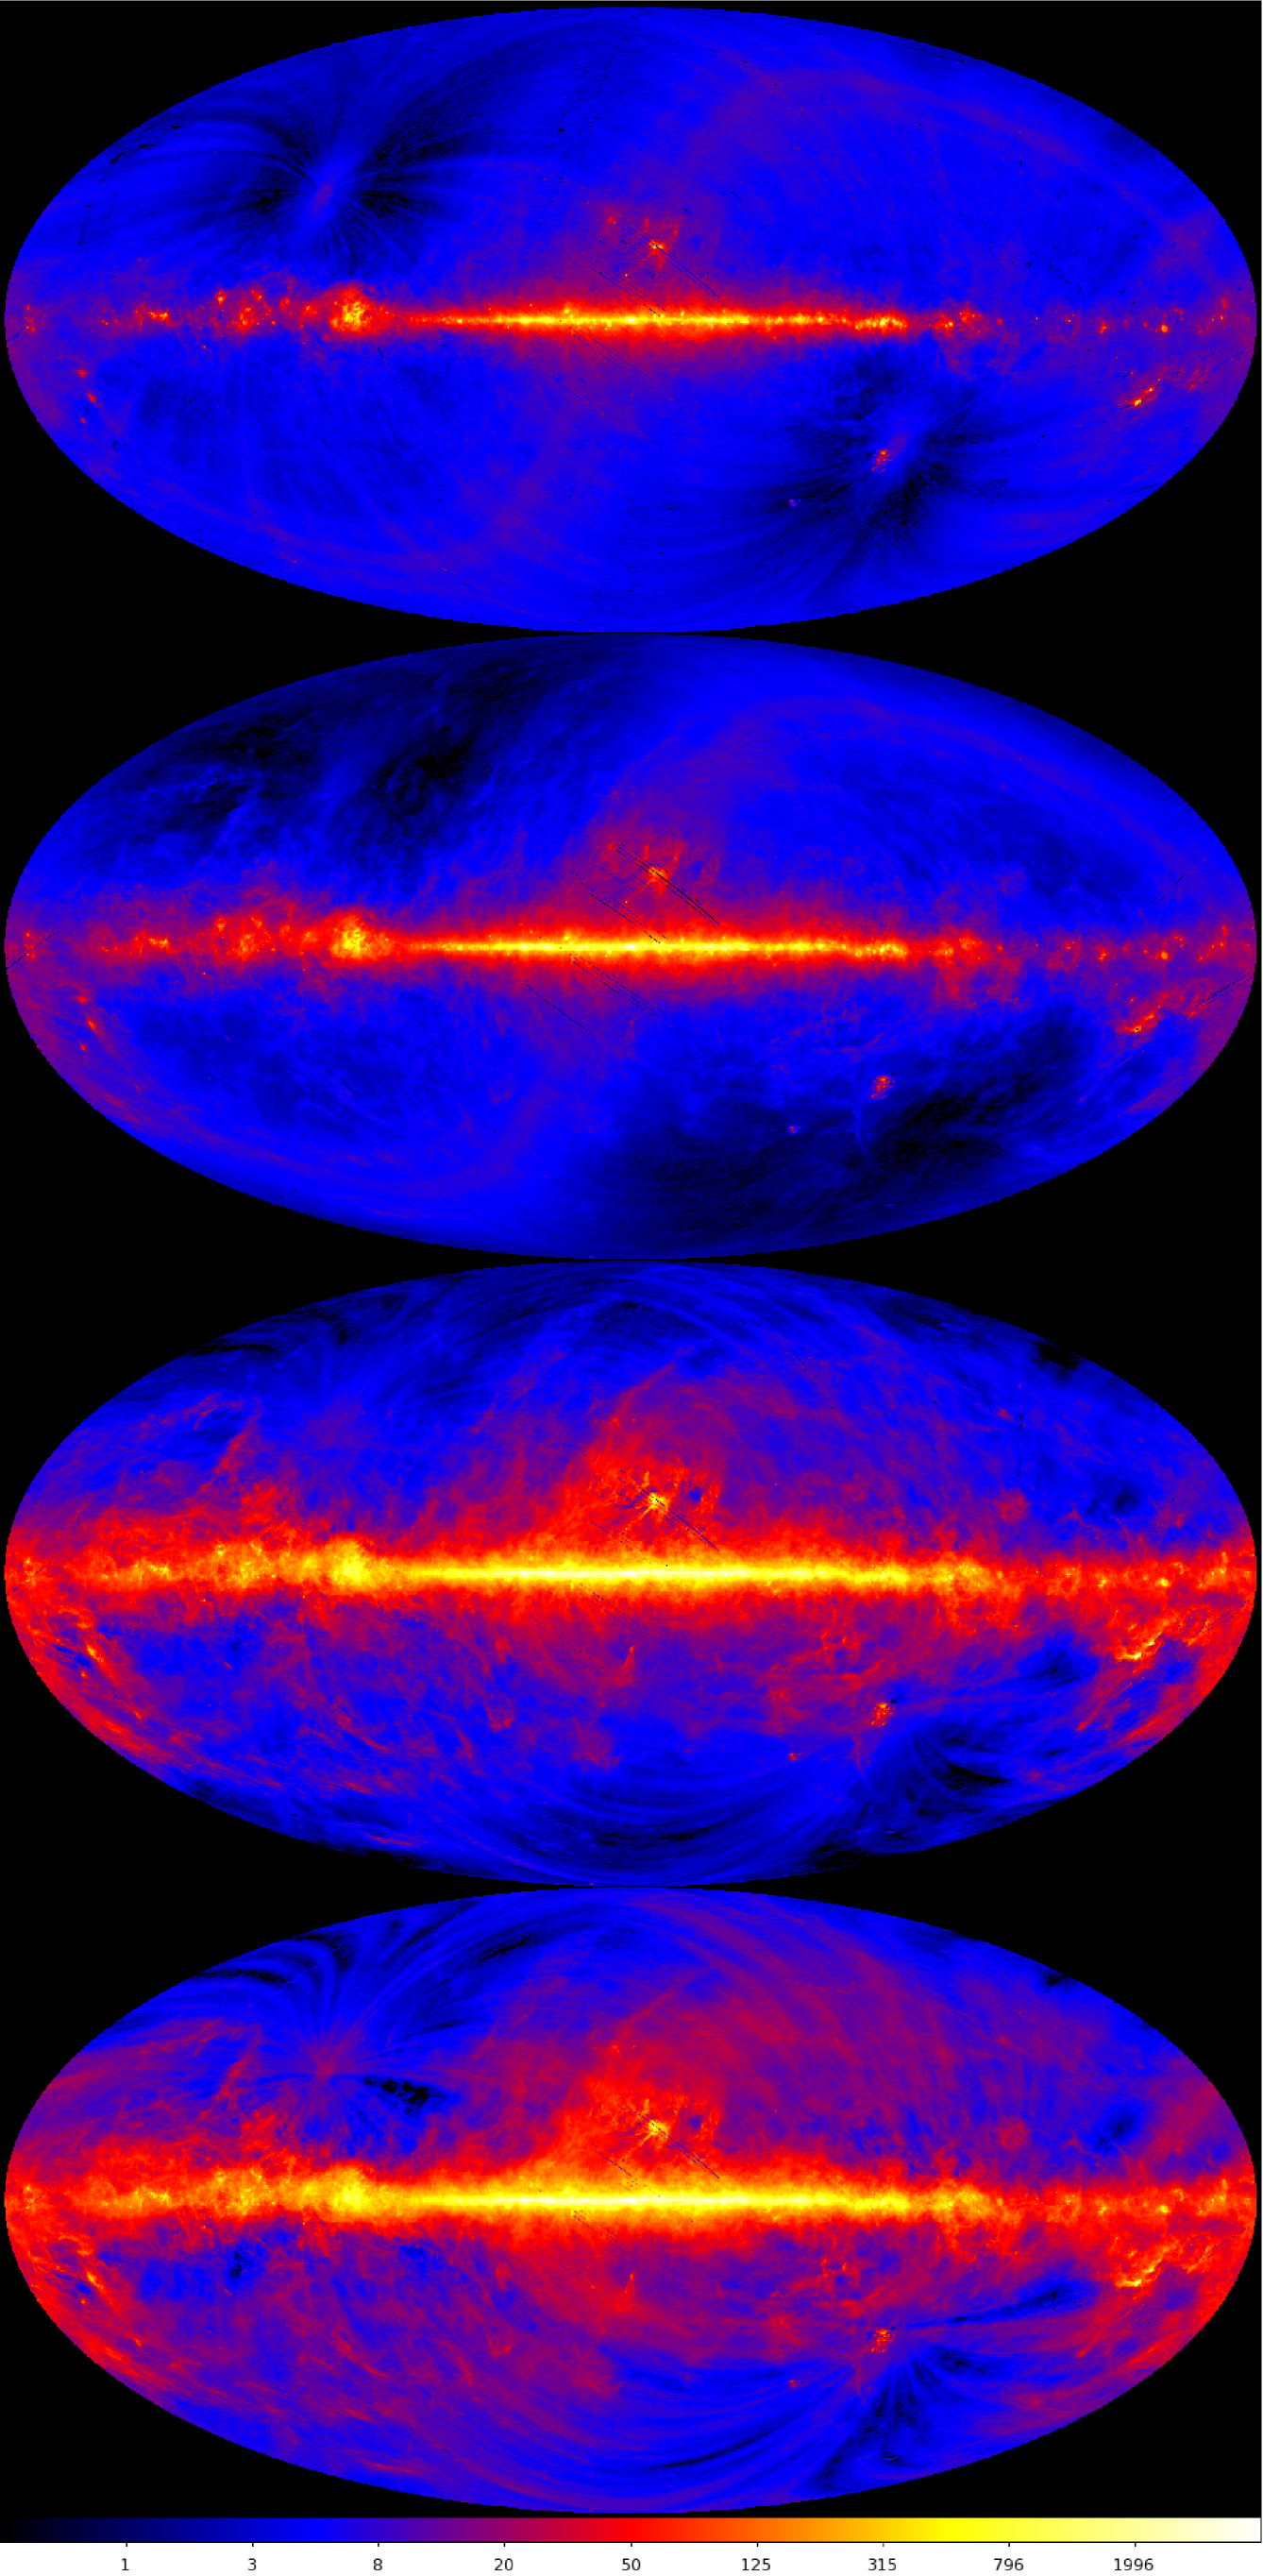
Detailed photometry with high spatial resolution has been achieved for the whole sky. The overall spatial distribution shows a clear wavelength dependence. The intensity distributions of the emission in shorter wavelengths (65 m & 90 m) show the concentrated distribution on the Galactic plane, indicating a tight correlation with star-formation activity by tracing high ISRF regions at and around star-formation regions. On the other hand, relatively intense diffuse emission is found in emission at longer wavelengths (140 m & 160 m), especially from the regions at high Galactic latitudes. Emission from lower temperature dust in high latitude cirrus clouds is thus well traced by longer wavelength observations and the ISM total mass distribution is well traced by these observations.
Zodiacal emission has been subtracted from the images and the residual emission can be noticed in shorter wavelength images. The residual emission is attributed to the Zodiacal dust bands, as we only subtract a spatially smooth component of the Zodiacal emission and do not subtract the emission with smaller scale structures. Taking advantage of the higher spatial resolutions of the AKARI full-sky images, we will investigate these structures down to arc-minute spatial scales to model and discriminate them from other astronomical emissions (Ootsubo et al. 2012).
We have primarily calibrated the data using the more sensitive slow-scan data (Shirahata et al. 2009), as the spatial scan speeds are slow enough so that the data have better sensitivity and are virtually not affected by the transient response of the detector. Komugi et al. (2012) estimate the 1- detection limit of the survey data as 12 MJy sr-1, 2 MJy sr-1, 7 MJy sr-1, and 4 MJy sr-1 for N60, WIDE-S, WIDE-L, and N160 bands, respectively. The efficacy of the linearity correction of the detector signal was also checked with slow scan images that observed the same position in the sky and is not affected by the detector transient response due to its longer integration time. We confirm that a good linearity correction has been achieved for all the bands, from the faintest detector signals up to the bright signals around the Galactic center of [GJy sr-1], with relative accuracy of . It is important to note that the good linearity correction achieved for the data also confirms the successful correction of the spatial distortion of the data caused by the transient response of the detector. The linearity and absolute intensity have been checked with other IR observations by ISOPHOT (Kessler et al. 1996), IRAS/IRIS (Miville-Deschênes & Lagache 2005), and COBE/DIRBE (Hauser et al. 1998). Takita et al. (2012) concluded that the correlation of AKARI survey data with other FIR data confirms the reliable calibration.
4. Discussion
The aim of our survey observation is twofold, 1) to obtain the global distribution of ISM with higher spatial resolutions, and 2) to study the SEDs and to evaluate the colour temperature of LGs with multi-band photometry that has good wavelength coverage. In the following discussion, we investigate the characteristics of the survey data from these two viewpoints.
4.1. Spatial Power Spectra
One of the key characteristics of the AKARI FIR survey is its large dynamic range that enables simultaneous recovery of both large scale spatial structures and more localised small scale variations of the FIR emission. This characteristic can be examined by calculating the spatial power spectra of the cirrus distribution taken from the AKARI diffuse all sky survey, as the cirrus power spectra can be well represented by power-law spectra (see e.g., Miville-Deschênes et al. 2010; Martin et al. 2010).
Miville-Deschênes et al. (2010) derived the IRAS/IRIS 100 m and Herschel/SPIRE 250 m combined spatial power spectrum at the Polaris flare region and confirmed that the power-law nature of the cirrus power spectrum is kept down to sub-arcminute scales, with a power-law index on scales (also see Martin et al. 2010). Since the Polaris flare is a high Galactic latitude cirrus cloud with virtually no sign of star-formation activity (Martin et al. 2010), the region is well suited to assess the nature of the cirrus power spectrum.
The AKARI FIR image of the Polaris flare region and its spatial power spectra are shown in Figs. 2 & 3.
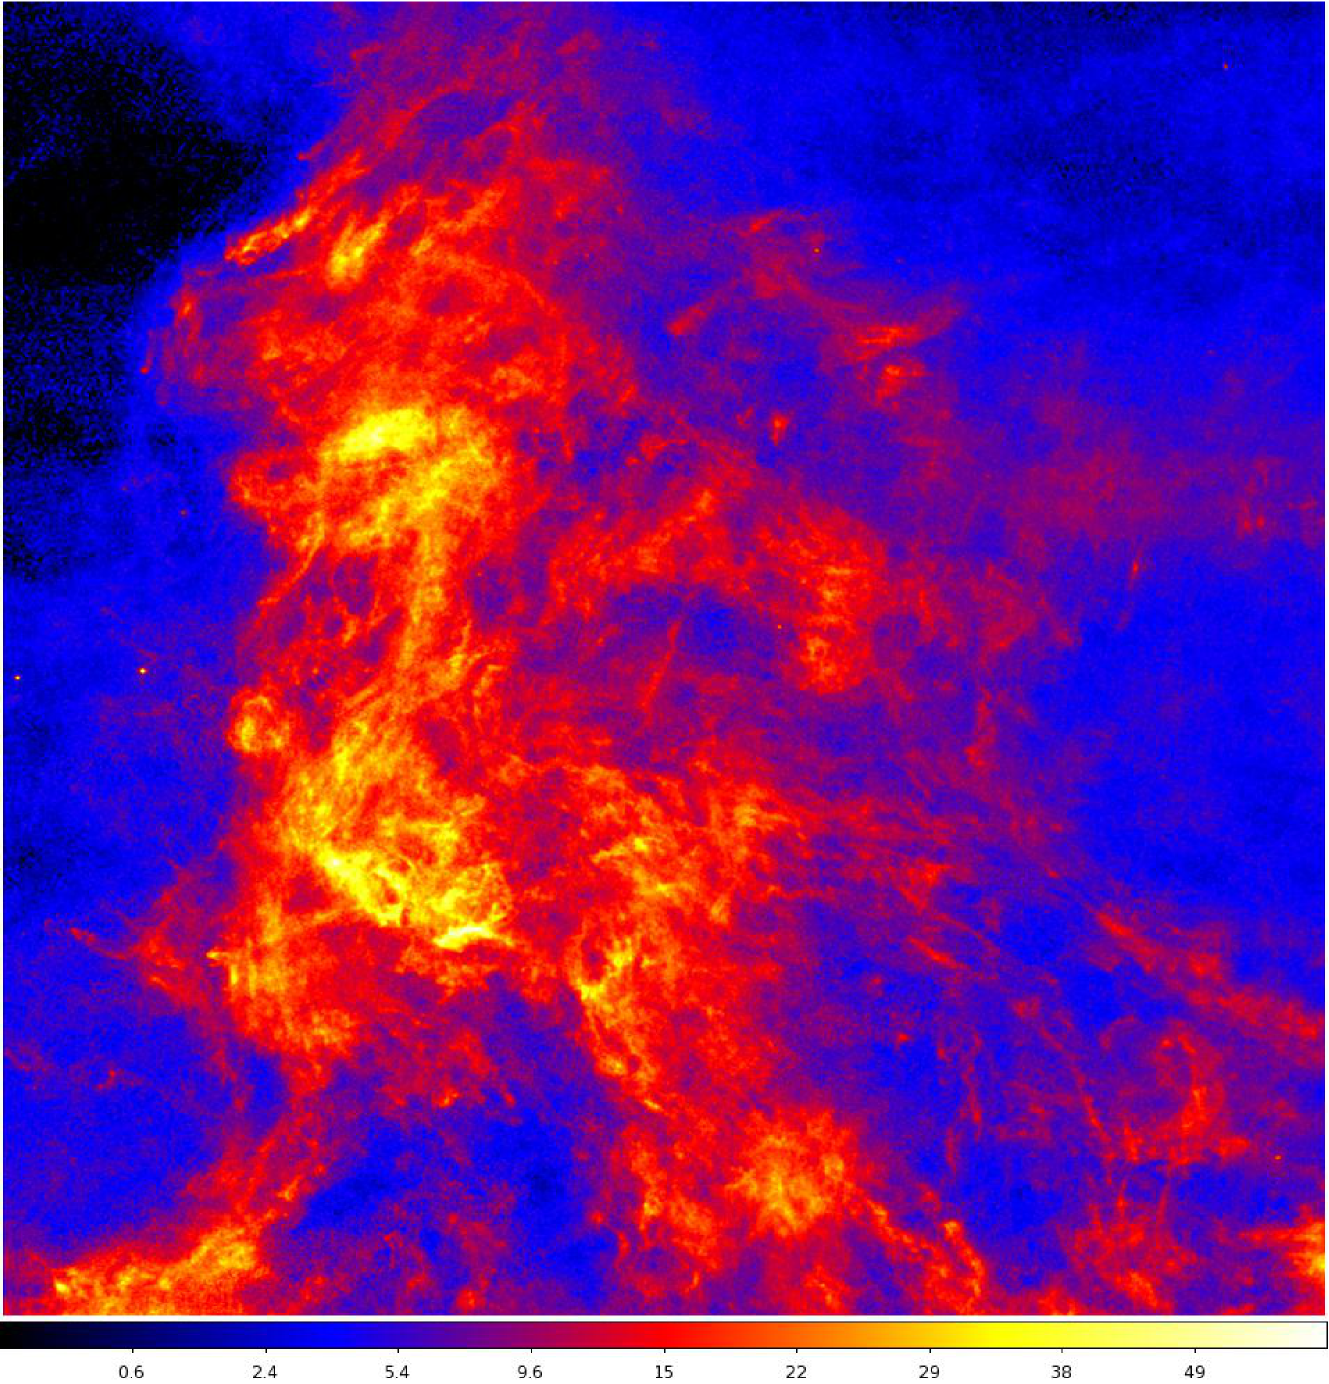
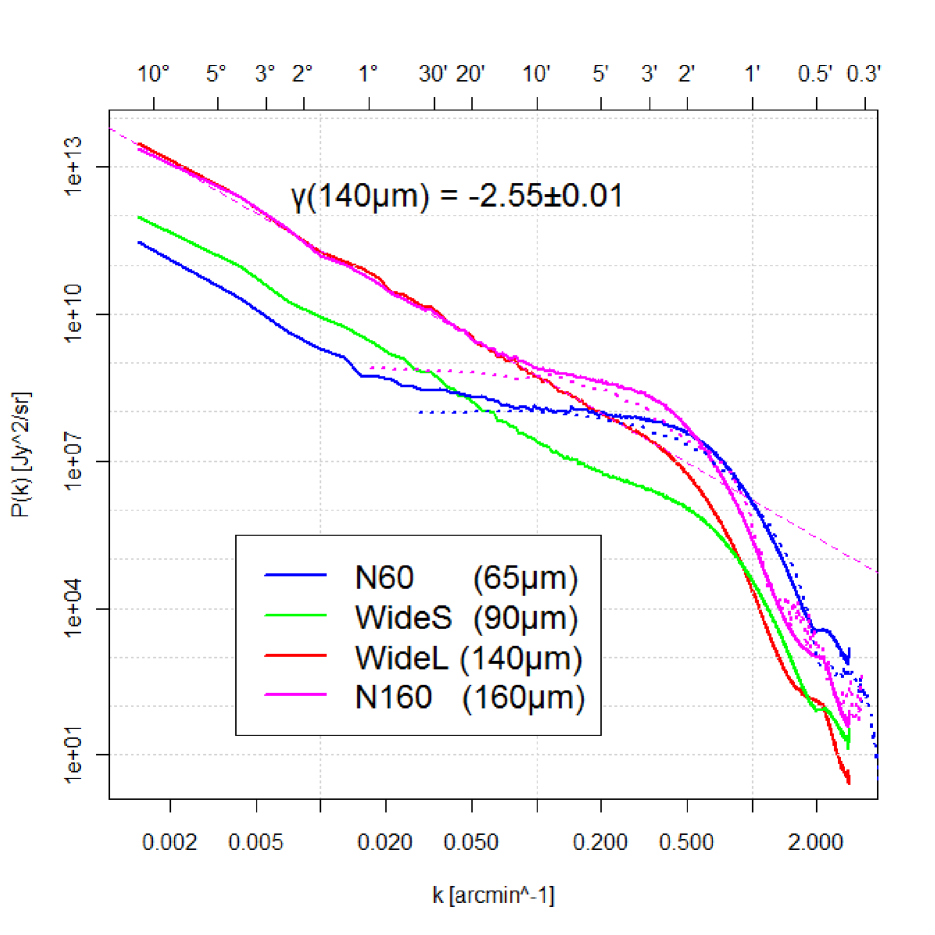
The cirrus spectrum can be represented by a single power-law, as indicated by many other authors (Miville-Deschênes et al. 2010 and the references therein). The power law indices are identical for the four wavebands. It is estimated as by fitting the 140 m spectrum in – [arcmin-1] wavenumber range, and the estimated is consistent with that by Miville-Deschênes et al. (2010) within the range of error. The spectra clearly show the wide dynamic range of our observation, as the spatial power component is well retrieved from large scale distribution to small scale structures at 140 m and even smaller structures at 90 m.
On the other hand, excess components in the power spectrum are found at the high spatial frequencies in the two narrow bands (N60 & N160). This is due to the higher noise levels of these two bands compared to the wide bands (WIDE-S & WIDE-L). The spatial dynamic range of the narrow bands is thus limited for the faint cirrus component. Better recovery of these high frequency spatial component of fainter regions could be obtained by adjusting the correction function of the detector transient response, as the correction is primarily an amplification of the high spatial frequency component and thus causes excess noise at fainter regions (see Doi et al. 2009). This adjustment will be considered in a future update of the image data.
4.2. Spectral Energy Distribution
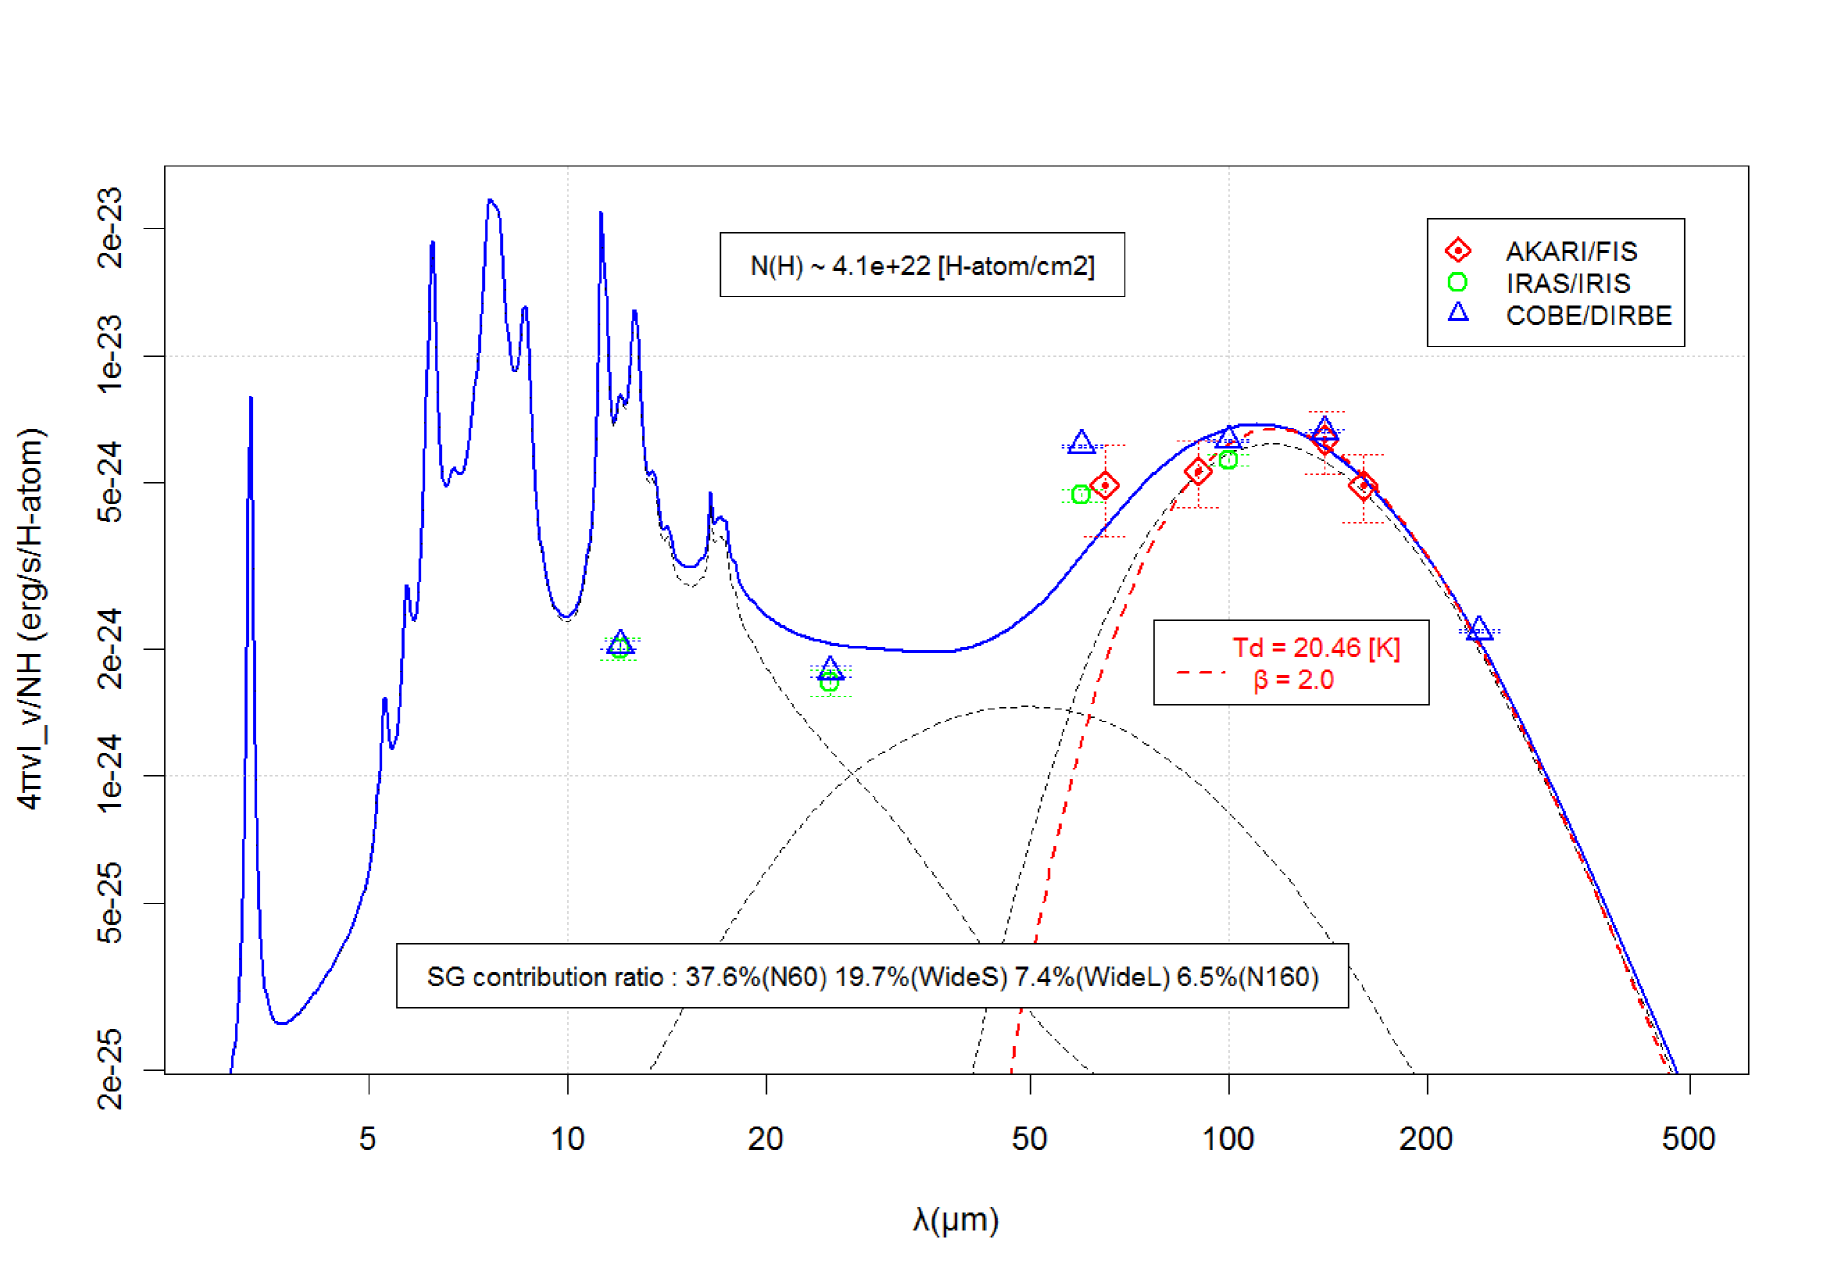
Another key aspect of the AKARI FIR survey is its resolution of the spectral peak of the dust SED with four wavebands. Figs. 4 & 5 show the intensity distribution of the Cygnus X region and its SED at the centre of the region (, ). Ancillary data at the same position by IRAS/IRIS (Miville-Deschênes & Lagache 2005) and COBE/DIRBE (Hauser et al. 1998) and their spatial variation within the DIRBE beam are also shown. The AKARI data have the largest spatial variation because of higher spatial resolutions.
Good coincidence between AKARI and the ancillary data is found. The intensity at 140m is the highest, confirming that the peak of dust SED is well covered by the AKARI data. WIDE-S, WIDE-L, N160 and ancillary data at m are well fit with a modified blackbody of T [K] and , indicating that the AKARI FIR data can be a good tracer of the temperature and the total amount of LGs. Since AKARI has higher spatial resolution comparing to other all-sky survey observations as well as huge spatial dynamic range at this wavelength range, we can make a detailed investigation of the spatial distribution of temperature, and the total amount of LGs.
On the other hand, the N60 observations, and other data at m show significant excess from a modified blackbody, indicating a significant contribution from either higher temperature LGs along the line of sight or stochastically heated small grains (SGs). A fit using the DustEM SED model by Compiègne et al. (2011) with an assumption of uniform incident radiation is also shown in Fig. 5. A significant contribution to the ratio of emission from SGs to the total observed intensity is estimated from the model, not only for N60 (38%), but also for WIDE-S (20%). Hence it is important to note that the colour temperature could overestimate the dust temperature, though the ambiguity is much smaller than the widely referred to issues with the IRAS colour temperature.
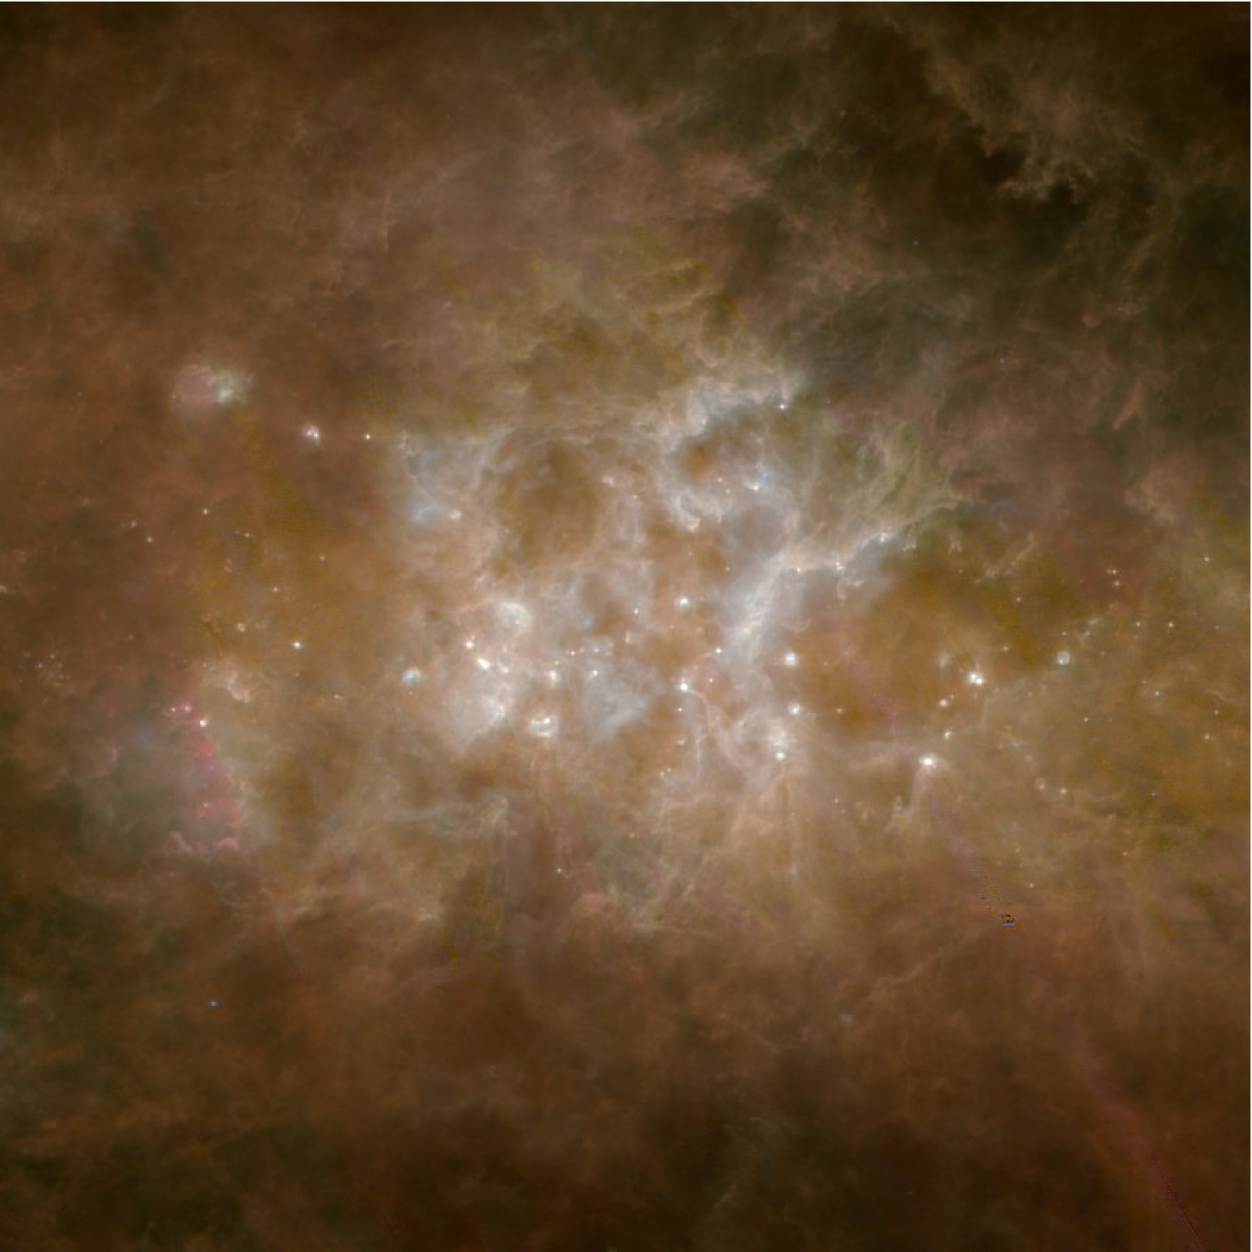
The shorter wavelength excess emission is, however, not completely explained by the modelled emission from small dust particles with uniform irradiation. Temperature variation of dust particles, or intensity variations of interstellar radiation field, along the line of sight also should be taken into account. The wealth of spatial structures and colour variations shown in Fig. 4 clearly indicate the complexity of the ISM and its irradiation environment. The newly achieved AKARI FIR high-spatial resolution images of the whole sky should be a powerful tool to investigate the detailed spatial structure of ISM and its physical environment.
5. Conclusion
We have processed a full sky image of the FIR AKARI survey at m, m, m and m. The images achieve a detection limit of MJy sr-1 with absolute and relative photometric accuracies of %. Together with the % coverage of the whole sky, the high spatial resolution of the FIR AKARI survey from 1 to 2 arcmin achieves an unprecedented spatial dynamic range of . A good wavelength coverage from 50m to 180m with four photometric bands makes the data a good tracer of temperature and the total amount of the dust component in the ISM. The wealth of spatial structures and SED variations found in the image clearly indicate the complexity of the ISM and its irradiation environment. The FIR AKARI image is a new powerful tool to investigate the detailed nature of ISM from small scales to the full sky.
REFERENCES
References
- [1]
- [2]
- [3]
- [4]
- [5]
- [6]
- [7]
- [8]
- [9]
- [10]
- [11]
- [12]
- [13]
- [14]
- [15]
- [16]
- [17]
- [18]
- [19]
- [20]
- [21]
- [22]