L. Sun (on behalf of the BABAR and Belle collaborations)
University of Cincinnati, Cincinnati OH 45221, USA
Abstract
In this talk, a wide range of recently published results on rare decays from BABAR and Belle are
covered. The decays of , , and
lepton-number violation in decays are measured for new physics searches.
I Introduction
By 2008 and 2010, BABAR and Belle completed data-taking respectively.
Both factories produced pairs at the resonance with
asymmetric-energy colliders. These pairs were collected with
BABAR and Belle detectors. Both detectors share similar designs
and provide good discrimination on charged particles, especially for
/. Muons are also differentiated from charged hadrons.
High-energy photons and electrons are precisely measured
with electro-magnetic calorimeters in both detectors.
The BABAR and Belle collaborations continue to produce interesting results on rare decays.
Based on 471 million pairs from BABAR this talk presents transition rates and photon energy spectrum
using a sum of exclusive modes, rates and asymmetries in
exclusive decays, and
a search for lepton-number violation (LNV) processes in decays111Charge conjugation is implied throughout except as explicitly
noted.. In addition, this talk presents a search for LNV processes in decays
based on 773 million pairs from Belle.
II Transition Rates and Photon Energy Spectrum with
a Sum of Exclusive Modes
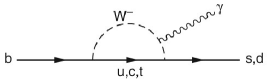
The transitions are flavor-changing neutral-current (FCNC) processes
and forbidden at tree level in the Standard Model (SM). The leading-order
radiative penguin diagram for this type of transition is
shown in Figure 1.
For photon energy , the SM-based prediction for
the decay rate is at Misiak:2006zs , with as
the hadronic final state with strangeness.
This prediction is in good agreement with the current world average of
experimental results at for the same photon energy
cutoff at HFAG . Here
the second uncertainty comes from the extrapolation of the photon energy
shape function from the experimental photon energy to the 1.6 cutoff.
New physics beyond the SM may enter the radiative loop of and alter the decay
rate significantly. Therefore comparing the experimental results
and SM-based predictions provides a good test of the SM.
Furthermore, the photon energy spectrum is important for us to understand
the quark momentum distribution inside the meson. The shape
of this distribution is a critical input to the determination of the CKM matrix element in inclusive charmless semileptonic B decays.
The measured energy spectrum can be fit to different models in order
to find the best values of and
as the heavy quark effective theory (HQET) parameters.
Figure 1: The leading order Feynman diagram for the transition in the SM. btosgbabar
This BABAR analysis btosgbabar reconstructs the system in 38 different
exclusive final states listed in
Table 1. With the reconstructed system,
the energy of the transition photon in the rest frame
is thus accessible through:
(1)
where and are the invariant masses of
the meson and of the hadronic system, respectively.
Table 1: The 38 final states for used in this analysis. Here
is reconstructed through . btosgbabar
Mode No.
Final State
Mode No.
Final State
1
20
2
21
3
22
4
23
5
24
6
25
7
26
8
27
9
28
10
29
11
30
12
31
13
32
14
33
15
34
16
35
17
36
18
37
19
38
In each event, this analysis requires
at least one photon candidate with in the center-of-mass (CM) frame. This analysis also requires
to be
within a range of 0.6 and 2.8 , and divides this range into 18 bins.
These 18 bins include 14 bins each with a width of 100 for ,
and 4 bins each with a width of 200 for .
Common to all other BABAR analyses,
the beam-energy substituted mass is defined, where and are the beam energy and
the meson momentum in the CM frame, respectively.
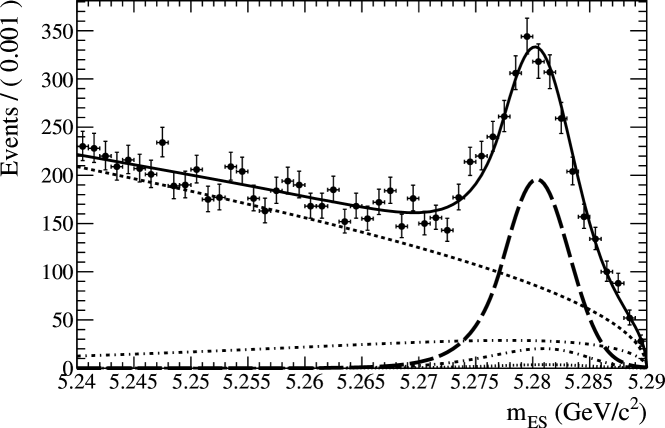
In each bin, the distribution is fit to extract the signal
yield. An example of the fit for is shown in
Fig. 2.
Figure 2: BABAR: fit example in the region 1.4 1.5 . Shown
are data (points with error bars) along with the total fit (solid curve),
signal (thick dashed curve), and different background contributions (other curves, see Ref. btosgbabar for
detailed description).
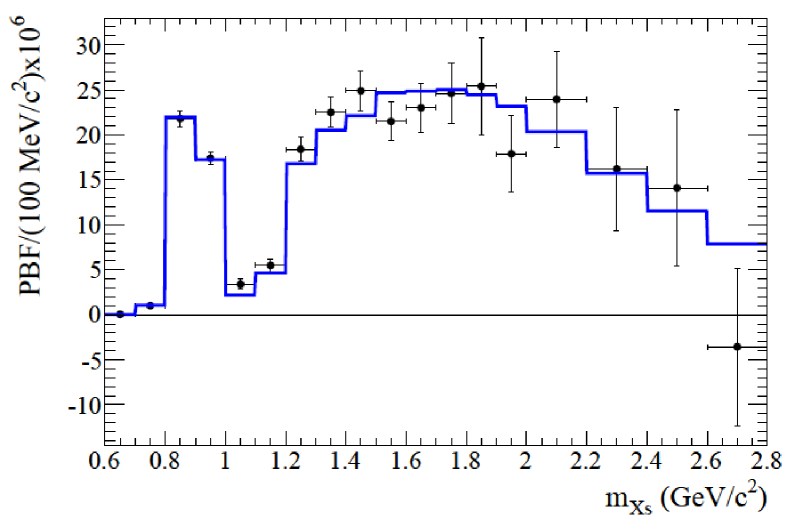
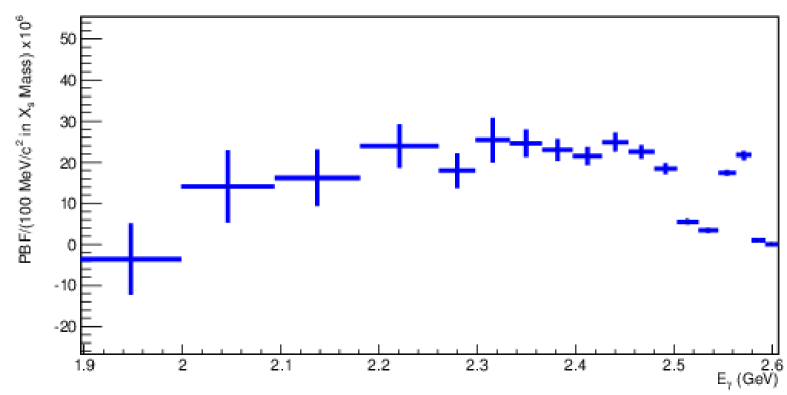
Figure 3 shows the measured partial branching
fractions in the 18 bins, as well as in the corresponding
bins. The measured spectrum is fit with two different models: the “kinetic model” Benson:2004sg and “shape function model” Lange:2005yw , to find
the best values for
and as summarized in Table 2.
These numbers are compatible with the world averages for these two models HFAG
also listed in Tables 2. Figure 3 also
shows the fit with the kinetic model as an example.
By combining the partial branching fraction results, the total branching
fraction for is , where the first and second uncertainties
are statistical and systematic, respectively.
Figure 3: BABAR: Top: Measured partial branching fractions (points with error bars) in the 18 bins,
with the spectrum fit using the kinetic model (solid line). Bottom: Measured partial branching fractions (points with error bars) in the
corresponding photon energy bins. All the error bars shown here include the statistical and systematic uncertainties added
in quadrature. btosgbabar
Table 2: The best fit HQET parameter values based on the measured spectrum,
are compared to the world averages (“HFAG”). btosgbabar
Kinetic model
Shape function model
()
HFAG:
()
HFAG:
III Exclusive Decays
Similar to , the FCNC processes are also forbidden
at tree level in the SM. The decays are allowed in
the loop and box diagrams as shown in Fig. 4 with
branching fractions at about . The effective Hamiltonian
for these decays factorizes short-distances contributions represented
by the Wilson coefficients from long-distance effects. Three effective
Wilson coefficients are relevant here: from the electromagnetic
penguin diagram, and
from the vector part and the axial-vector part of the penguin
and box diagrams, respectively Buchalla .
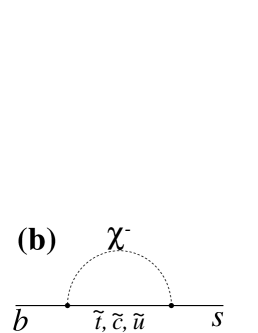
New physics may bring in new loops involving
particles such as charged Higgs, squarks, neutralinos, and charginos
particles as depicted in
the bottom of Figure 4.
These loop contributions may be comparable to the SM ones, and
alter the effective
Wilson coefficient values from their SM expectations isospin .
Figure 4: Top: Lowest-order Feynman diagrams for in the SM.
Bottom: Examples of new physics loop contributions to : (a) charged Higgs (); (b) squark () and chargino (); (c) squark () and gluino ()/neutralino (). kllpaper
In this BABAR analysis, signal events are reconstructed in eight final states with
an or pair, and a , , ,
or , where a candidate
is reconstructed in the
final state. Another final state is included only for the
angular measurements introduced in Sect. III.2.
Selected candidates are also required to have an invariant
mass of .
The measurements are performed in six bins of di-lepton mass squared :
, , ,
, , and .
In the analysis, two regions are vetoed to minimize the and contributions.
The binning choices are largely consistent with those used in the Belle belle09 ,
CDF cdf11 , and LHCb lhcb11 experiments.
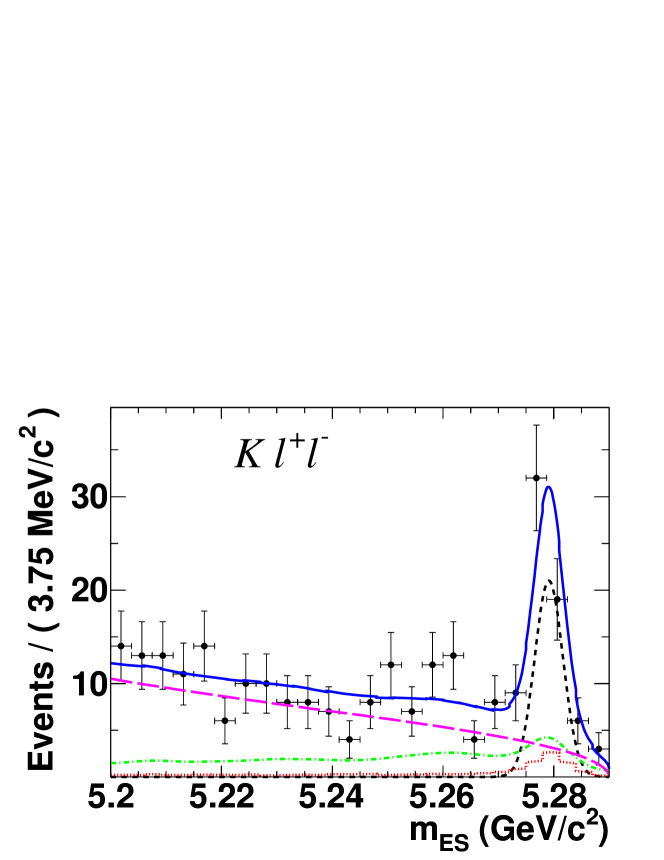
An example fit to extract signal events is depicted in Fig. 5.
The experimental details are presented in Ref. kllpaper .
Figure 5: BABAR: Example fit in the region for .
Data (points with error bars) are shown along with the total fit (solid curve), signal (short-dashed
curve), and different background contributions (other curves, see Ref. kllpaper for
detailed description).
III.1 Rates and Rate Asymmetries
The measured total branching fractions are:
where the first and second uncertainties are statistical and systematic, respectively.
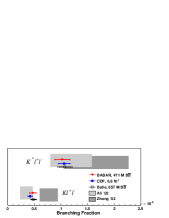
In Fig. 6, the measured total branching fraction results agree well
with the results from the Belle and CDF experiments belle09 ; cdf11 ,
as well as two sets of SM-based predictions Ali:2002jg ; Zhong:2002nu .
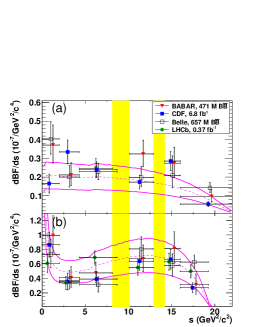
Figure 7 shows the BABAR partial branching fraction results
in agreement with the Belle, CDF, and LHCb results belle09 ; cdf11 ; lhcb11 . These BABAR results are
also consistent with the SM-based predictions Ali:2002jg ; ffmodels .
Figure 6: BABAR: Total branching fractions for
and compared
with Belle belle09 and CDF cdf11
measurements and with
predictions from the Ali et al.Ali:2002jg ,
and Zhong et al.Zhong:2002nu models. kllpaper Figure 7: BABAR: Partial branching fractions for (a) and (b) as a function of showing BABAR measurements, Belle measurements belle09 , CDF measurements cdf11 , LHCb measurements lhcb11 , and the SM prediction from the Ali et al. model Ali:2002jg with form factors ffmodels (magenta dashed lines).
The magenta solid lines show the theory uncertainties. The vertical
yellow shaded bands show the vetoed regions around the and resonances. kllpaper
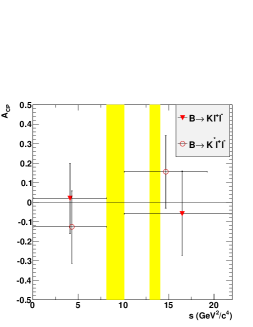
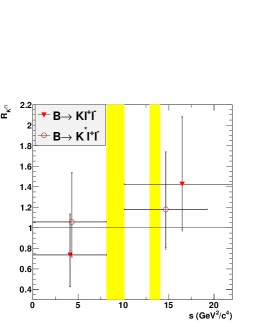
In the SM, the direct asymmetry
(2)
and lepton flavor ratio
(3)
are expected to be very close to zero and one, respectively. Our measured
and results agree with the SM expectations,
as shown in Fig 8.
Figure 8: BABAR: (top) asymmetries and (bottom) in two regions for and . The vertical
yellow shaded bands show the vetoed regions around the and . kllpaper
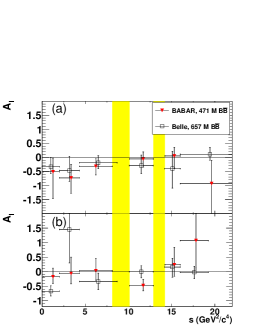
The -averaged isospin asymmetry is defined as:
(4)
where
is the ratio of and lifetimes PDG .
In the SM, the isospin asymmetries are expected to be at the level of a few percent isospin .
Figure 9 shows the BABAR isospin asymmetry results in agreement with
the earlier Belle results belle09 . The corresponding LHCb results are presented in a separate FPCP 2012 talk Serra:2012mb .
This BABAR analysis also measure below the resonance ( ):
where the first and second uncertainties are statistical and systematic, respectively.
The above two results are consistent with the SM predictions at 2.1 and 1.2
significance levels, respectively. They also agree with the corresponding Belle results belle09 .
Figure 9: BABAR: Isospin asymmetry for the (a) and (b) modes as a function of ,
in comparison to results from Belle belle09 . The vertical
yellow shaded bands show the vetoed regions around the and resonance. kllpaper
III.2 Angular Asymmetries
For the angular observables in ,
two angles are relevant here:
as the angle between the and the in
the rest frame, and as the angle
between the () and the ()
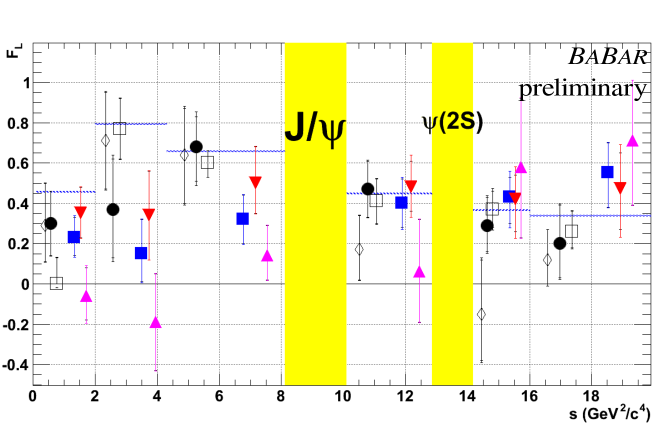
in the rest frame. The fraction
of the longitudinal and the lepton forward-backward
asymmetry are related to the distributions of and
in the signal decays through:
The values of and can thus be extracted through the fits to these angular distributions.
Both and are well predicted in the SM, and follow distinct patterns as functions
of Ali:2002jg ; ffmodels ; flafbsmpred . Starting from ,
where dominates, the SM value of is negative at very low , then cross the zero axis at .
At large above the resonance, the SM value of is expected to be large and positive due to the domination of the product of and .
is only sensitive to the sign of ,
while is sensitive to both the sign of and that of .
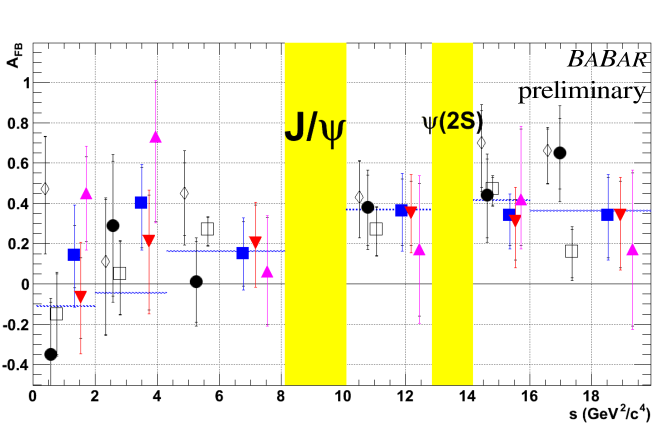
Figure 10 shows the BABAR and results for the modes, modes,
and all modes combined, in the six bins. The and results for the combined
are consistent with the most recent results from Belle belle09 , CDF cdf12afb , and LHCb lhcb11 ,
as well as the SM predictions Ali:2002jg ; ffmodels ; flafbsmpred . Still some discrepancies
with the SM are noticeable in the low bins below for the modes.
Figure 10: BABAR: Summary on (top) and (bottom) as a function of for .
Our results for (),
(),
and all modes combined ()
are compared to the results from Belle (), CDF (), and LHCb (), as well as the SM predictions (blue dashed lines).
IV Search for Lepton-Number Violating processes
In the SM with massless neutrinos, it is expected
that the lepton number is conserved in low-energy collisions and decays.
However, the observation of neutrino oscillation indicates that neutrinos possess non-zero
masses. If the neutrino masses are of Majorana type, i.e. each neutrino is its own anti-particle,
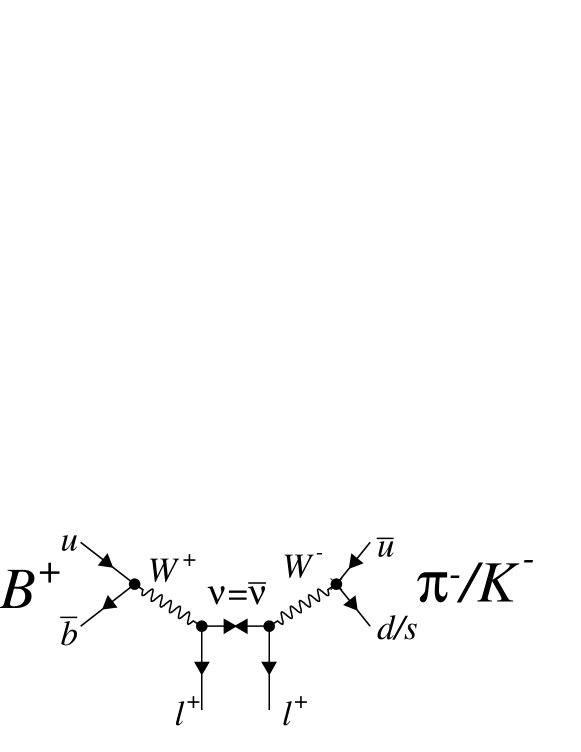
the violation will be possible. Figure 11 shows two different types
of processes involving Majorana neutrinos: ,
and . The search on these decays is
an alternative approach to the search for neutrinoless double-beta decay.
Figure 11: Possible Feynman diagrams for the decays (top) belledll
and (bottom) babarhll .
IV.1 Search for
In this Belle analysis on belledll ,
meson is reconstructed through ,
and is either , , or .
Two kinematic variables are defined to identify signal decays:
the energy difference between
the beam energy and the meson energy in the CM frame, and
the beam-energy-constrained meson mass , which
is identical to used in the BABAR experiment.
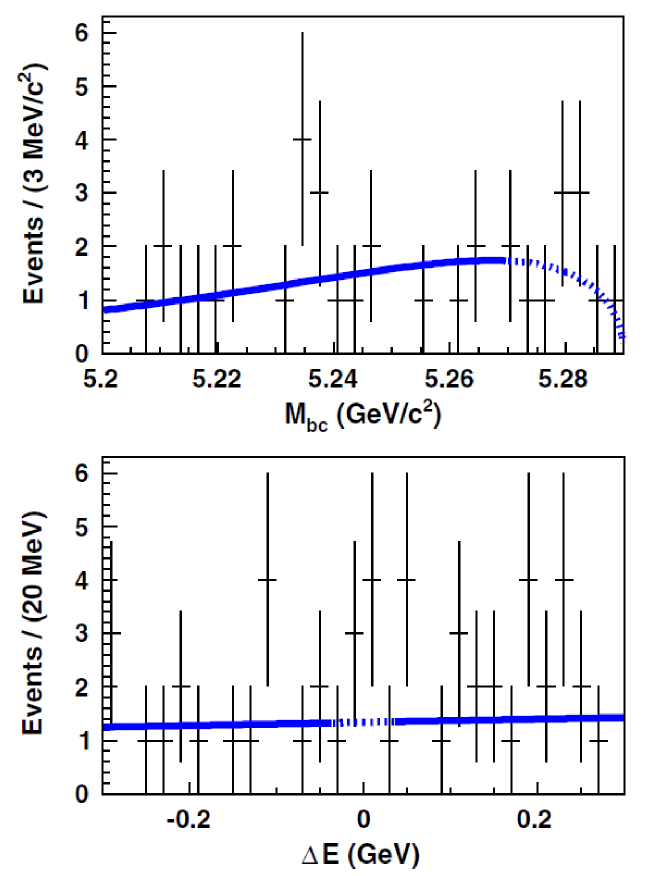
A two-dimensional (2D) fit is performed to the - distribution
for signal extraction. Figure 12 shows the fit projections
in the mode. The 90% C.L. upper limits on the branching fractions for different
modes are as summarized in Table 3.
Figure 12: Belle: The 2D fit projections and data for (top) and (bottom) in the mode.
See Ref.belledll for
detailed description.
Table 3: The 90% C.L. upper
limit (U.L.) on the branching fraction of .
Here is the signal reconstruction efficiency, is the
number of events in the signal region,
is the expected number of background events in
the signal region.
The efficiencies shown in the table do not include the
branching fraction of the decay. belledll
Mode
[%]
U.L. []
1.2
0
0.180.13
2.6
1.3
0
0.830.29
1.8
1.9
0
1.440.43
1.0
IV.2 Search for
In this BABAR analysis babarhll , the search is performed
in four different final states: , , , and .
Since these final states are very similar to the ones in the analysis described in
the previous section, both analyses also share similar event selection techniques. As no
significant evidence for signal events could be found,
this analysis sets the 90% C.L. upper limits on the branching fractions for the four modes
as summarized in Table 4. These results are comparable to the LHCb results lhcblnv
and provide much more stringent constraints than the CLEO results cleolhv .
The upper limits on the electron channels are also the most stringent ones to date.
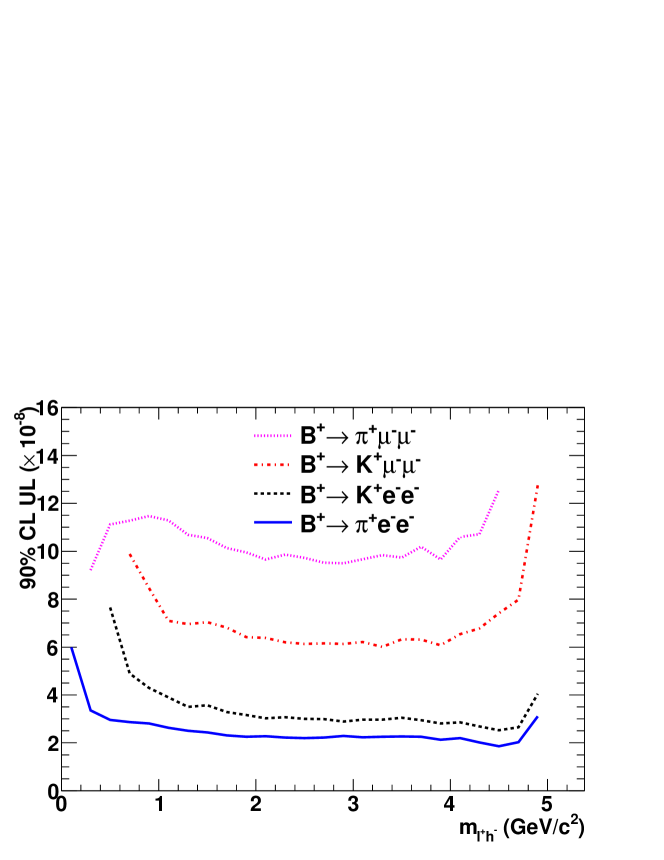
Furthermore, Figure 13 shows the 90% C.L. upper limit on the branching fraction
as a function of the invariant mass . If an exchange of the Majorana neutrino
occurs in the decay as illustrated in the left diagram of Fig. 11,
could be interpreted as the Majorana neutrino mass.
Table 4: 90% C.L. upper limits on the branching fractions () for the four measured decays. babarhll
Mode
2.3
3.0
10.7
6.7
Figure 13: BABAR: 90% C.L. upper limits on the branching fraction as a function
of for
(blue solid line), (black dashed line),
(red dash-dotted line), and (magenta dotted line). babarhll
V Conclusion
Both the BABAR and Belle experiments are still actively producing interesting
results based on their full data sets. As factories, they are capable of inclusive analyses on the
and processes.
This report covers new results on rare decay channels
from BABAR and Belle. Generally all these
results are found to be consistent with the SM predictions,
though some discrepancies exist for the angular asymmetries in the channel .
The current factory results are limited by low statistics, therefore
we have to rely on LHCb and future B factories to continue new physics searches
in these decay channels.
Acknowledgements.
The author is supported by the United States National Science Foundation
grants.
Special thanks to the conference organizers for
their great work.
References
(1)
M. Misiak, H. M. Asatrian, K. Bieri, M. Czakon, A. Czarnecki, T. Ewerth, A. Ferroglia and P. Gambino et al.,
Phys. Rev. Lett. 98, 022002 (2007).
(2)
D. Asner et al. [Heavy Flavor Averaging Group Collaboration],
arXiv:1010.1589 [hep-ex].
(3)
J. P. Lees et al. [BABAR Collaboration],
arXiv:1207.2520 [hep-ex].
(4)
D. Benson, I. I. Bigi and N. Uraltsev,
Nucl. Phys. B 710, 371 (2005).
(5)
B. O. Lange, M. Neubert and G. Paz,
Phys. Rev. D 72, 073006 (2005).
(6)
G. Buchalla, A. J. Buras, and M. E. Lautenbacher,
Rev. Mod. Phys. 68, 1125 (1996).
(7)
T. Feldmann and J. Matias,
JHEP 0301, 074 (2003).
(8)
J.-T. Wei et al. [Belle Collaboration],
Phys. Rev. Lett. 103, 171801 (2009).
(9)
T. Aaltonen et al. [CDF Collaboration],
Phys. Rev. Lett. 107, 201802 (2011).
(10)
R. Aaij et al. [LHCb Collaboration],
Phys. Rev. Lett. 108, 181806 (2012).
(11)
J. P. Lees et al. [BABAR Collaboration],
Phys. Rev. D 86, 032012 (2012).
(12)
A. Ali, E. Lunghi, C. Greub, and G. Hiller,
Phys. Rev. D 66, 034002 (2002).
(13)
M. Zhong, Y.-L. Wu, and W.-Y. Wang,
Int. J. Mod. Phys. A 18, 1959 (2003).
(14)
P. Ball and R. Zwicky,
Phys. Rev. D 71, 014015 (2005);
Phys. Rev. D 71, 014029 (2005).
(15)
K. Nakamura et al. [Particle Data Group],
J. Phys. G 37 (2010) 075021.
(16)
N. Serra,
arXiv:1208.3987 [hep-ex].
(17)
A. Ali, P. Ball, L. T. Handoko and G. Hiller,
Phys. Rev. D 61, 074024 (2000);
G. Buchalla, G. Hiller and G. Isidori,
Phys. Rev. D 63, 014015 (2000);
F. Kruger, L. M. Sehgal, N. Sinha and R. Sinha,
Phys. Rev. D 61, 114028 (2000)
[Erratum-ibid. D 63, 019901 (2001)];
F. Kruger and J. Matias,
Phys. Rev. D 71, 094009 (2005).
(18)
T. Aaltonen et al. [CDF Collaboration],
Phys. Rev. Lett. 108, 081807 (2012).
(19)
O. Seon, Y. J. Kwon, T. Iijima, I. Adachi, H. Aihara, D. M. Asner, T. Aushev and A. M. Bakich et al. [Belle Collaboration],
Phys. Rev. D 84, 071106 (2011).
(20)
J. P. Lees et al. [BABAR Collaboration],
Phys. Rev. D 85, 071103 (2012).
(21)
R. Aaij et al. [LHCb Collaboration],
Phys. Rev. Lett. 108, 101601 (2012).
(22)
K. W. Edwards et al. [CLEO Collaboration],
Phys. Rev. D 65, 111102 (2002).