Competing contact processes on homogeneous networks with tunable clusterization ††thanks: Correspondence to: kulakowski@fis.agh.edu.pl
Abstract
We investigate two homogeneous networks: the Watts-Strogatz network and the random Erdos-Renyi network, the latter with tunable clustering coefficient . The network is an area of two competing contact processes, where nodes can be in two states, S or D. A node S becomes D with probability 1 if at least two its mutually linked neighbours are D. A node D becomes S with a given probability if at least one of its neighbours is S. The competition between the processes is described by a phase diagram, where the critical probability depends on the clustering coefficient . For the rate of state S increases in time, seemingly to dominate in the whole system. Below , the contribution of D-nodes remains finite. The numerical results, supported by mean field approach, indicate that the transition is discontinuous.
07.05.Tp; 64.60.aq; 89.65.Ef
1 Introduction
Structure and dynamics of communication networks is a key issue in areas as different as modern ecology [1, 2], sociology [3, 4] and computer sciences [5]. Statistical physics started its massif and interdisciplinary venture with networks only recently [6, 7], bringing there an interdisciplinary attitude, the search of phase transitions and of universal laws. However, the terrain was well prepared by tens of years of research on lattices. In this approach percolation, cellular automata and contact processes are keywords, and the key method is computer simulation [8, 9, 10].
Here we are interested in contact processes on networks with tunable clustering. This interest is by no means new; actually, the problem is actively
investigated in terms of percolation [11, 12, 13, 14] and competing diseases [15, 16, 17, 18, 19]. In a recent paper [18], the case of two diseases has been considered, with mutual interaction of diseases through cross-immunity. The difference between the diseases was only in the values of their transmissibilities. Our aim here is to investigate two competing processes of different nature: one is activated by one neighbor, and the other - by a connected pair of two neighbors. In terms of opinion spreading, the problem could be termed as Voter vs Sznajd model [20, 21]. Up to our knowledge, this competition has not been investigated yet. As expected, the tunable clustering is particularly relevant for the process activated by connected pairs. According to this view, the Sznajd dynamics (activation by pairs) itself should strongly depend on the clustering coefficient. This comment was given already in [22], but the structure dependence on the dynamics was not considered there. Here we assume that a node activated by a pair is necessarily the nearest neighbor of each node of the activating pair. This is different than in the Sznajd model, where all neighbors of at least one node of this pair are activated. Further, a pair activates one site in one step. Making these modifications, we are motivated by sociological theory of the threshold effect [23, 24, 25]. Although this theory is sometimes brought up in the literature on the Sznajd model [26], in that approach a node is activated being a neighbor of only one member of the pair, what is not consistent with the sociological mechanism of the threshold effect. On the other hand, dynamics of collective social effect was modelled with success within the Random Field Ising model [27]. Still, up to our knowledge, a competition of dynamics activated by two different processes has not been investigated yet.
In our considerations, we distinguish between the change activated by one and at least two neighbours. Two is a minimal version of the threshold mechanism different from the Voter model; often, the number of neighbours necessary to activate a given behaviour is proposed to be larger than two. The difference between dyads and triads in social contagion is accepted in literature [28] and it was underlined already by Georg Simmel [29]. Our problem can be appllied in modeling these kinds of behaviour which need two persons to be imitated; in fact, threshold of two or more persons was found in social measurements [30]. In particular, statistics on marriages and divorces deserves attention, because the imitation mechanism can be active there and at it can be least partially responsible for the observed effects. In this case, the competing processes are the imitation of married vs divorced persons. The list of examples of behavior activated by pairs of persons include also joining scuffles and demonstrations of sexuality. To mention other possible applications, the model can serve as a step towards simulation of inheriting some genetic ilnesses, as hemophilia, where the presence of defected genes in one or two parents does matter [31]. Further, an application of the model is possible in computer sciences, in the so-called Paxos family of consensus protocols [32]. Namely, suppose that a part of code or data in neigboring units is particularly exposed to damages, and the positions of these damages are random. Then, the data can be repaired by a comparison of the datasets in two neighboring units, because it is unlikely that data in two units are damaged at the same position. Finally, our model can be relevant in economy, where different behaviour is observed of dyads and triads of firms [33, 34], with probability of collusions as an example.
The text is organized as follows. The model is explained and our numerical results are shown in Section II and III, respectively. In Section IV the related mean field approach is presented. The comparison of these results is discussed in the last section.
2 The model
The medium for our simulation, homogeneous networks, are either the Watts-Strogatz network or the Erdös-R’enyi network. In the former, the clustering coefficient is known to depend on the rewiring probability [6]. The latter networks are prepared from the usual Erdös-R’enyi network by adding some links between neighbors of the same nodes. The procedure, applied by Holme and Kim to the scale-free networks [35], was adapted later [36] to the Erdös-R’enyi networks. As a rule, the modified networks contained nodes, with mean degree . Note that the degree distribution for the networks is different than the Poison distribution [36]. The clustering coefficient is calculated for each network.
All nodes are labeled with S or D. Initially, some amount of nodes are selected to be D-nodes, with all remaining nodes marked as S-nodes. The dynamic rules are as follows: each S-node, which has at least two mutually connected D-nodes as nearest neighbors, becomes D-node with probability 1, and each D-node which has at least one S-node as nearest neighbor, becomes S-node with probability . Actually, what is relevant is the ratio of these rates, , and the probability of activation of D-nodes is fixed as one for convenience. The nodes are modified in parallel: nodes S at even steps, nodes D at odd steps. The advantage of this way of updating is that the results are more stable in time. The drawback is that we get two curves, one after updating S-nodes and another after D-nodes, and sometimes the curves do not merge. The difference between the curves can be treated as a measure of numerical accuracy.
Outcome of the simulation is to find the contributions of S-nodes as dependent on the probability and the clustering coefficient . The latter itself depends on the rewiring probability for the WS networks and on the number of added links for the ER networks. We find that the observed percentage of S-nodes (and of course of D-nodes) shows some discontinuities. This allows to present the results in the form of phase diagrams.
3 Numerical results
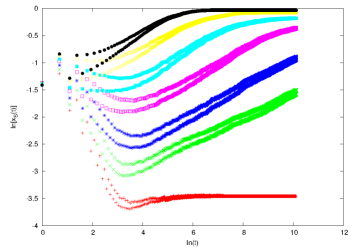
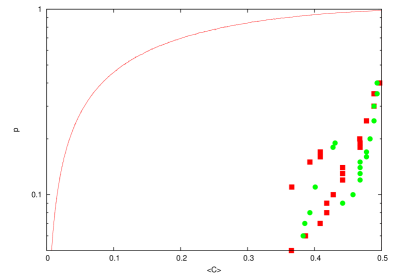
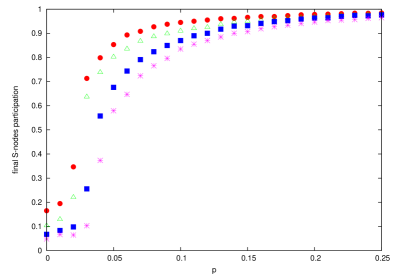
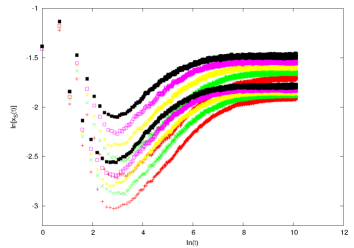
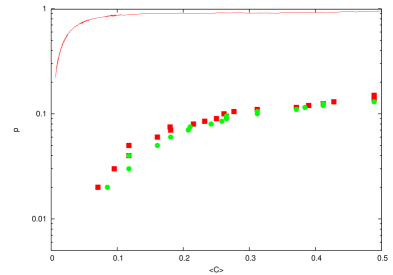
In Fig. 1 we show time dependences of the percentage of S nodes for an exemplary values of the clustering coefficient for the Watts-Strogatz network. The curves can be divided into two parts, qualitatively different. For probability smaller than some value , becomes constant after some transient time. For , slowly increases, seemingly to the maximal value 1.0. As a rule, the curves representing two kinds of updating merge. In Fig. 2, the curve is shown. The results indicate that is discontinuous at ; this is shown in Fig. 3. We note that for , the results on strongly depend on the initial state, whilst they do not for .
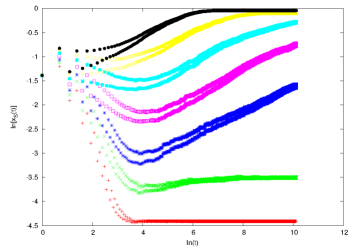
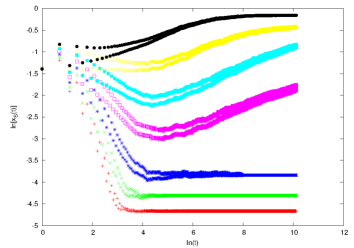
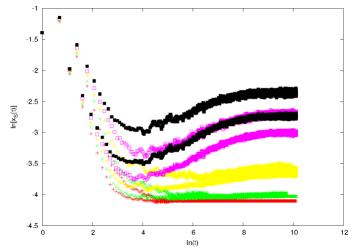
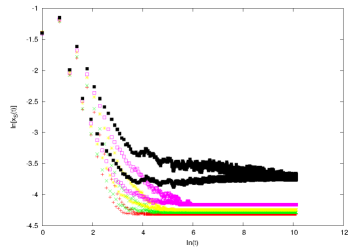
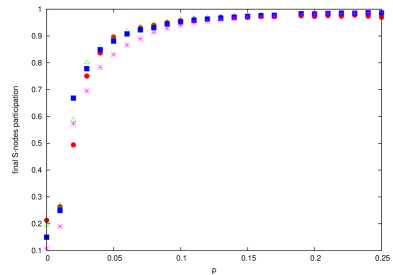
The same kind of results for the Erdös-R’enyi networks are shown in Figs. 4-6. In this case, the two updating curves merge only below . Above this threshold, the split between the curves remains finite.
4 Mean field
To interpret the numerical results, it is convenient to compare them with related mean-field theory. In the formalism of Master equations [37], the time derivative of the percentage of D-nodes can be written as
| (1) |
where is the percentage of S-nodes, and is the probability that a node has at least two, mutually connected neighbors. It is easy to see that for small values of the clustering coefficient the function . The argument is as follows: for the degree distribution the probability that a node has at least two neighbors is . The probability that at least one pair of these neighbors is connected is ; in general, it is equal to
| (2) |
The factor at means that it is not true that any pair of neighbors is not mutually linked. For small , this factor can be approximated as , and we get , positive if is not zero.
It is clear that Eq. 1 is controlled by one parameter . There are three fixed points: is always stable, is stable in the range and unstable for , where becomes stable. However, this transcritical bifurcation is not of interest for us, because is meaningless. Similarly, the fixed point is unstable in the range . The case when is to be considered separately; then, the only stable solution is
Summarizing, for we have to distinguish two cases. If , the only stable solution is , i.e. all nodes are S-nodes. If , the final state depends on the initial one and we have to distinguish two sub-cases. If initially , the final state is again all S-nodes. If, on the contrary, in the initial state, all nodes become D-nodes.
The solution is similar, if we withdraw the condition that activating a S-node must be accompanied by a S-neighbor. In this case the last term in Eq. 1 is just . Here again, the fixed point is always stable. Two other fixed points exist below the saddle-node bifurcation at ; the higher one () is stable, the lower one () is unstable. This means again, that for all nodes end as S-nodes, but the choice and the initial concentration of D-nodes larger than should lead to all D-nodes in the final state.
5 Discussion
The comparison of numerical results with their analytical counterparts allows to identify the similarities and differences. The analytical result for is that for any value of the clustering , the S nodes appear in 2/3 of the system. According to the numerical result, for there is a strong dependence of on the clustering coefficient and even on an initial state. Further, both methods indicate that for , there is a critical value of (denoted here as ) such that is one (analyticals) or tends to one (numericals) for . However, the results are different for . The analytical solution is that is 0 or 1, depending on the initial state ( smaller or larger than , respectively, where is given by Eq. 2). The numerical solution is that depends on . Some weak dependence on the initial state can be due to numerical inaccuracy. Despite this kind of errors, the numerical method captures an influence of local correlations and therefore is more credible.
When related to the imitation and the threshold effect in sociology, our results indicate that the static outcome changes discontinuously as dependent on the probability of activation of S-nodes. In this application, D-nodes denote persons who join an activity according to the threshold, and S-nodes denote persons who do not. Keeping the example of divorcing, our algorithm is to be interpreted as imitation of married couples and divorced persons. The
discontinuity, which is our main results of qualitative significance, means that in a stationary phase the number of divorced persons changes abruptly. More directly, an increase of number of divorces is related to an increase of the rate of activation of S-nodes (singles) with respect to the activation of D-nodes (married). This kind of effect should be readable in statistical data. Up to our knowledge, most sharp relative change of the number of divorces happened in Portugal during the so-called Carnation Revolution, when the statistics show a jump from 700 to 7000 divorces per year between 1973 and 1977 [38]. However, in that case the possible effect of imitation is hidden under the consequences of liberalization of law. A better example is the increase of number of divorces in United States by about 40 percent, starting about 1965 [39]. The process can be associated with devastating consequences of Vietnam war, and certainly it was initialized by it. However, a similar increase just after WWII quickly disappeared, in contrast to the persistence of the effect in 70’s. On the other hand, an increase of divorces in England and Wales around 1970 [40] cannot be interpreted as a consequence of an armed conflict, but rather as a demonstration of a more general phenomenon which had happened with various speed in most European countries [39]. There, we feel entitled to ask for a role of imitation.
Concluding, our results show a sharp dependence of the final state on the probability of activation of simulated process. This sharp dependence
can be related to competing processes of imitation in sociology. Other applications in behavioral economy, immunology and computer sciences are also possible.
Acknowledgements
The authors are grateful to Michael Macy, Andrzej Maksymowicz, Luzius Meisser and Matthias Meyer for helpful comments and providing reference data. The calculations were performed in the ACK Cyfronet, Cracow, grants No. MNiSW/IBM_BC_HS21/AGH/070/2010 and MNiSW/SGI3700/ AGH/070/2010. This work was partially supported from the AGH UST project No. 10.10.220.01.
References
- [1] F. Liljeros, C. R. Edling, L. A. N. Amaral, H. E. Stanley and Y. Aberg, The web of human sexual contacts, Nature 411, 907 (2001).
- [2] S. R. Proulx, D.E.L. Promislow and P. C. Phillips, Network thinking in ecology and evolution, TRENDS in Ecology and Evolution 20, 345 (June 2005).
- [3] S. Wasserman and K. Faust, Social Network Analysis. Methods and Applications, Cambridge UP 1994.
- [4] M. Castells, The Rise of the Network Society, The Information Age: Economy, Society and Culture, Vol. I, Cambridge, MA, Blackwell 1996.
- [5] L. L. Peterson and B. S. Davie, Computer Networks, A Systems Approach, Elsevier Inc., Amsterdam 2012.
- [6] D. J. Watts and S. H. Strogatz, Collective dynamics of small world networks, Nature 393, 409 (1998).
- [7] A.-L. Barabasi and R. Albert, Emergence of scaling in random networks, Science 286, 509 (1999).
- [8] D. Stauffer and A. Aharony, Introduction to Percolation Theory, 2nd ed., Taylor and Francis, London 1994.
- [9] S. Wolfram, A New Kind of Science, Wofram Media, Inc., 2002.
- [10] J. Marro and R. Dickman, Nonequilibrium Phase Transitions in Lattice Models, Cambridge UP, Cambridge 2002..
- [11] J. P. Gleeson, Bond percolation on a class of clustered random networks, Phys. Rev. E 80, 036107 (2009)
- [12] J. P. Gleeson, S. Melnik and A. Hackett, How clustering affects the bond percolation threshold in complex networks, Physical Review E 81, 066114 (2010).
- [13] A. Hackett, J. P. Gleeson and S. Melnik, Site percolation in clustered random networks, Int. J. Complex Systems in Science vol. 1 (2011), pp. 25-32
- [14] J. P. Gleeson, High-accuracy approximation of binary-state dynamics on networks, Phys. Rev. Lett. 107, 068701 (2011).
- [15] M. E. J. Newman, Threshold effects for two pathogens spreading on a network, Phys. Rev. Lett. 95, 108701 (2005).
- [16] Y.-Y. Ahn, H. Jeong, N. Masuda, and J. D. Noh, Epidemic dynamics of two species of interacting particles on scale-free networks, Phys. Rev. E 74, 066113 (2006).
- [17] S. Funk and V. A. A. Jansen, Interacting epidemics on overlay networks, Phys. Rev. E 81, 036118 (2010).
- [18] B. Karrer and M. E. J. Newman, Competing epidemics on complex networks, Phys. Rev. E 84, 036106 (2011).
- [19] L. Hebert-Dufresne, P.-A. Noel, V. Marceau, A. Allard, and L. J. Dub, Propagation dynamics on networks featuring complex topologies, Phys. Rev. E 82, 036115 (2010)
- [20] T. M. Liggett, Interacting Particle Systems, Springer-Verlag, New York 1985.
- [21] K. Sznajd-Weron and J. Sznajd, Opinion evolution in closed community, Int. J. Modern Phys. C 11, 1157 (2000).
- [22] A. O. Sousa, Consensus formation on a triad scale-free network, Physica A 348 (2005) 701.
- [23] M. Granovetter, Threshold model of collective behavior, Amer. J. of Sociology 83, 1420 (1978).
- [24] G. Marwell and P. Oliver, The Critical Mass in Collective Action, Cambridge UP, Cambridge 1993.
- [25] M. S.-Y. Chwe, Structure and strategy of collective action, Amer. J. of Sociology 105 (1999) 128
- [26] K. Sznajd-Weron, Sznajd model and its applications, Acta Phys. Pol. B 36, 2537 (2005).
- [27] Q. Michard and J.-P. Bouchaud, Theory of collective opinion shifts: from smooth trends to abrupt swings, Eur. Phys. J. B 47, 151 (2005).
- [28] D. Centola and M. Macy, Complex contagions and the weakness of long ties, Amer. J. Soc. 113, 702 (2007).
- [29] G. Simmel, Soziologie. Untersuchungen uber die Formen der Vergesellschaftung, Verlag von Duncker und Humblot, Munchen und Leipzig 1922; Polish edition: Wyd. Nauk. PWN SA, Warszawa 2005, p.104.
- [30] T. W. Valente, Social network thresholds in the diffusion of innovations, Social Networks 18, 69 (1996).
- [31] A. S. Perelson and G. Weisbuch , Immunology for physicists, Rev. Mod. Phys. 69, 1219 (1997).
- [32] L. Lamport, The part-time parliament, ACM Transactions on Computer Systems 16, 133 (1998).
- [33] S. Huck, H.-Th. Normann and J. Oechssler, Two are few and four are many: number effects in experimental oligopolies, J. Economic Behavior and Organization 53, 435 (2004).
- [34] B.-O. Heine, M. Meyer and O. Strangfeld, Stylized facts and the contribution of simmulation to the economic analysis of budgeting, JASSS vol. 8, no. 4 (2005).
- [35] P. Holme and B. J. Kim, Growing scale-free networks with tunable clustering, Phys. Rev. E 65, 026107 (2002).
- [36] A. Mańka, K. Malarz and K. Kułakowski, Clusterization, frustration and collectivity in random networks, Int. J. Modern Phys. C 18, 1772 (2007).
- [37] C. W. Gardiner, Handbook of Stochastic Methods for Physics, Chemistry and the Natural Sciences, Springer-Verlag, Berlin 1985.
- [38] www.pordata.pt/en/Portugal/Search+Environment/Table/?MicroId=531 (23.06.2012)
- [39] Partnership and Reproductive Behavior in Low-Fertility Countries, ESA/P/WP.177, Population Division Dept. of Economic and Social Affairs, UN Secretariat, May 2003.
- [40] www.guardian.co.uk/news/datablog/2010/jan/28/divorce-rates-marriage-ons (23.06.2012)