Faint moving object detection, and the Low Signal-to-Noise recovery of Main Belt comet P/2008 R1 Garradd111Based on observations collected at the Gemini North Observatory (program GN-20010A-Q-50) and the University of Hawai‘i 2.2 m Telescope, Mauna Kea, Hawai‘i, USA, at the European Southern Observatory, La Silla, Chile (program 184.C-1143), at and the Telescopio Nazionale Galileo, La Palma, Spain (program AOT20/09B TAC5).
Abstract
We describe the recovery of faint Main Belt comet P/2008 R1 Garradd using several telescopes, culminating in a successful low recovery with the Gemini North telescope with GMOS. This recovery was a time-critical effort for a mission proposal, and had to be performed in a crowded field. We describe techniques and software tools for eliminating systematic noise artifacts and stellar residuals, bringing the final detection image statistics close to the Gaussian ideal for a median image stack, and achieving a detection sensitivity close to this theoretical optimum. The magnitude of =26.10.2 with an assumed geometric albedo of 0.05 corresponds to a radius of 0.3 km. For ice to have survived in this object over the age of the solar system, it implies that the object is a more recent collisional fragment. We discuss the implications of the unexpectedly faint magnitude and nuclear size of P/2008 R1 on the survival of ice inside very small bodies.
1 Introduction
Main Belt comets (MBCs) are a relatively new class of active (comet-like) objects in the outer asteroid belt (Jewitt, 2012, for a review). Although many ideas have been presented as causes for activity, the only plausible explanation for those with recurring activity on successive perihelion passages is water-ice sublimation (e.g. for 133P/Elst-Pizarro and 238P/Read). There are two examples of impacts in the main belt which have produced dust clouds around asteroids (596 Schiela and P/2010 A2 LINEAR), but the most likely cause of activity for the other objects is a thermally driven process, such as sublimation.
If the activity is driven by sublimation, MBCs represent an unexpected and persistent reservoir of water in the inner solar system. The distribution of water and volatiles in our solar system is a primary determinant of habitability yet the origin of terrestrial water is a fundamental unresolved issue in planetary science. Neither comets nor asteroids provide an isotopic match to both Earth’s water and noble gas inventory; thus MBCs may play an important role in the context of understanding the distribution of water in the early solar system. MBCs are in near-circular orbits within the asteroid belt and may contain water frozen out from beyond the primordial snow line (Encrenaz, 2008; Garaud & Lin, 2007) under different physical conditions than those influencing comets and asteroids. Unlike for comets which travel into the inner solar system, or asteroids which are sampled through their presence in meteorite collections, the volatiles in MBCs have not been explored, but they are accessible to space missions.
P/2008 R1 Garradd, discovered in 2008 (Garradd et al., 2008), was only the fourth MBC found. The initial observations immediately following the discovery (Jewitt et al., 2009) were at a heliocentric distance and geocentric distance , with a visible magnitude of , after correction for coma. This constrained the upper limit to the nucleus radius to be , assuming a geometric albedo of =0.05.
Because of favorable trajectories, MBC P/2008 R1 was chosen to be the primary target of a Discovery class NASA mission called Proteus that was proposed in 2010. The goal of Proteus is to explore a member of this new class of small bodies in order to provide insight into the distribution of early solar system volatiles and thus advance our understanding of solar system habitability. The mission is a rendezvous mission that is meant to spend 6 months in-situ to obtain global color maps of the coma and nucleus with 3-m resolution, to investigate the bulk physical properties of the MBC, measure the elemental composition of the dust, and finally, to watch the onset of outgassing and obtain volatile isotopic and elemental abundance ratios of several volatiles, including D/H. Because P/2008 R1 Garradd had been seen on only one previous apparition, it was important to recover the object to ensure a high precision orbit. Both to obtain astrometry and to characterize the target nucleus, our group undertook a large effort to recover P/2008 R1.
In late 2009 and early 2010, P/2008 R1 was at heliocentric distances between –3.5 AU, and geocentric distances – AU, implying that P/2008 R1 would be 3 to 4 magnitudes fainter than during its discovery observations, assuming the usual geometric flux dependence. At these distances the object was expected to be inactive, making the observations very challenging.
In this paper, we describe the P/2008 R1 recovery observations of 2009 to 2010, culminating in a successful low recovery. In addition to the observations presented below, the MBC field was imaged for 90 minutes with the 10 m Keck I LRIS instrument on Mauna Kea on 2010 Mar. 17 in moderately good seeing, ending in a non-detection (Jewitt, private communication).
We present an optimized method of shifting and adding astronomical images to recover moving objects at the detection threshold of the instrument. We also describe the construction of a detection pipeline using readily available software normally designed for static images. This pipeline has the advantages of fitting astrometric coordinates, of producing an accurate astrometric measurement as a final product, and of allowing masking operations that suppress stellar residuals and allow a detection sensitivity that approaches the theoretical optimum for median stacked images. Finally, we discuss the implications of P/2008 R1’s unexpectedly faint magnitude and small size for the persistence of ice in the asteroid belt.
1.1 Archive searches
We searched the main astronomical data archives for pre-discovery serendipitous images of P/2008 R1. In the ESO Science Archive222http://archive.eso.org, we checked every image acquired between January 1996 and June 2010 with an exposure time longer than 10 s using the ESO Wide Field Imager (WFI, 2.2m), the ESO Faint Object Spectrograph and Camera 2 (EFOSC2), SofI (3.6m), Wide Field Infra–Red Camera (WFCAM, 4m), Visible Multi–Object Spectrograph (VIMOS), Focal Reducer and Low Dispersion Spectrographs 1 and 2 (FORS1 and FORS2), HAWK-I (High Acuity, Wide–Field K–Band Imaging), and NaCo (Nasmyth Adaptive Optics System [NAOS], Near–Infrared Imager and Spectrograph [CONICA], 8.2m) against the ephemerides of the comet for the corresponding instrument’s field of view. The only frames returned that matched the ephemeris position were the NTT images described below (Section 2.2).
Using the SSOS tool333http://www2.cadc-ccda.hia-iha.nrc-cnrc.gc.ca/ssos/, we also searched for images from MegaCam on CFHT (3.6m), SuprimeCam on Subaru (8.3m),GMOS on Gemini (North and South; 8.2m) and WFPC2, ACS, and WFC3 on HST (2.5m in Earth orbit) from 1994 until 2010 June 10. The only frames reported were those described in Section 2.4.
2 Observations
Between November 2009 and April 2010, we undertook an extensive observing program using several telescopes, ranging in aperture from 2.2m to 8m. These are briefly described below and summarized in Table 1.
2.1 Telescopio Nazionale Galileo
CCD images were obtained on the 3.56m Telescopio Nazionale Galileo (TNG) on La Palma on the nights of UT 2009 Nov. 19 and 20. The DOLORES444http://www.tng.iac.es/instruments/lrs instrument was used with the Johnson-Cousins filter R_John_12. The pixels were on the sky, resulting in a field of view (FOV) of on the E2V 4240 CCD. The data were obtained at low to moderate airmasses (1.11.9) with the seeing ranging between to .
2.2 New Technology Telescope
The observations were performed on the ESO 3.56m New Technology Telescope (NTT) on La Silla, with the ESO Faint Object Spectrograph and Camera (v.2) instrument (Buzzoni et al., 1984; Snodgrass et al., 2008, EFOSC2), through a Bessel filter, using the ESO#40 detector, a 2k2k thinned, UV-flooded Loral/Lesser CCD, which was read in a 22 bin mode resulting in pixels, and a FOV. The data were acquired on UT 2010 January 13, under dark and photometric conditions. However, because of the high declination of the object, the airmass ranged from 2.63.0, resulting in a poor on-chip image quality of 15 FWHM.
2.3 University of Hawai‘i 2.2m
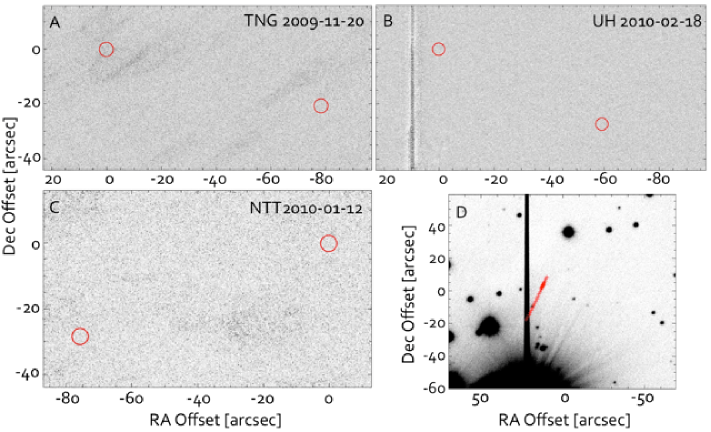
The observations were performed on the University of Hawai‘i (UH) 2.2-m telescope on Mauna-Kea, using the Tektronix 2k2k CCD camera with the Kron-Cousin filter555http://www.ifa.hawaii.edu/88 inch. The projected pixel size is , yielding a FOV of . The exposures were obtained, under dark and photometric conditions. High winds degraded the seeing to worse than average at 11 FWHM. A nearby very bright star significantly contaminated the expected position of the comet (Fig. 1D).
2.4 Gemini North
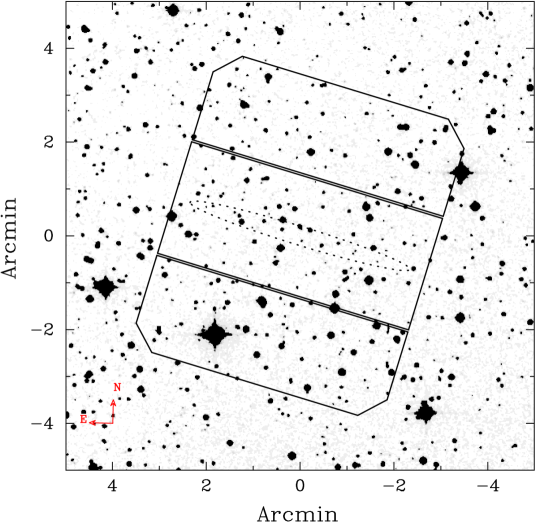
Data were collected on UT 2010 April 4 using the Gemini North telescope GMOS instrument (Hook et al., 2004; Allington-Smith et al., 2002) in imaging mode. GMOS is a FOV instrument with three (binned) detector arrays, two of which are vignetted. At the binning used, the pixel scale is . As shown in Fig. 2, the field was rotated so that the uncertainty ellipse lay along the long axis of the center chip.
Data were acquired under dark photometric conditions through the band (GMOS filter ID G0303) with seeing around , and an airmass between 1.352.2. Non-sidereal guiding was used, at a rate of , so that each star was trailed to a length of . Combined with the relatively densely populated field (Galactic longitude , and latitude ), this trailing tended to fill a large fraction of the field with stars.
3 Data Processing
3.1 Traditional Reduction Method: TNG, NTT and UH
The data from the TNG, UH and the NTT were processed using customary methods: after bias subtraction and flat-field correction, the individual images were aligned using the background stars as reference, and were co-added, forming the the star background template. This template was astrometrically calibrated, scaled to the appropriate exposure time and subtracted from the individual frames, which were then shifted to account for the motion of the comet (using the Horizon ephemerides and the astrometric calibration). The individual, star-subtracted frames were averaged with a median-like rejection algorithm. The method is described in more detail in Hainaut et al. (2004).
Figure 1 displays subsets of the frames centered on the expected position of the comet for the data from the TNG, the NTT and the UH2.2m. None of the images show an MBC candidate at the expected ephemeris position. In order to check for very faint candidates, the individual frames were combined using various subsets of the images, and the star-subtracted stacks were compared with the stacks including the stars. No convincing candidate in any of the subsets was identified.
The limiting magnitudes were estimated by inserting scaled PSFs into the images. The adopted limiting magnitude is that for which at least 65% of the fake comets are visible. The values are listed in Table 1. With the exception of the NTT observations, the limiting magnitudes are considerably fainter than the value reported from the observations by Jewitt et al. (2009), suggesting correspondingly smaller nuclei.
3.2 New Reduction Techniques for the Deeper GMOS/Gemini Data
For the more crowded Gemini fields, we constructed a pipeline from the TERAPIX/ASTROMATIC tools of Emmanuel Bertin666http://www.astromatic.net, which provides a more automated and flexible way of performing the tasks of aligning the images, calibrating the astrometric solution, and subtracting background. This allowed us to optimize the subtraction and reach the best limiting magnitude. Henceforth all software commands mentioned will be part of TERAPIX/ASTROMATIC unless otherwise noted.
The first step utilized the SExtractor photometry program to create a catalog of stars for each GMOS image. Next, we employed the scamp astrometric program to fit a linear world coordinate system (WCS) to each image, using the sextractor catalogs as an input and 2MASS as the astrometric reference catalog. A typical fit employed stars with an RMS of in each dimension. To shift and add the night’s observations, we modified the center RA and Dec of the WCS output files produced by scamp in the reverse of the object’s motion, using the observation time in the header.
Finally, we performed the co-addition using the SWarp program, which background–subtracts and rebins the images to a common astrometric frame, and performs a median. Images were rebinned to a pixel scale, with conventional North–up, East–left linear world coordinates.
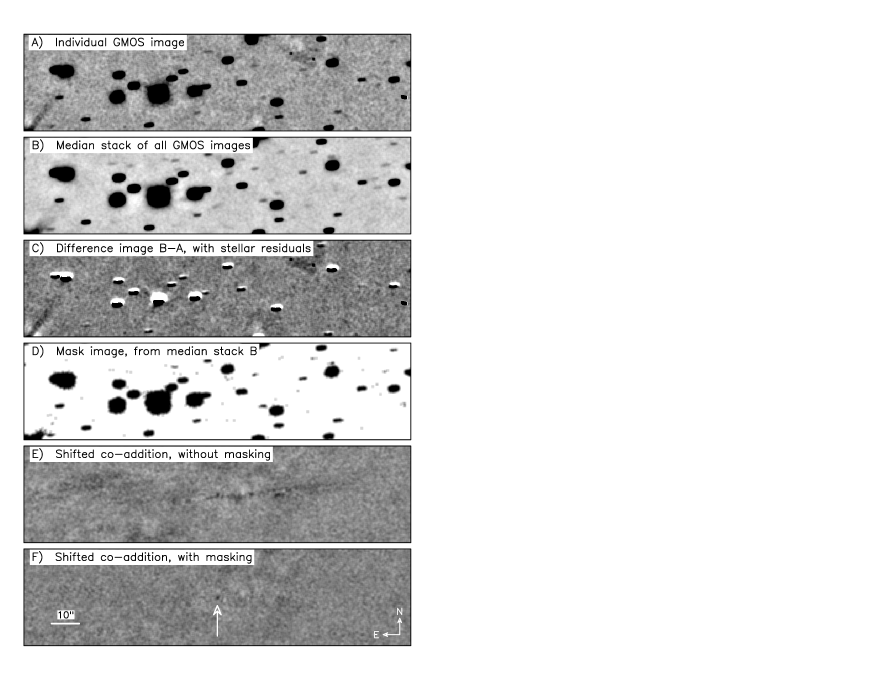
This simple procedure failed to show the comet, because stellar residuals overwhelmed any signal from the MBC P/2008 R1. Thus, we next created an un-shifted median deep stack of all of the images using swarp. We then subtracted this deep stack from each individual exposure by minimizing the sum of the absolute value of the output image, a criterion designed to minimize the amount of final flux present, adjusting for the changes of extinction and seeing during the observations.
Using the median-subtracted image for the shifted stack substantially reduced the background artifacts, but remaining traces of stars still produced too many low level features. These stellar residuals appear to result from a combination of slight PSF variations through the night, as well as possible small astrometry errors. For instance, extinction and seeing may have changed during an exposure, so that the centroid of the trailed stars may have shifted, resulting in slight errors in the final WCS. After subtraction, the maximum flux in the stellar residuals is about 5% of the flux of the star.
As the final step of cleaning the individual images, we created a mask image for each median-subtracted exposure. Whenever a pixel in the exposure exceeded 500 photons, or whenever a pixel in the median exceeded 100 photons, the weight mask was set to zero. The typical masked fraction was about 11%. swarp then ignored zero-weighted pixels when producing the final shifted stack. This masking process yielded a faint detection of P/2008 R1.
Fig. 3 shows the sequence of images in the reduction procedure as described above. In panel E of the figure, the un-masked stack, MBC P/2008 R1 is visible but is connected to an extended artifact, so it cannot be identified without reference to the masked stack in panel F. Additionally, we performed the usual verifications to ensure the reality of the detected object. Image stacks were created from subsets from the full frame set; they also show the comet. Individual frames were checked for artifacts and/or contamination at the position of the comet; nothing was found. This convinces us of the reality of the object.
The astrometry (Table 2) of the image shows that P/2008 R1 was found west and south of the expected ephemeris position on 2010 April 4, but was along the error ellipse and was reported in Kleyna & Meech (2010). With the updated orbit we again searched the TNG, NTT and UH CCD frames and the comet was not found. In the TNG and NTT data this was because the limiting magnitudes were not deep enough. For the UH2.2m data, the full image stack probably had a sufficiently deep limiting magnitude, but the position of the MBC was located under the charge bleed from the bright star for some fraction of the time, and the partial stack was not deep enough.
3.3 Detection significance
Aperture photometry of the final median stack gives a flux of photons per 300 seconds in a pixel () radius aperture, corresponding to a magnitude of , using the published GMOS calibration777GMOS North magnitude from flux: , from Jørgensen (2009) and the GMOS calibration web page.. A Moffat function fit over a square gives a similar flux of 1594 photons (), while a Gaussian fit, which tends to omit the PSF wings, gives a flux of 1218 (). Both fits yield a FWHM of , suggesting that the frames are well aligned. We estimate the significance of the detection by dividing the flux of the detection by the standard deviation of the flux in randomly placed apertures. The significance is for a 3 pixel radius aperture, for a radius of 5 pixels, and for a radius of 7 pixels. We therefore report the magnitude of the comet as . Although one might expect the extended Moffat flux to be larger rather than smaller than the aperture flux, the difference is smaller than the photometric uncertainty, and is likely to be influenced by random variations in the Moffat wings.
After rescaling the exposure times to account for the 11% masking fraction, the GMOS exposure time calculator (ETC) predicts a to detection within a pixel radius aperture, depending on observing conditions. We conclude that this technique can recover objects very close to the theoretical limit, even in a moderately crowded field.
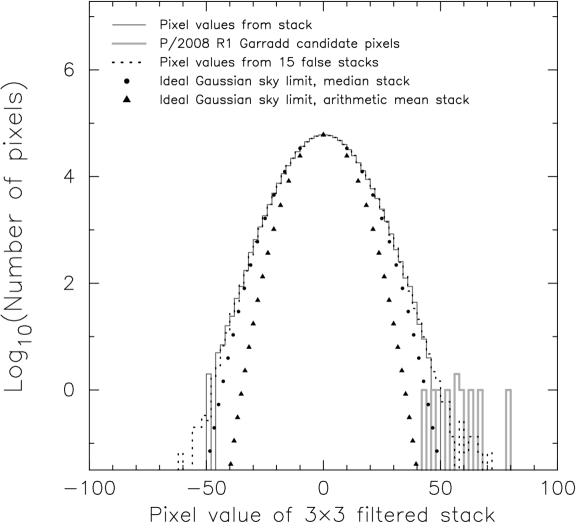
Fig. 4 shows a histogram of the pixel values of a smoothed version of the final detection stack, as well as pixels drawn from false stacks that have had a deliberate random jitter introduced during shifting to eliminate the moving object. Despite the object’s low detection significance, it still contains the most outlying pixels of the stack image, eclipsing any detections in the false stacks. From the parabolic shape of the histogram, it is evident that the final pixel distribution has a minimal non–Gaussian tail.
We compare the pixel distribution in the stack to the ideal Gaussian sky limited case, using the empirical pixel flux distribution in the 20 background subtracted component images as a measure of image noise. For the ideal cases, we assume a zero masking fraction, in order to ascertain losses associated with masking. The solid triangles in Fig. 4 show the expected final pixel distribution for simple arithmetic mean stacking with pure Gaussian sky noise. The solid circular dots show the effect of median stacking, which increases the spread by a factor of 1.25. The fact that the observed pixel histograms closely track the circular (median) dots shows that this method approaches the sensitivity of the median-stacked, purely Gaussian noise dominated ideal case. The 11% masking fraction is responsible for only a modest loss of sensitivity.
4 The Unexpectedly Small Size of P/2008 R1
To allow comparison of our observations with customary photometric systems, we convert our magnitude to Kron-Cousins band using the color equations given by Fukugita et al. (1996): . Jewitt et al. (2009) reported for the active comet, and Hainaut et al. (2012) list as the average of 49 Short Period Comet nuclei; the uncertainty in is much less important than the observational error in . Using , we get . Given the helio- and geocentric distances and solar phase angle listed in Table 1, and using the same slope parameter as Jewitt et al. (2009), this results in an absolute magnitude . Using a geometric albedo , this corresponds to a radius of km, where the radius uncertainty is about from the magnitude error alone.
From the value of , we remark that the limiting magnitudes we reached with the other telescopes were indeed too shallow.
The radius we obtain is consistent with the limit proposed by Jewitt et al. (2009) based on measurements of the active comet ( km), and is even smaller than their conservative rough estimate ( km). Sarid et al. (2012) have undertaken a parameter study of the survival of ice in MBCs, and have found that the only volatile able to survive the age of the solar system in the orbital parameter space occupied by the MBCs is crystalline water ice. Even then, the survivability is dependent upon the average orbital radius, the MBC radius and its density. With an average orbital radius = 2.4 AU where is the semi-major axis [AU] and the eccentricity, it is unlikely that ice can survive the age of the solar system for an object with a radius of 0.3 km in the orbit of P/2008 R1 for any plausible range of densities (0.51.3 gm cm-3) (Sarid et al., 2012). However, some of the MBCs are members of the Themis and and Beagle collisional families and have significantly younger ages ( 2 Gyr and 10 Myr, respectively). Even small parent body fragments (down to =0.3 km) are expected to have surviving ice over a 10 Myr period. Specifically for P/2008 R1 Garradd with its current size and orbit, ice can only survive on the 10’s of Myr timescale, and can be at depths as shallow as 10-15 m.
Jewitt et al. (2009) have shown that the orbit of P/2008 R1 Garradd is not stable on timescales of 20-100 Myr due to its interaction with the 8:3 mean-motion resonance with Jupiter. This is shorter than the likely collisional lifetime for objects this size in the main belt. The MBC 238P/Read was shown to have a similarly small radius of (Hsieh et al., 2009), and is one of the more active MBCs, and has now been seen active at two perihelion passages. Like P/2008 R1, 238P/Read is also not a member of either the Themis or Beagle families. It is likely that there are more collisional families in the outer belt. It may be that objects in the outer asteroid belt contain significant water-ice, but that the objects are not discovered frequently because of their low level of activity and the need for a collisional trigger.
5 Conclusions
We undertook an intensive recovery effort of Main Belt Comet P/2008 R1 Garradd, in support of the Proteus NASA Discovery mission proposal. Because it was significantly fainter than expected, all our observations failed to recover the object, until we obtained 6000s of 8-m telescope time on Gemini North, combined with an improved detection pipeline and artifact reduction techniques, managed to recover the the object at a low level.
From the absolute magnitude , we infer that the radius of MBC P/2008 R1 Garradd is = 0.3 km. Given its smaller perihelion distance and larger orbital eccentricity, this suggests that this body cannot have been at its present orbit at its present size over the age of the solar system. From previous findings that 238P/Read is also very small, we infer that the survival of ice in small bodies may be commonplace.
| Epoch UT1 | Telescope | Obs2 | Exp.3 | Total4 | Mag 8 | |||
|---|---|---|---|---|---|---|---|---|
| 2009-11-19.0 | TNG/DOLORES | GT | 2 | 1800 | 3.22 | 2.41 | 11.7 | |
| 2009-11-20.0 | TNG/DOLORES | GT | 34 | 6120 | 3.22 | 2.41 | 11.4 | |
| 2010-01-13.1 | NTT/EFOSC2 | OH | 10 | 3000 | 3.35 | 2.47 | 8.7 | |
| 2010-02-18.2 | UH/CCD | JP | 30 | 17150 | 3.42 | 2.92 | 15.2 | |
| 2010-02-18.2 | UH/CCD† | JP | 22 | 9950 | 3.42 | 2.92 | 15.2 | |
| 2010-04-04.2 | GN/GMOS | SM | 20 | 6000 | 3.50 | 3.65 | 15.9 | 26.10.2 |
1: UT date and time of mid-exposure of the sequence; 2: Observers: GT: G. P. Tozzi; OH: O. R. Hainaut; JP: J. Pittichová; SM: Gemini queue observing mode; 3,4: Number of exposures, and total exposure time [sec]; 5,6: helio- and geocentric distances [AU]; 7: solar phase angle [degrees]; 8: R-band. † Reduced UH dataset, removing the frames where the expected position of P/2008 R1 was on the field star charge bleed.
| Position† | [arcsec] | [arcsec] | ||
|---|---|---|---|---|
| Old orbit | 05:55:33.39 | +35:14:31.0 | ||
| Measurement | 05:55:29.17 | +35:14:16.7 | -52.47 | -14.22 |
| New orbit | 05:55:29.26 | +35:14:15.5 | -50.59 | -15.50 |
†All positions refer to 2010-Apr-13 05:45; and refer to the offset from the old orbit position.
References
- Allington-Smith et al. (2002) Allington-Smith, J., Murray, G., Content, R., et al. 2002, PASP, 114, 892
- Buzzoni et al. (1984) Buzzoni, B., Delabre, B., Dekker, H., et al. 1984, The Messenger, 38, 9
- Encrenaz (2008) Encrenaz, T. 2008, ARA&A, 46, 57
- Fukugita et al. (1996) Fukugita, M., Ichikawa, T., Gunn, J. E., et al. 1996, AJ, 111, 1748
- Garaud & Lin (2007) Garaud, P. & Lin, D. N. C. 2007, ApJ, 654, 606
- Garradd et al. (2008) Garradd, G. J., McNaught, R. H., Meyer, M., Herald, D., & Marsden, B. G. 2008, Minor Planet Electronic Circulars, 46
- Hainaut et al. (2012) Hainaut, O., Boehnhardt, H., & Protopapa, S. 2012, A&A, in press
- Hainaut et al. (2004) Hainaut, O. R., Delsanti, A., Meech, K. J., & West, R. M. 2004, A&A, 417, 1159
- Hook et al. (2004) Hook, I. M., Jørgensen, I., Allington-Smith, J. R., et al. 2004, PASP, 116, 425
- Hsieh et al. (2009) Hsieh, H. H., Jewitt, D., & Ishiguro, M. 2009, AJ, 137, 157
- Jewitt (2012) Jewitt, D. 2012, AJ, 143, 66
- Jewitt et al. (2009) Jewitt, D., Yang, B., & Haghighipour, N. 2009, AJ, 137, 4313
- Jørgensen (2009) Jørgensen, I. 2009, PASA, 26, 17
- Kleyna & Meech (2010) Kleyna, J. & Meech, K. 2010, MPC, 70579, 22
- Sarid et al. (2012) Sarid, G., Prialnik, D., & Meech, K. 2012, MNRAS, submitted
- Snodgrass et al. (2008) Snodgrass, C., Saviane, I., Monaco, L., & Sinclaire, P. 2008, The Messenger, 132, 18