11email: [boley,linz,boekel,bouwman,henning]@mpia.de 22institutetext: Ural Federal University, Astronomical Observatory, 51 pr. Lenina, Ekaterinburg, Russia
22email: andrey.sobolev@usu.ru
On the massive young stellar object AFGL 4176
Deeply embedded and at distances of several kiloparsecs, massive young stellar objects (MYSOs) present numerous challenges for observation and study. In this work, we present spatially-resolved observations of one MYSO, AFGL 4176, together with survey and literature data, ranging from interferometric observations with VLTI/MIDI in the mid-infrared, to single-dish Herschel measurements in the far-infrared, and sub-millimeter data from APEX. We consider this spatially-resolved, multi-wavelength data set in terms of both radiative transfer and geometric models. We find that the observations are well described by one-dimensional models overall, but there are also substantial deviations from spherical symmetry at scales of tens to hundreds of astronomical units, which are revealed by the mid-infrared interferometric measurements. We use a multiple-component, geometric modeling approach to explain the mid-infrared emission on scales of tens to hundreds of astronomical units, and find the MIDI measurements are well described by a model consisting of a one-dimensional Gaussian halo and an inclined () circumstellar disk extending out to several hundred astronomical units along a position angle of 160°. Finally, we compare our results both with previous models of this source, and with those of other MYSOs, and discuss the present situation with mid-infrared interferometric observations of massive stars.
Key Words.:
stars: formation - techniques: interferometric - techniques: high angular resolution - radiative transfer - stars: individual: AFGL 41761 Introduction
The class of objects known as massive young stellar objects (MYSOs) are thought to represent massive stars at the earliest phases of evolution. The inherently large distances (several kpc) and high extinctions ( mag) to typical MYSOs complicate attempts to characterize these objects observationally, and many studies (e.g. Grave & Kumar 2009) rely on fitting the spectral energy distribution (SED) to untangle the underlying physics involved in the formation of massive stars.
However, it has been shown that pure SED fitting, i.e. without making use of any spatial information, is a highly degenerate approach, at best (e.g. Thamm et al. 1994; Men’shchikov & Henning 1997). Different physical scales and temperature regimes of the circumstellar material can be resolved using a variety of techniques at different wavelengths, ranging from weakly-resolved single-telescope measurements, spectroscopic (spectroastrometric) measurements, and interferometric measurements, both at near-/mid-infrared and (sub-)millimeter wavelengths. The temperatures and regions thus probed range from K gas within the dust sublimation radius using spectroastrometry of molecular gas lines (e.g. Wheelwright et al. 2010), K dust at the inner dust disk radius using near-infrared interferometry (e.g. Kraus et al. 2010), K dust farther out in the disk (and possibly into outflow cones) using mid-infrared interferometry (e.g. Linz et al. 2009), and the broad distribution of cold K dust using millimeter-wave interferometry (e.g. Beuther et al. 2007) and single-dish measurements (e.g. Beltrán et al. 2006).
In this paper, we present observations and the results of multi-wavelength modeling of one particular massive young stellar object, AFGL 4176 (also known as IRAS 13395-6153, G308.9+0.1). This object was identified as a candidate MYSO based on the similarity of the far-infrared spectrum to that of the Becklin-Neugebauer (BN) object in Orion (Henning et al. 1984, 1990). The class of so-called BN-type objects are luminous ( L☉) sources, extremely red (usually with no optical counterpart), with a broad peak in emission (flat spectrum in ) between 50 and 200 m and deep absorption due to silicates at 10 m. They are generally interpreted as young (possibly still forming) massive stars, surrounded by a thick dust envelope, despite the unclear nature of the prototype object Orion BN (see the work by Tan (2004), for example).
At radio wavelengths, using the Molonglo Observatory Synthesis Telescope (MOST), Caswell et al. (1992) reported a small-diameter source (02) roughly coincident with the IR source AFGL 4176. The integrated flux densities are 0.31 Jy at 843 MHz and 0.40 Jy at 1415 MHz, confirming the emission is thermal bremsstrahlung radiation arising from an H II region. Using the Australian Telescope Compact Array (ATCA), Phillips et al. (1998) reported compact continuum emission at 8.6 GHz spanning about 10″, with a collection of 6.7 GHz methanol masers on the northern edge. Later, Ellingsen et al. (2005) showed the 8.6 GHz continuum emission extends to about 1′. Finally, the 1.2 mm dust continuum was mapped by Beltrán et al. (2006), and comprises a roughly circular, ″ clump at the same location with an estimated mass of 1120 M☉ at 5.3 kpc, and a fainter clump (estimated mass 177 M☉ at 5.3 kpc) about 15 to the east.
In the near infrared, AFGL 4176 is a point source for seeing-limited observations. Using speckle interferometry, however, Leinert et al. (2001) found a faint extended halo in the band, with a size of . The positions from the Two Micron All Sky Survey (2MASS) and the methanol masers reported by Phillips et al. (1998) are within 07. De Buizer (2003) detected a large number of shocked H2 emission blobs around AFGL 4176 by means of narrow-band NIR imaging. However, their spatial distribution does not reveal a preferred direction for a potential jet, and in general, the association of AFGL 4176 with a jet or outflow remains unclear. The source was also observed in the mid- through far- infrared by the space missions IRAS, MSX, ISO, Spitzer and Herschel. We note that the coordinates listed in the IRAS Point Source Catalog appear to be erroneous when compared with the MSX 12 m and Spitzer 24 m images, and adopt the 2MASS position of (J2000) as the location of the infrared source. The ISO spectrum shows deep silicate absorption features at 9.7 and 18 m, as well as absorption due to water ice at 3 m, CO2 ice at 4.3 m, and emission lines of [Ne II] at 12.8 m; [S III] at 12.0, 18.7 and 33.5 m; [O I] at 145.5 m and possibly 63.2 m; and [C II] at 157.7 m.
The distance to AFGL 4176 remains poorly constrained. Using both the velocity curve of Brand & Blitz (1993) with updated parameters from Levine et al. (2008), and the velocity curve of Reid et al. (2009), we find that the combination of the source’s LSR velocity of km s-1 (e.g. Fontani et al. 2005; De Buizer et al. 2009) and galactic coordinates are forbidden111We note that the tangential solution of these velocity curves at the coordinates of AFGL 4176 occurs for km s-1 and corresponds to about 5.3 kpc, which may explain the kinematic distances reported by other authors.. Consequently, a kinematic distance cannot be determined for AFGL 4176 using these rotation curves. Despite this, several authors (e.g. Beltrán et al. 2006; Fontani et al. 2005; Grave & Kumar 2009) report kinematic distances of around kpc. Saito et al. (2001) showed that the spread in velocities of C18O molecular clumps in the vicinity is high ( km s-1), meaning that kinematic estimates of the distance to this object should be highly uncertain, even after improvement of the galactic structure parameters. To date, other means of the distance measurements (e.g. maser parallax measurements) have not been applied to AFGL 4176. Because of this uncertainty, we consider the observational data in terms of both “near” (3.5 kpc) and “far” (5.3 kpc) distances, corresponding to the edges of the large C18O complex as determined by Saito et al. (2001).
The present paper is similar in scope to previous infrared interferometric studies of MYSOs by Linz et al. (2009); Follert et al. (2010); de Wit et al. (2010); Kraus et al. (2010). However, in this work on AFGL 4176, we go beyond traditional SED modeling techniques and use a far more comprehensive approach, including not only flux values, but also spatial information at mid-infrared, far-infrared, and sub-millimeter wavelengths directly into the fitting process. Such an approach helps to break the degeneracies inherent in modeling the SEDs of deeply-embedded sources, and provides structural information on scales ranging from tens of AU up to a parsec. We begin by presenting and discussing new observations of AFGL 4176, then go to one-dimensional radiative transfer modeling of the entire data set. Next, we use a geometric component analysis of the mid-infrared interferometric data to explore deviations from spherical symmetry, which we interpret as strong evidence for a circumstellar disk around this object. Finally, we compare the results of our study with those of previous studies of this object, as well as studies of other MYSOs.
2 Observations and data reduction
2.1 Mid-infrared interferometry
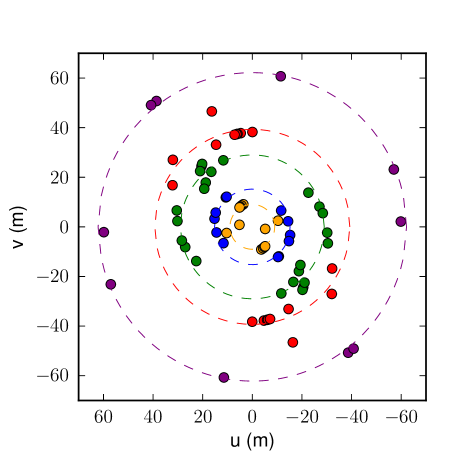
AFGL 4176 was observed with the two-telescope mid-infrared interferometer MIDI on the Very Large Telescope Interferometer (VLTI) of the European Southern Observatory on Cerro Paranal in Chile. Observations were conducted in 2005-2007 and 2011-2012 with both the 8.2 m Unit Telescopes (UTs) and the 1.8 m Auxiliary Telescopes (ATs) as part of guaranteed-time observations (proposal IDs 074.C-0389, 075.C-0755, 076.C-0757, 077.C-0440, 078.C-0712 and 084.C-1072). In total, 37 points in the plane were obtained for projected baselines ranging from 5 to 62 meters and a variety of position angles, with six of the measurements obtained with the UT telescopes, while the remaining 31 were obtained with the AT telescopes. This represents, by far, the largest collection of long-baseline mid-infrared interferometric observations presented for a MYSO to date. A summary of the observations is shown in Table 1, and the coverage is shown in Fig. 1. For clarity, the individual observations have been color-coded by projected baseline length: purple indicates measurements with the longest baselines (60-64 m); red (36-49 m) and green (25-32 m) show those with intermediate baselines; blue (13-16 m) and orange (5-11 m) mark the shortest baseline measurements.
| Date/time | Telescopes | Proj. baseline | Position angle | Avg. visibility |
|---|---|---|---|---|
| (UTC) | (m) | (deg.) | ||
| 2005-03-02 08:08 | UT3-UT4 | 61.6 | 112.1 | 0.02 |
| 2005-06-24 04:54 | UT3-UT4 | 61.8 | 169.3 | 0.02 |
| 2005-06-25 22:50 | UT1-UT2 | 49.3 | 19.3 | 0.07 |
| 2005-06-26 02:05 | UT1-UT2 | 41.9 | 49.8 | 0.08 |
| 2005-06-26 03:27 | UT1-UT2 | 36.3 | 62.4 | 0.04 |
| 2005-06-27 03:31 | UT2-UT3 | 30.3 | 85.6 | 0.08 |
| 2006-02-22 05:46 | E0-G0 | 16.0 | 41.9 | 0.30 |
| 2006-04-18 08:01 | D0-G0 | 26.5 | 121.4 | 0.06 |
| 2006-04-24 07:30 | E0-G0 | 13.4 | 119.4 | 0.31 |
| 2007-02-11 06:24 | E0-G0 | 16.0 | 40.5 | 0.23 |
| 2007-02-12 06:18 | G0-H0 | 31.9 | 40.0 | 0.13 |
| 2007-03-15 07:08 | G0-H0 | 31.2 | 77.7 | 0.11 |
| 2007-03-16 09:13 | G0-H0 | 28.3 | 106.8 | 0.07 |
| 2007-04-18 04:55 | E0-G0 | 15.6 | 77.8 | 0.20 |
| 2007-05-24 01:51 | E0-G0 | 15.8 | 68.7 | 0.27 |
| 2007-06-19 02:35 | G0-H0 | 28.9 | 101.0 | 0.06 |
| 2007-07-03 01:31 | E0-G0 | 14.6 | 98.9 | 0.28 |
| 2011-05-09 02:15 | B2-C1 | 9.8 | 21.7 | 0.47 |
| 2011-05-09 02:49 | B2-C1 | 9.6 | 27.0 | 0.46 |
| 2011-05-09 03:14 | B2-C1 | 9.5 | 31.0 | 0.49 |
| 2011-05-09 03:29 | B2-C1 | 9.4 | 33.4 | 0.52 |
| 2011-05-09 04:54 | B2-D0 | 25.9 | 46.4 | 0.18 |
| 2011-05-09 05:27 | B2-D0 | 24.7 | 51.6 | 0.16 |
| 2011-05-09 08:28 | B2-C1 | 5.3 | 80.9 | 0.61 |
| 2011-05-10 02:23 | B2-D0 | 29.3 | 23.5 | 0.20 |
| 2011-05-10 03:46 | B2-D0 | 27.7 | 36.7 | 0.19 |
| 2012-02-01 09:04 | A1-B2 | 10.7 | 103.5 | 0.51 |
| 2012-02-24 05:20 | D0-H0 | 63.8 | 37.3 | 0.06 |
| 2012-02-24 05:30 | D0-H0 | 63.8 | 39.8 | 0.06 |
| 2012-02-24 09:29 | D0-H0 | 59.9 | 92.0 | 0.05 |
| 2012-03-26 09:05 | I1-K0 | 32.4 | 38.6 | 0.11 |
| 2012-03-26 09:41 | I1-K0 | 30.8 | 43.1 | 0.10 |
| 2012-03-27 05:21 | I1-K0 | 38.0 | 9.1 | 0.10 |
| 2012-03-27 05:26 | I1-K0 | 37.9 | 9.7 | 0.09 |
| 2012-03-27 05:34 | I1-K0 | 37.8 | 10.9 | 0.09 |
| 2012-03-27 07:09 | I1-K0 | 36.2 | 23.8 | 0.10 |
| 2012-03-29 04:08 | I1-K0 | 38.2 | 179.9 | 0.09 |
We used the prism as the dispersive element, resulting in spectrally-resolved visibility amplitudes and differential phases with a resolution of in the wavelength range m. All observations were carried out in the HIGHSENS mode, meaning the correlated flux and the photometric measurements are done separately. For a detailed description of this observing procedure, see the work by Leinert et al. (2004). In general, every science measurement was preceded and/or followed by a calibration measurement of a bright single star of known diameter.
The raw data were reduced using the MIA+EWS package version 1.7.1. Masks were generated for each interferometric measurement from the corresponding photometric data. From the calibrator measurements taken throughout the night, we computed the mean sensitivity function, relating counts/s to Jy of correlated flux. The uncertainty in this sensitivity function was taken to be the standard deviation over all the calibrator measurements in the night, and is typically on the order of 10%.
Because the quality of the photometric data from the ATs is generally poor, we assume AFGL 4176 to be non-variable and use an average total spectrum from the UTs for computing the visibility amplitude from the correlated flux. Uncertainties in the final visibilities were calculated using standard error propagation formulae.
2.2 Far-infrared imaging
The AFGL 4176 region was covered by far-infrared observations taken by the Herschel Space Observatory (Pilbratt et al. 2010), within the framework of the Hi-GAL survey (Molinari et al. 2010). In this paper, we present bolometer data at 70 and 160 m, obtained with the PACS instrument (Poglitsch et al. 2010) on August 16, 2010. These data are scan maps with a scan rate of 60′′/s, which slightly degrades the spatial resolution compared to the theoretical diffraction limit. After onboard preprocessing, the data are transmitted with a downlink rate of 5 frames/s for the 70 m filter, and 10 frames/s for the 160 m filter. The final resulting spatial resolution for the 70 m data is about 92, and 126 for the 160 m data, although the true PSF is asymmetric. For a more detailed description of the observing procedure used in the Hi-GAL program, we refer to the description of the observing strategy by Molinari et al. (2010).
We extracted the level-0 data from the Herschel Science Archive of the relevant strip covering AFGL 4176 (OBSIDs 1342203085 and 1342203086). Despite the occurrence of very bright far-infrared sources in the Hi-GAL fields, these observations were performed with the normal high-gain settings for the PACS bolometers. The level-0 data were processed with the HIPE software (Ott 2010) version 8.0.3178 up to the so-called level-1, where internal data units have been translated to Janskys, and outliers (i.e. glitches) in the data and saturated pixels have been removed or masked.
In addition to these standard procedures, we applied a task for eliminating the electronic cross-talk within the bolometers, which can cause the appearance of ghosts close to strong compact sources. Furthermore, we use a module recently developed by the instrument team which applies a non-linearity correction to the data. This is especially important for our purpose, since in the high-gain mode used for the Hi-GAL program, very bright sources will trigger a non-linear response in the bolometer behavior, resulting in an altered PSF and decreasing measured fluxes by .
The removal of noise and effects resulting from temperature drifts within the bolometers, as well as the final mapping, was done using the version 7 of the Scanamorphos program (Roussel 2012, submitted to PASP), for which we used the “galactic,” “noglitch” and “parallel” options. Final maps were produced with a pixel scale of 32 for both filters, which is the native plate scale for the 70 m bolometers, and half the native plate scale for the 160 m bolometers.
2.3 870 m imaging
AFGL 4176 was also imaged at 870 m as part of the APEX Telescope Large Area Survey of the Galaxy (ATLASGAL). We refer to the publication by Schuller et al. (2009) regarding the general outline of this sub-millimeter continuum survey, and the technical details of the observations and the data reduction. In the present work, we use a map from the re-reduction of the data in 2011, done by the F. Schuller, using refined methods for thermal drift removal within the bolometer reduction software BOA (Schuller et al. 2009). Furthermore, the treatment of strong sources within the iterative process of the data reduction has been improved. Finally, the data have been mapped onto a 6-arcsec grid, using version 2.18 of the mapping software SWarp (Bertin 2010), which prevents the formation of spurious Moiré patterns still present in earlier ATLASGAL maps.
3 Results
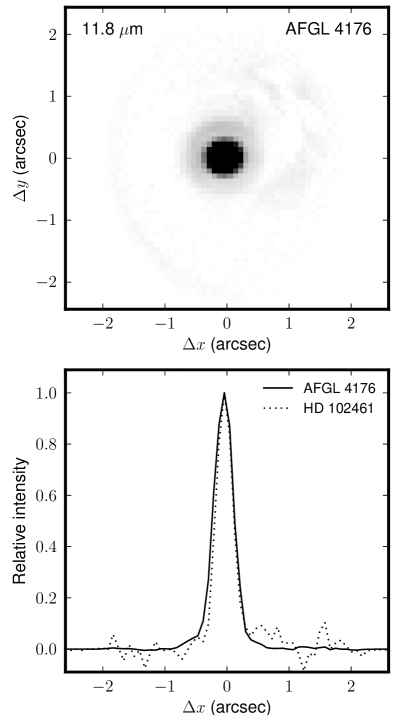

We show an AO-corrected acquisition image of AFGL 4176 obtained with the 8.2 m telescope UT3 on Mar. 2, 2005 in the upper panel of Fig. 2. The image was obtained using the SiC filter, which has a central wavelength of 11.8 m and a width of 2.32 m. In the lower panel, we compare a cut through the acquisition image of AFGL 4176 with an analogous cut through the acquisition image of the unresolved calibrator star HD 102461, which was observed immediately after the science source. From the similarity of the spatial cut through the image of AFGL 4176 to that of the calibrator, we conclude that AFGL 4176 is at most marginally resolved in diffraction-limited 8 m-class telescope images at -band wavelengths.
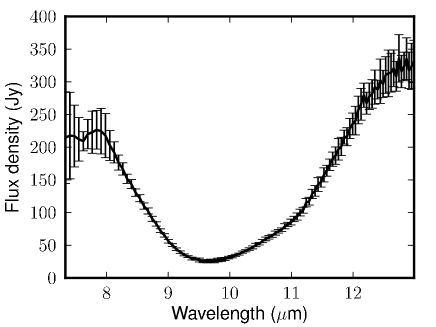
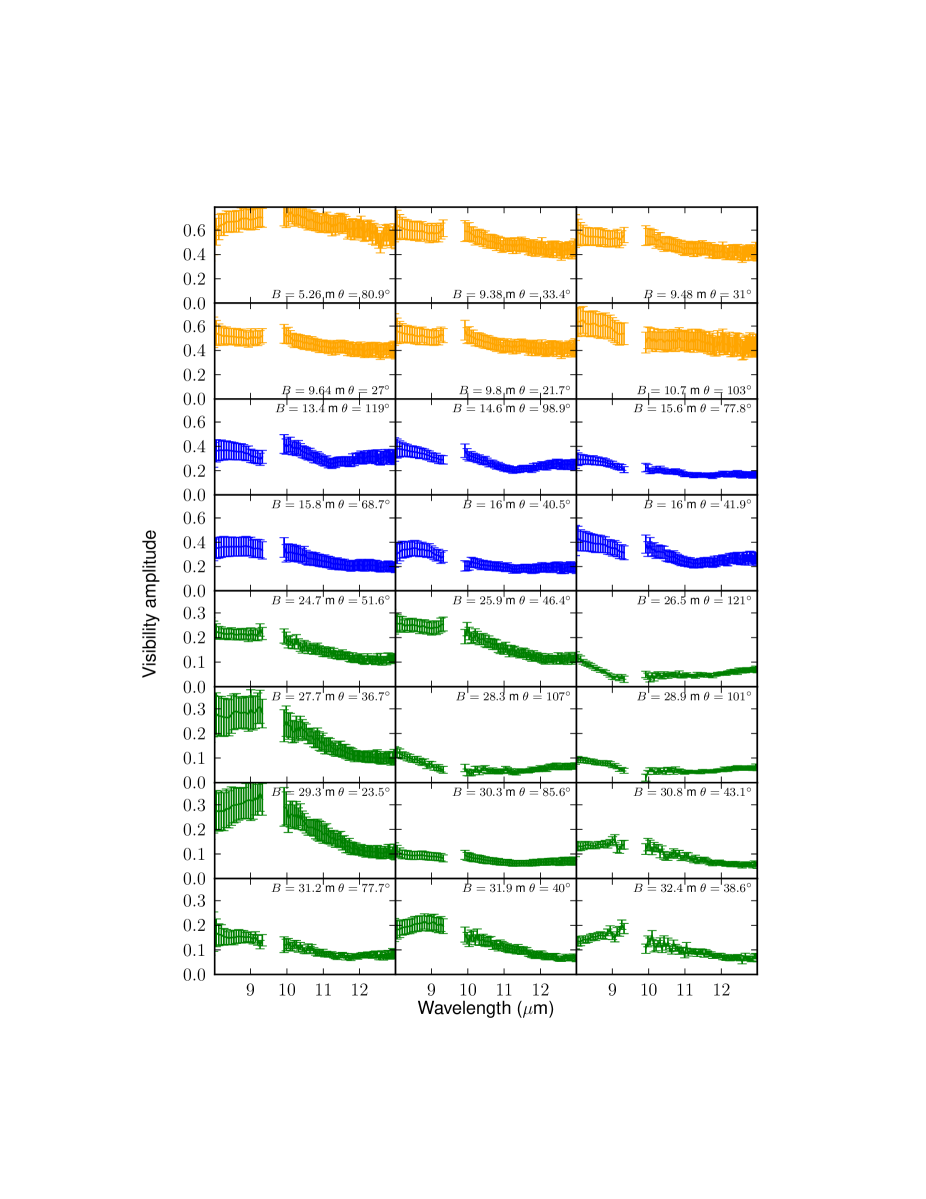
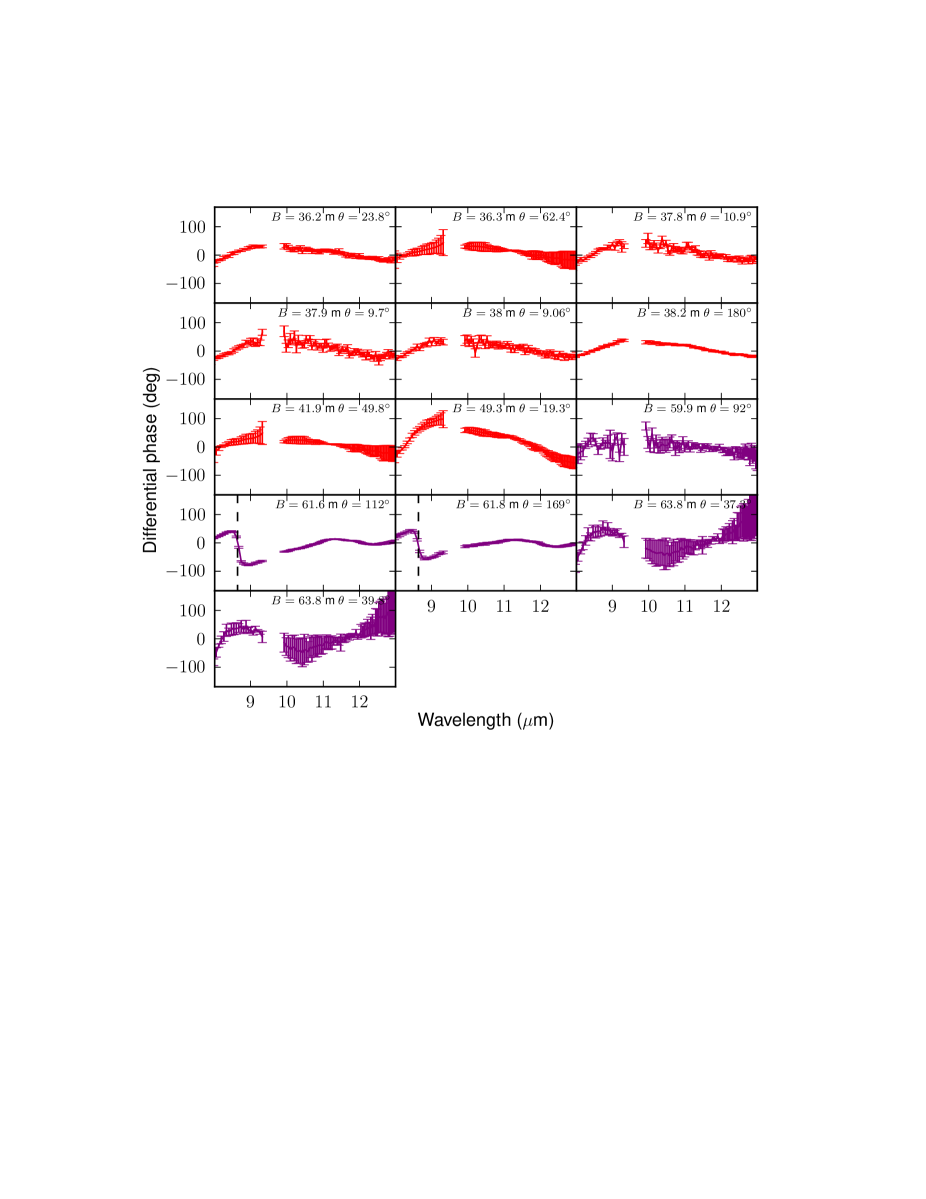
In Fig. 3, we show the average -band spectrum of AFGL 4176 from the 8.2 m UT telescopes, used to derive the visibility amplitude from the correlated flux measurements. The visibility amplitudes as a function of wavelength are shown in Fig. 4, where the measurements have been ordered by projected baseline length, and are presented using the same color scheme as in Fig. 1. Finally, in Fig. 5, we show the differential phases measured with MIDI for the measurements with m (the differential phases at shorter baselines are not shown, as they are essentially zero).
We note the clear presence of a zero crossing in both the visibility amplitude and differential phase for the two measurements with and m, indicated with a vertical dashed line in Figs. 4 and 5. We previously interpreted this as evidence for circular symmetry at the smallest scales probed (Boley et al. 2011). In order to test this hypothesis, we targeted this spatial frequency for follow-up observations with the ATs at other position angles on Feb. 24, 2012 (the remaining “purple” measurements in Figs. 1, 4 and 5). However, while a non-zero differential phase is measured, a zero crossing is clearly not present in these follow-up observations, implying deviations from spherical symmetry at the smallest angular scales probed by MIDI.
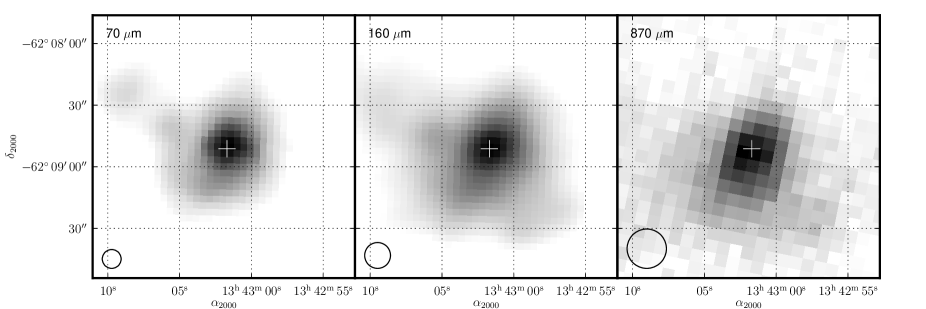
In Fig. 6, we show the images at 70 and 160 m (Hi-GAL) and 870 m (ATLASGAL). The approximate beam size for each image is 92, 126 and 192, respectively, and is shown as a circle in the lower left-hand corner of each image. The position of the infrared source is indicated as a cross in each image. The position of the emission peak in the Hi-GAL data corresponds to that of the 2MASS source to within the pointing accuracy of the observations. In the ATLASGAL data, the emission peak lies ″ south of the IR position, although this is also within the rms pointing accuracy of the ATLASGAL observations.
At the Hi-GAL wavelengths, within a 36″ aperture, we measure flux densities of 2382 Jy and 1383 Jy at 70 m and 160 m, respectively. While the absolute flux calibration on these data is accurate to within 5% (Herschel PACS Report PICC-ME-TN-037, Apr. 12, 2011), there is significant, non-uniform background emission in the region which is difficult to account for. Therefore, these values should be treated as upper limits, as it is not clear where the background begins to dominate and the extended emission associated with the source stops. The 870 m emission is also quite extended; within a 19″ aperture, which covers just the central emission peak, we measure an integrated flux density of 2.86 Jy, while in a larger 72″ aperture, covering the extended emission, we measure an integrated flux density of 10.6 Jy.
| Wavelength | Flux density | Aperture | Reference |
|---|---|---|---|
| (m) | (Jy) | (″) | |
| 1.25 | 4 | (1) | |
| 1.65 | 4 | (1) | |
| 2.20 | 4 | (1) | |
| 9.0 | 11 | (2) | |
| 12.0 | (3) | ||
| 18.0 | 11 | (2) | |
| 25.0 | (3) | ||
| 60.0 | (3) | ||
| 65.0 | 27 | (2) | |
| 70.0 | 36 | (4) | |
| 90.0 | 27 | (2) | |
| 100.0 | (3) | ||
| 140.0 | 44 | (2) | |
| 160.0 | 44 | (2) | |
| 160.0 | 36 | (4) | |
| 870.0 | 19 | (4) | |
| 870.0 | 72 | (4) | |
| 1200.0 | 39 | (5) |
(1) 2MASS; (2) AKARI; (3) IRAS; (4) This work; (5) Beltrán et al. (2006)

In Table 2 we list the photometric data and effective aperture sizes from previous works and surveys which we consider in modeling our source. Unless noted otherwise, we compare our model data (see Sec. 4.1) to the observations by considering the flux contribution within a Gaussian aperture with the same FWHM as the observational data.
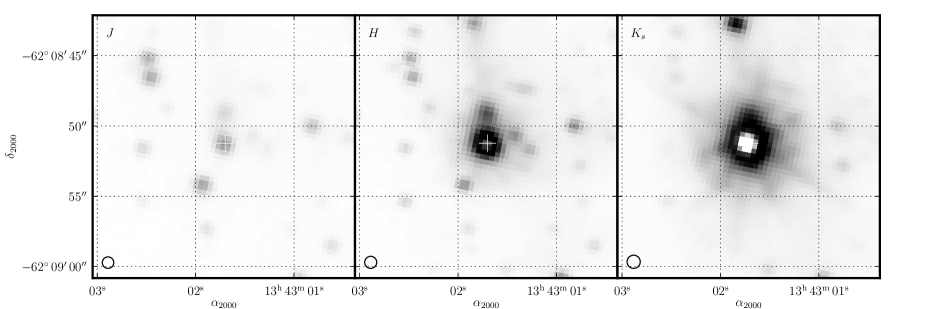
In Fig. 7, we show -, - and -band images of AFGL 4176 and its immediate surroundings from the first data release of the ESO public survey VISTA Variables in the Vía Láctea (VVV; Saito et al. 2012). These images were obtained on the 4 m VISTA telescope on Cerro Paranal, and surpass 2MASS both in spatial resolution and sensitivity. The seeing for the , and images presented here is 082, 086 and 094, respectively. AFGL 4176 is present as a bright, compact source, and saturated in both the and images.
Finally, the region around AFGL 4176 was mapped in several molecular lines as part of the Millimeter Astronomy Legacy Team 90 GHz (MALT90) survey (Foster et al. 2011) with the Mopra 22 m telescope. Of the 16 spectral lines which were mapped as part of the survey, HCO+ was the brightest in AFGL 4176. The HCO+ line data, shown in Fig. 8, have a spectral resolution of km s-1. This line is a tracer of dense molecular gas, and has been used as an outflow indicator (e.g. Hofner et al. 2001). However, in the case of AFGL 4176, the spectrum is very well approximated by a Gaussian (FWHM 3.5 km s-1), and shows no signs indicating the presence of an outflow.
4 Analysis
4.1 One-dimensional radiative transfer modeling
As shown in Sec. 3, AFGL 4176 shows evidence for deviations from spherical symmetry only at the scales probed by our mid-infrared interferometric observations, which correspond to scales of roughly 20 to 200 mas. Furthermore, no outflow component has been revealed in searches by De Buizer (2003) and De Buizer et al. (2009), nor in the HCO+ data presented in this work (Fig. 8). Since there is no evidence for asymmetry or preferred geometry on scales larger than a few hundred AU, we begin with one-dimensional models to explore the overall structure of this source.
We model AFGL 4176 using the one-dimensional radiative transfer code MoDust, which was developed by A. de Koter and J. Bouwman. MoDust uses the Feautrier method to solve the radiative transfer equation (Feautrier 1964), and has been used previously by e.g. Malfait et al. (1999); Kemper et al. (2001); Bouwman et al. (2001). Using MoDust, the dust temperature structure is iteratively solved for a given density structure and dust properties. Different opacities can be given for different temperature regimes, thus making it possible to dynamically determine the distributions of different types of dust throughout the model.
Using this code, we produce radial intensity profiles of the source image on the sky at all wavelengths for which we have observations, i.e. from 1.25 m to 1.2 mm. From these radial intensity profiles, we calculate aperture-corrected flux values for the SED, PSF-convolved images for comparison with the Hi-GAL and ATLASGAL data333For the PACS array on Herschel, we took the PSFs from the PACS calibration web site (http://herschel.esac.esa.int/twiki/bin/view/Public/PacsCalibrationWeb). For the LABOCA bolometer array used on the APEX telescope, we take the PSF to be well-approximated by a Gaussian with FWHM = 192 (Siringo et al. 2009)., and interferometric visibilities for comparison with the MIDI data. We do not attempt to match the near-IR VVV images, as AFGL 4176 is saturated in them. The relative goodness of fit of models was assessed by constructing a estimate which includes roughly equal contribution from these three measures.
4.1.1 Constraints and uncertainties on fundamental parameters
As noted in the introduction, the distance to AFGL 4176 cannot be reliably determined at present. We therefore chose to investigate both near and far models, at distances of 3.5 and 5.3 kpc, respectively.
Under the assumption that the H II region seen in radio observations is powered by the AFGL 4176 source, the number of ionizing photons, and consequently a minimum inferred spectral type, can be determined. The radio flux measurements at 843 and 1415 MHz of Caswell et al. (1992) appear to be consistent with thermal bremsstrahlung radiation from an H II region. For a distance of 5.3 kpc, using the main-sequence luminosities for O stars from Martins et al. (2005) and the stellar atmosphere models of Kurucz (1979), we find a minimum spectral type of the central source of about O8. This corresponds to an effective temperature of about 33 000 K, which we adopt for the temperature of the central blackbody source in our models.
For the amount of foreground extinction, we adopt a simple prescription of 1 magnitude of visual extinction per kiloparsec, giving us and mag for the near and far models, respectively. This small amount of additional (i.e. interstellar) extinction was applied on top of our models, and has the effect of further lowering the near-IR flux levels and slightly deepening the 10 m silicate feature.
4.1.2 Dust model
One of the foremost practical constraints on the choice of dust model is the need for opacities at short wavelengths ( m). Since the luminosity of this source is on the order of L☉ and the amount of ionizing flux (inferred from the radio continuum observations) is equivalent to at least an O8 star star, the vast majority of the stellar radiation is emitted at UV and optical wavelengths.
A number of attractive dust models for conditions expected in protostellar cores, envelopes and protoplanetary disks have been developed (for example by Ossenkopf & Henning 1994; Henning & Stognienko 1996; Semenov et al. 2003). However, a common shortcoming of these models is the lack of opacity information at short (UV) wavelengths, due to convergence problems of the grain models (D. Semenov, private communication). On the other hand, the empirically derived opacities of Laor & Draine (1993) and subsequent works cover wavelengths from 100 Å through 1 mm, with the caveats that the real physical makeup of the dust is unknown, and that at far-IR and (sub)mm wavelengths, where extinction is effectively impossible to measure, the dust opacities are not well known.
We therefore adopt a multi-component, temperature-dependent dust model, guided by the presence of known spectral features in the observations, and limited by the available coverage and reliability of different opacity models at different wavelength regimes. The transition between different regimes, and therefore the presence of different species throughout the surrounding material, are governed by the temperature structure iteratively solved by MoDust.
Based on the presence of the 3.1 m water ice absorption feature in the ISO SWS spectrum, we infer that at least some of the amorphous silicate grains are surrounded by ice mantles, formed in the cold material of the parent molecular cloud. To include this in our model, we use opacities from the coagulation model of Ossenkopf & Henning (1994). Following the suggestions in that paper, we interpolate between columns 1 and 2 of their Table 1 using the depth of the 3.1 m ice feature. From the ISO SWS spectra, we measure , and use the resulting interpolated opacities for regions where K.
For grains with K, we use the “astronomical silicates” and graphite grains of Laor & Draine (1993) with the “MRN” distribution of grain sizes ( for grains between 5 nm and 250 nm, where is the number of grains, and is the grain radius), which is generally appropriate for diffuse ISM conditions. We adopt a ratio of 60:40 for the silicate to graphite mass abundance in this temperature regime, although we note this is not directly constrained by observations. For the graphite grains, we adopt a destruction temperature of 950 K, which corresponds to the process of OH sputtering (Duschl et al. 1996). For the silicate grains, we do not enforce a destruction temperature; at the inner edge of our envelope models, the silicate grains typically reach a temperature of about 2000 K.
The dust model therefore consists of a region of “cold” ( K) amorphous silicate and carbon grains with ice mantles, as well as “warm” (130 K K for graphites, and 130 K for silicates) amorphous grains similar to the “standard” diffuse ISM mix.
4.1.3 Density structure
For the density structure of the dust in our model, we adopt a piecewise power law consisting of concentric, spherical shells, with no gaps in between the shells. In order to simultaneously reproduce the observed visibility levels, far-IR/sub-mm spatial distributions and SED with this model, we find it necessary to include at least three shells, with a jump in density at the interface between the first (innermost) shell and the second shell. At the interface between the second and third shells, however, we were able to achieve acceptable fits without a density jump, thereby avoiding the need for an additional model parameter describing this. We therefore characterize the density of material in the outer shells by the density at the contact point of the second and third shells. The precise structure used, therefore, has in principle nine free parameters (, , , , , , , , ) and follows the form
| (1) |
4.1.4 Results
| Model | ||||||||||||
|---|---|---|---|---|---|---|---|---|---|---|---|---|
| (kpc) | (AU) | (AU) | (AU) | (AU) | (g cm-3) | (g cm-3) | (M☉) | ( L☉) | ||||
| Near | 3.5 | 40 | 65 | 70 000 | 125 000 | 1.8 | 1.05 | 0.5 | 4.70 | 1.44 | ||
| Far | 5.3 | 58 | 108 | 56 000 | 195 000 | 1.2 | 0.9 | 0.5 | 15.8 | 2.88 | ||
| G91 | 4.0 | — | 100 | 2646 | 50 134 | — | — | 2.0 | 0.0 | 1.32 | 1.57 |
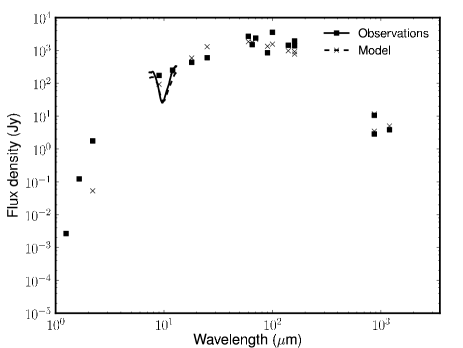
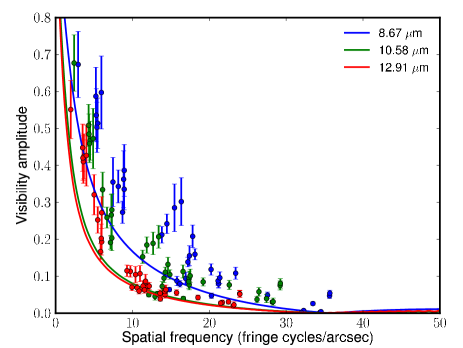
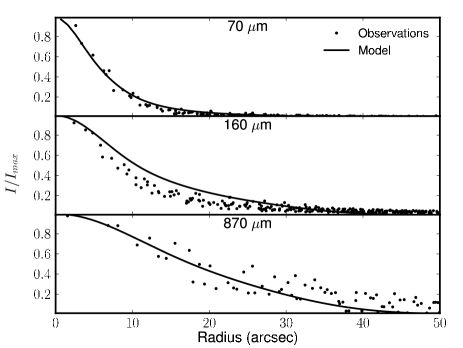
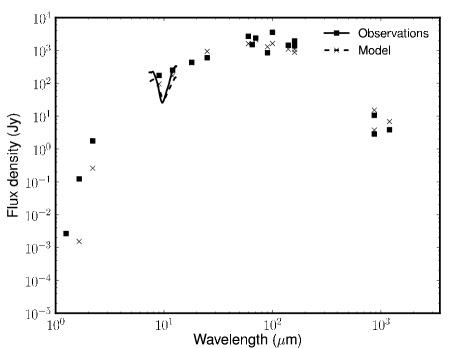
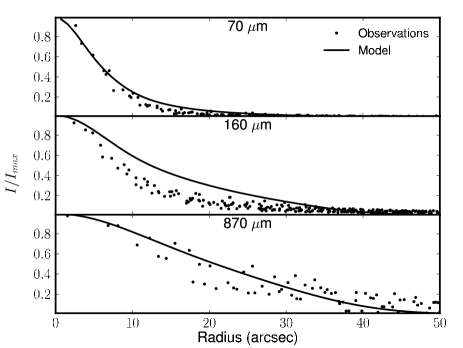
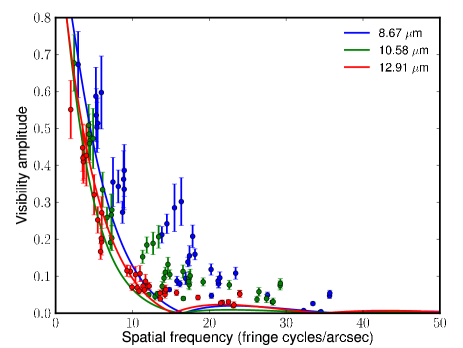
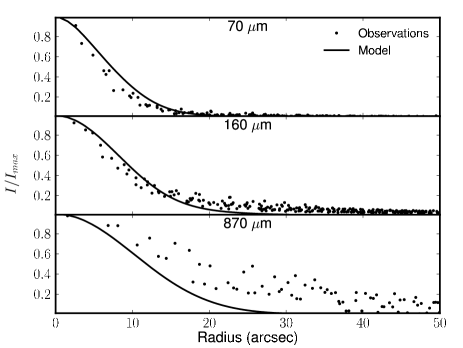
We present two fits to the observational data using the three-shell model: one for the “near” distance of 3.5 kpc, and one for the “far” distance of 5.3 kpc. The parameters are summarized in the first two lines of Table 3; comparisons with the observations are shown in Figs. 9 and 10: the top panel shows the modeled flux levels from the photometric data from Table 2; the center panel shows the modeled MIDI visibilities at three wavelengths; and the lower panel shows the radial distributions from Herschel (70 and 160 m) and APEX (870 m).
We defer a detailed discussion of the results to Sec. 5, but note the most prominent points of the model fits here. Both models reproduce the SED reasonably well at wavelengths longer than about 8 m, but significantly underestimate the near-infrared flux levels. Both models also reproduce the overall visibility levels, as well as the spatial frequency of the zero crossing, however the far model provides a much better match, particularly at the two shorter wavelengths (red and green points in the middle panels of Figures 9 and 10). Finally, despite the good agreement of the radial profiles at wavelengths of 70 and 870 m, both models overestimate the extent of emission at 160 m, although the near model is in better agreement with the observed radial profile. The 160 m filter might be contaminated by strong [C II] emission at 157 m, detected in emission in the ISO LWS spectrum, which could alter the spatial profile of the brightness distribution seen in this broadband filter. However, since no spatially-resolved [C II] spectral map is available for AFGL 4176, this ad-hoc explanation is not beyond doubt.
4.2 Two-dimensional geometric modeling
While the one-dimensional approaches used above can provide useful insight, the deviations from spherical symmetry observed in the MIDI data should be explored. Such deviations can become especially clear in cases where multiple points have been measured with similar projected baselines (i.e., spatial frequencies), but differing position angles. Any significant variations in the visibility amplitude for a given spatial frequency will thus require deviations from a circularly-symmetric intensity distribution to be explained.
We see clear signs of such behavior for projected baselines longer than about 25 m, particularly for spatial frequencies larger than fringe cycles/arcsec. For small variations in spatial frequency, we see visibility levels varying by over a factor of 5. Furthermore, there is a clear dependence on position angle: for measurements with , the visibility amplitude decreases with increasing position angle, while for measurements with , the visibility amplitude decreases with increasing position angle.
This behavior (visibility amplitude increasing with position angle for , and decreasing with position angle for ) cannot be modeled with a simple elongated Gaussian. However, such a trend is possible in the case of a source distribution which has a well defined “edge” in its intensity distribution, causing a zero-crossing in the complex visibility with substantial power in the first side-lobe, for example a disk model.
| Parameter | Best fit value |
|---|---|
| 158 mas1 | |
| 0.467 | |
| 1.64 | |
| 143 mas2 |
To model this asymmetric behavior, we use a simple parameterized disk to match the dependence on position angle seen in our MIDI visibility measurements. We approximate the disk with a geometrically thin, optically thick blackbody emitter, with a temperature depending on radius in the form of a power law in the form of
| (2) |
where is the temperature at a fix-point , and and are the inner and outer disk radii, respectively. We adopt K, i.e. the approximate evaporation temperature of silicate dust, and let , i.e. the radius at which a blackbody of luminosity will have a temperature of 1500 K. For the luminosity of our far model, AU. We find that models in which the inner disk radius is at provide poor fits to our MIDI data, and a substantially smaller inner radius is required. We adopt AU, which is well below the spatial frequencies probed by our MIDI measurements. We thus implicitly assume the inner disk, consisting of gas, remains optically thick. This is in line with interferometric measurements of high-mass young stars, whose disk emission appears consistently more compact than expected for dusty, disk-only models (e.g. Monnier et al. 2005).
Finally, to account for the more symmetric behavior at shorter baselines, we include a one-dimensional component in the image intensity distribution in the form of a Gaussian centered on the disk. Thus, as fit parameters, we use the outer radius of the disk , the disk inclination and position angle , the exponent of the temperature power-law, the flux ratio of the Gaussian component to the disk component, and the FWHM of the Gaussian component.
4.2.1 Results
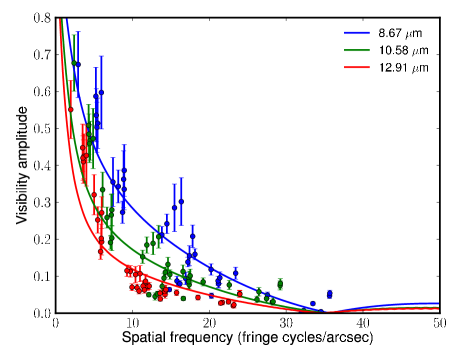
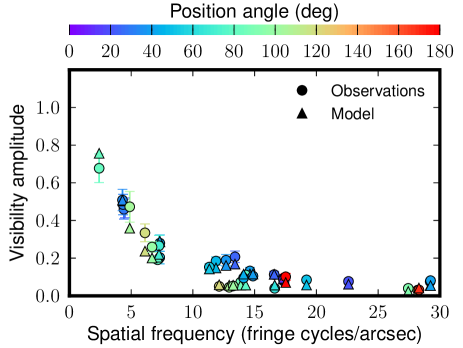
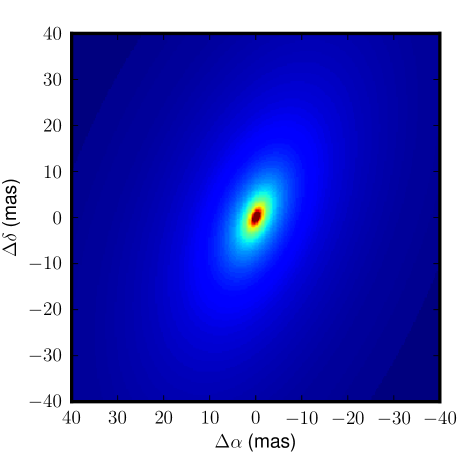
The parameters that best fit the observed MIDI visibilities were derived from a brute-force grid search of parameter space, where we further refine the parameters of the best fit from the grid search by using the downhill simplex algorithm. We find that this disk model produces a very good fit to our data, and in Table 4, we summarize the parameters of our best-fit model to the MIDI visibilities at a wavelength of 10.6 m. We show the resulting model visibilities as triangles in Fig. 11, and the model image in Fig. 12.
The observations are best described by a disk spanning up to several hundred AU, with the disk temperature decreasing gradually as a function of radius (). The disk is inclined (), and the semi-major axis is oriented east of north. Besides the disk component, a substantial halo is also present, with a FWHM size equal to about half the diameter of the disk, and a total flux at m of 1.6 times the disk component.
5 Discussion
5.1 Comparison with previous models
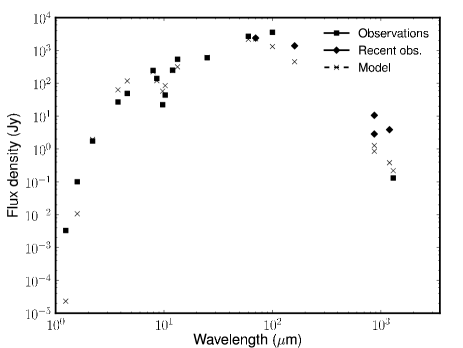
In order to gauge the importance of including spatial information in the modeling process, we reconstructed the one-dimensional radiative transfer model for this object presented by Gürtler et al. (1991), using their dust composition and density structure together with the MoDust code used for our models. The model from Gürtler et al. (1991), which we refer to as G91, is a two-zone power-law model, and can be described using the density prescription from Eq. 1 if the parameters , and are omitted. In Table 3, we show the parameters for the G91 model using this prescription.
In Fig. 13 we show the resulting SED, mid-infrared visibilities, and far-infrared/sub-mm radial intensity profiles. Note that Gürtler et al. (1991) fit only the SED to the extent it was known at the time, and that they did not have detailed spatial information (i.e. mid-IR interferometry and far-IR imaging) available. We indicate the measurements they had available by squares in Fig. 13, while the more recent Hi-GAL and ATLASGAL measurements, as well as the 1.2 mm measurement from Beltrán et al. (2006), are indicated by diamonds. Regarding the flux values available at the time of their study, we note in particular that their 1.3 mm measurement of 131 mJy was probably in error, as the position indicated in their Table 2 is more than 50″ from the infrared source. More recently, for example, Beltrán et al. (2006) reported a 1.2 mm flux value of 3.86 Jy for the source, which seems to be in good agreement with the ATLASGAL flux level of 11.56 Jy at 870 m which we present here.
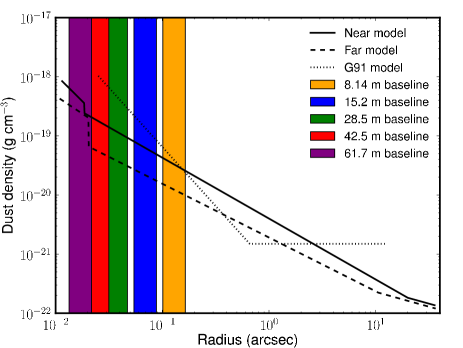
In Fig. 14, we show the density laws used for both our near and far models, as well as the G91 model. To account for the different distances to the source used in each model (see Table 3), we express the dust density as a function of angular position on the sky. We also overlay the effective angular scales probed by our MIDI measurements, where have used the same color coding and grouping by projected baseline as in Fig. 1.
For the near and far models, we see that the inner shell with enhanced density is probed primarily by the longest baseline measurements, while shorter baselines probe successively larger scales, out to about 01. Because this inner region is completely absent in the G91 model, the mid-IR visibilities at longer baselines are vastly under-predicted by this model. This is despite the relatively good fit to the SED (with the exception of the sub-mm/mm regime), as well as the 70 and 160 m radial profiles, which only emphasizes the importance of including spatial information at different scales into such radiative transfer models.
5.2 The disk around AFGL 4176
The mid-infrared interferometric observations presented in this paper provide the first evidence for any signs of asymmetry in this deeply-embedded MYSO to date. Using a model consisting of a symmetric halo and an optically thick, geometrically thin disk, we find that a disk with an inclination angle of and a position angle of the semi-major axis of east of north provides an excellent fit to our MIDI data. The best-fit temperature profile of the disk is . At longer wavelengths, the deviation from spherical symmetry in our MIDI data is much less pronounced, which suggests that the emission from the disk is dominated by a more spherical halo component at these wavelengths.
Nevertheless, because of the wavelength range, mid-infrared observations probe primarily cooler material ( K), expected to be well away from the hotter, inner circumstellar regions where signs of accretion onto the central star may be present. Furthermore, the inner radius of the disk around AFGL 4176, adopted in this work to be 1 AU, cannot be determined by our observations, as it remains unresolved by the MIDI data. In this context, near-infrared interferometric observations which probe these inner regions would make a superb compliment to the current data set.
On the other hand, the lack of detection of an outflow component, or any other larger-scale asymmetries, remains an open question. This may, for example, suggest that the object is still at a very early stage in the formation process, and that large-scale outflows have not had time to form. In any case, far-IR/sub-mm interferometric observations with ALMA may provide the key to bridging the symmetric structure on scales of tens to hundreds of thousands of AU to the asymmetries observed at tens to hundreds of AU.
5.3 Comparison with other MYSOs
| MYSO | (kpc) | (L☉) | (mag) | H II region present? | Outflows present? | References |
|---|---|---|---|---|---|---|
| AFGL 4176 | Yes | ? | 1, 2, 3 | |||
| W33A | 3.8 | 280 | Yes | Yes | 4 | |
| NGC 3603 IRS 9A | 7 | ? | Yes | ? | 5 | |
| AFGL 2136 | 1.7 | 100 | Yes | Yes | 6, 7 | |
| IRAS 13481-6124 | 3.2 | 40? | Yes | Yes | 8 | |
| M8E-IR | 1.5 | 30 | No | Yes | 9 |
To date, very few MYSOs have been studied on scales of tens to hundreds of AUs. Here we compare our results with similar studies of five other MYSOs. In Table 5 we list the luminosities, the depth of the 10 m silicate absorption feature, whether or not any compact H II region is present, and whether or not any outflows have been detected, which can be useful for independently constraining disk geometry. As previously noted, however, in the case of AFGL 4176, no outflow components have been detected (De Buizer 2003; De Buizer et al. 2009).
The sources W33A and NGC 3603 IRS 9A have similar luminosities to AFGL 4176, on the order of , and both have associated hyper-compact H II regions. However, IRS 9A seems to be much less embedded: besides having an optical component, the -band spectrum shows no 10 m silicate feature at all. At mid-infrared wavelengths, the source is very extended, and completely overresolved in MIDI observations probing AU scales (Vehoff et al. 2010). W33A, on the other hand, could be even more embedded than AFGL 4176 ( mag, de Wit et al. 2010), but the -band visibility levels are poorly determined due to the low amount of (correlated) flux in the deep 10 m silicate absorption feature. The source was modeled by de Wit et al. (2010), who concluded that most of the mid-infrared emission on scales of AU is dominated by collimated outflow cones, without compelling evidence for significant emission from a dusty disk.
At an estimated luminosity of L☉, the SED of AFGL 2136 closely resembles that of AFGL 4176, including a similar depth of the 10 m silicate feature (Smith et al. 2000). Using visibility measurements obtained with MIDI, both de Wit et al. (2011) and Follert (2011) reported mid-IR emission scales of AU, while Follert (2011) found an elongated structure at these scales, parallel to earlier predictions of disk orientation.
Despite having a lower luminosity, on the order of , the SED of IRAS13481-6124 is somewhat similar to that of AFGL 4176, although the 10 m silicate feature is much shallower in IRAS13481-6124. Kraus et al. (2010) discovered a molecular outflow, and used near-IR interferometric observations to resolve an elongated structure oriented perpendicular to the outflow direction. The extended outflow shocks detected at near-IR wavelengths at large distances from the source (Stecklum et al. 2010555http://www.jcu.edu.au/hmsf10/Presentations/Monday/Session3/Stecklum.pdf), as well as the radiative transfer models presented by Kraus et al. (2010), suggest the disk is strongly inclined. However, the 20 M☉ (gas + dust mass) disk at scales of 5-150 AU proposed by Kraus et al. (2010) is clearly a fundamentally different model than the structures we present here for AFGL 4176. For comparison, the dust mass enclosed in the near and far models for AU is M☉ and M☉, respectively, although a direct comparison between studies using near- and mid-IR interferometric measurements is difficult.
Finally, the source with the lowest luminosity, M8E-IR, has an overall extinction of mag, as determined from the depth of the 10 m silicate feature (Linz et al. 2009). Outflow signatures have been detected for this source (Mitchell et al. 1988). No cm continuum emission has been detected directly coinciding with the IR object. This lack of an ultra-compact H II region might be related to the hypothesis of a bloated, cooler central object, as suggested by Linz et al. (2009).
Given the small selection of sources for which this information is available, it is not possible to infer clear, empirical correlations between the properties listed in Table 5. Of the sources presented, none of them seem to be direct analogues of AFGL 4176, however W33A might be the closest match in terms of luminosity, SED and emission scales at mid-infrared wavelengths. Suggestions by de Wit et al. (2011) and Linz et al. (2011) indicate that mid-IR interferometric observations of at least some MYSOs may be heavily influenced by outflow components. On the other hand, the mid-IR visibilities presented by Follert (2011) apparently trace the disk structure of AFGL 2136. Taken together, it becomes clear that the mid-IR emission structure of MYSOs at scales of tens to hundreds of AUs can be complex, and caution should be exercised in interpreting data sets with limited coverage.
6 Summary and conclusions
In this paper, we reported on spatially resolved observations and modeling of the massive young stellar object AFGL 4176. We presented the largest amount of -band visibilities for any MYSO to date, obtained with MIDI on the ESO/VLTI, together with maps of extended emission at 70 and 160 m from the Hi-GAL survey on the Herschel Space Observatory and 870 m imaging from the ATLASGAL survey with the APEX telescope.
With the exception of the mid-infrared interferometric measurements presented in this paper, the observational data available for this deeply-embedded object do not provide indications of asymmetry or preferred geometry. In view of this, we used spherically symmetric radiative transfer models, consisting of an envelope with a density enhancement at its inner edge, to model the source. Using these one-dimensional models, we were able to satisfactorily reproduce, simultaneously, the SED and spatial structure at mid-IR through mm wavelengths.
However, the one-dimensional models by definition cannot reproduce the asymmetries present in the MIDI data. We therefore modeled these data separately, using a multiple-component geometric analysis. We interpret the MIDI observations in terms of a circumstellar disk around AFGL 4176. If this disk hypothesis is correct, it would make AFGL 4176 the most luminous (massive) young star to have a disk detected around it to date. However, beyond initial detection, much remains to be clarified regarding the nature and extent of the disk, making this object a top priority for additional interferometric imaging, at both near-IR and far-IR/sub-mm wavelengths.
Acknowledgements.
We would like to thank our referee, Dr. Koji Murakawa, for insightful critique during the review process of this manuscript. We thank Christoph Leinert, Svitlana Zhukovska, Dima Semenov and Keiichi Ohnaka for useful discussions. We also express our gratitude to Frederic Schuller for generously making the reduced ATLASGAL observations available to us, and Şeyma Çalişkan for supporting work during an earlier phase of this project. AMS was partly supported by Russian state contract No. 16.518.11.7074 and the Russian Foundation for Basic Research (grants 11-02-01332 and 11-02-97124-p).References
- Beltrán et al. (2006) Beltrán, M. T., Brand, J., Cesaroni, R., et al. 2006, A&A, 447, 221
- Bertin (2010) Bertin, E. 2010, in Astrophysics Source Code Library, record ascl:1010.068, 10068
- Beuther et al. (2007) Beuther, H., Leurini, S., Schilke, P., et al. 2007, A&A, 466, 1065
- Boley et al. (2011) Boley, P., van Boekel, R., Linz, H., et al. 2011, arXiv:1111.0807
- Bouwman et al. (2001) Bouwman, J., Meeus, G., de Koter, A., et al. 2001, A&A, 375, 950
- Brand & Blitz (1993) Brand, J. & Blitz, L. 1993, A&A, 275, 67
- Caswell et al. (1992) Caswell, J. L., Kesteven, M. J., Stewart, R. T., Milne, D. K., & Haynes, R. F. 1992, ApJ, 399, L151
- De Buizer (2003) De Buizer, J. M. 2003, MNRAS, 341, 277
- De Buizer et al. (2009) De Buizer, J. M., Redman, R. O., Longmore, S. N., Caswell, J., & Feldman, P. A. 2009, A&A, 493, 127
- de Wit et al. (2010) de Wit, W. J., Hoare, M. G., Oudmaijer, R. D., & Lumsden, S. L. 2010, A&A, 515, A45
- de Wit et al. (2011) de Wit, W. J., Hoare, M. G., Oudmaijer, R. D., et al. 2011, A&A, 526, L5
- Duschl et al. (1996) Duschl, W. J., Gail, H., & Tscharnuter, W. M. 1996, A&A, 312, 624
- Ellingsen et al. (2005) Ellingsen, S. P., Shabala, S. S., & Kurtz, S. E. 2005, MNRAS, 357, 1003
- Feautrier (1964) Feautrier, P. 1964, Comptes Rendus Academie des Sciences (serie non specifiee), 258, 3189
- Follert (2011) Follert, R. 2011, PhD thesis, University of Heidelberg, Germany
- Follert et al. (2010) Follert, R., Linz, H., Stecklum, B., et al. 2010, A&A, 522, A17
- Fontani et al. (2005) Fontani, F., Beltrán, M. T., Brand, J., et al. 2005, A&A, 432, 921
- Foster et al. (2011) Foster, J. B., Jackson, J. M., Barnes, P. J., et al. 2011, ApJS, 197, 25
- Grave & Kumar (2009) Grave, J. M. C. & Kumar, M. S. N. 2009, A&A, 498, 147
- Gürtler et al. (1991) Gürtler, J., Henning, T., Krügel, E., & Chini, R. 1991, A&A, 252, 801
- Henning et al. (1984) Henning, T., Friedemann, C., Guertler, J., & Dorschner, J. 1984, Astronomische Nachrichten, 305, 67
- Henning et al. (1990) Henning, T., Pfau, W., & Altenhoff, W. J. 1990, A&A, 227, 542
- Henning & Stognienko (1996) Henning, T. & Stognienko, R. 1996, A&A, 311, 291
- Hofner et al. (2001) Hofner, P., Wiesemeyer, H., & Henning, T. 2001, ApJ, 549, 425
- Kemper et al. (2001) Kemper, F., Waters, L. B. F. M., de Koter, A., & Tielens, A. G. G. M. 2001, A&A, 369, 132
- Kraus et al. (2010) Kraus, S., Hofmann, K.-H., Menten, K. M., et al. 2010, Nature, 466, 339
- Kurucz (1979) Kurucz, R. L. 1979, ApJS, 40, 1
- Laor & Draine (1993) Laor, A. & Draine, B. T. 1993, ApJ, 402, 441
- Leinert et al. (2001) Leinert, C., Haas, M., Ábrahám, P., & Richichi, A. 2001, A&A, 375, 927
- Leinert et al. (2004) Leinert, C., van Boekel, R., Waters, L. B. F. M., et al. 2004, A&A, 423, 537
- Levine et al. (2008) Levine, E. S., Heiles, C., & Blitz, L. 2008, ApJ, 679, 1288
- Linz et al. (2011) Linz, H., Follert, R., Boley, P. A., et al. 2011, arXiv:1111.0821
- Linz et al. (2009) Linz, H., Henning, T., Feldt, M., et al. 2009, A&A, 505, 655
- Malfait et al. (1999) Malfait, K., Waelkens, C., Bouwman, J., de Koter, A., & Waters, L. B. F. M. 1999, A&A, 345, 181
- Martins et al. (2005) Martins, F., Schaerer, D., & Hillier, D. J. 2005, A&A, 436, 1049
- Men’shchikov & Henning (1997) Men’shchikov, A. B. & Henning, T. 1997, A&A, 318, 879
- Mitchell et al. (1988) Mitchell, G. F., Allen, M., Beer, R., et al. 1988, ApJ, 327, L17
- Molinari et al. (2010) Molinari, S., Swinyard, B., Bally, J., et al. 2010, PASP, 122, 314
- Monnier et al. (2005) Monnier, J. D., Millan-Gabet, R., Billmeier, R., et al. 2005, ApJ, 624, 832
- Ossenkopf & Henning (1994) Ossenkopf, V. & Henning, T. 1994, A&A, 291, 943
- Ott (2010) Ott, S. 2010, in Astronomical Society of the Pacific Conference Series, Vol. 434, Astronomical Data Analysis Software and Systems XIX, ed. Y. Mizumoto, K.-I. Morita, & M. Ohishi, 139–+
- Phillips et al. (1998) Phillips, C. J., Norris, R. P., Ellingsen, S. P., & McCulloch, P. M. 1998, MNRAS, 300, 1131
- Pilbratt et al. (2010) Pilbratt, G. L., Riedinger, J. R., Passvogel, T., et al. 2010, A&A, 518, L1+
- Poglitsch et al. (2010) Poglitsch, A., Waelkens, C., Geis, N., et al. 2010, A&A, 518, L2+
- Reid et al. (2009) Reid, M. J., Menten, K. M., Zheng, X. W., et al. 2009, ApJ, 700, 137
- Roussel (2012) Roussel, H. 2012, arXiv:1205.2576
- Saito et al. (2001) Saito, H., Mizuno, N., Moriguchi, Y., et al. 2001, PASJ, 53, 1037
- Saito et al. (2012) Saito, R. K., Hempel, M., Minniti, D., et al. 2012, A&A, 537, A107
- Schuller et al. (2009) Schuller, F., Menten, K. M., Contreras, Y., et al. 2009, A&A, 504, 415
- Semenov et al. (2003) Semenov, D., Henning, T., Helling, C., Ilgner, M., & Sedlmayr, E. 2003, A&A, 410, 611
- Siringo et al. (2009) Siringo, G., Kreysa, E., Kovács, A., et al. 2009, A&A, 497, 945
- Smith et al. (2000) Smith, C. H., Wright, C. M., Aitken, D. K., Roche, P. F., & Hough, J. H. 2000, MNRAS, 312, 327
- Tan (2004) Tan, J. C. 2004, ApJ, 607, L47
- Thamm et al. (1994) Thamm, E., Steinacker, J., & Henning, T. 1994, A&A, 287, 493
- Vehoff et al. (2010) Vehoff, S., Hummel, C. A., Monnier, J. D., et al. 2010, A&A, 520, A78
- Wheelwright et al. (2010) Wheelwright, H. E., Oudmaijer, R. D., de Wit, W. J., et al. 2010, MNRAS, 408, 1840