Optical signatures of quantum dot excitons in carbon nanotubes
Abstract
We report optical studies of quantum dot excitons in individual suspended carbon nanotubes at cryogenic temperatures. Narrow optical linewidths, strongly suppressed spectral wandering, and photoluminescence lifetimes in the range of nanoseconds emerge as key signatures of exciton localization. We infer exciton quantum dot formation with a characteristic length of a few exciton Bohr radii. Localization inhibits exciton diffusion and protects the exciton from dephasing by structural or environmental inhomogeneities as well as from exploring nonradiative quenching sites. In consequence, quantum dot excitons in carbon nanotubes exhibit intrinsic radiative lifetimes, long coherence times and a quantum yield of . Our results underpin the potential of carbon nanotube excitons for both fundamental studies and applications that scale advantageously with enhanced spectral resolution and coherence.
Semiconducting single-walled carbon nanotubes (CNTs) exhibit absorption O’Connell et al. (2002) and emission Bachilo et al. (2002) in the near-infrared as a consequence of excitonic Wang et al. (2005); Maultzsch et al. (2005) creation and recombination pathways. Residing entirely on the nanotube surface and mobile along the axis on length scales that at room temperature far exceed the exciton Bohr radius Lefebvre et al. (2006); Cognet et al. (2007); Lüer et al. (2009) nanotube excitons are highly sensitive to variations in the CNT structure as well as the immediate surrounding. This, on the one hand, is very attractive for CNT-based applications in optical sensing Barone et al. (2005); Withey et al. (2012). On the other hand it renders CNT excitons susceptible to environmental dephasing Duque et al. (2009) or quenching at nonradiative defect sites Cognet et al. (2007). In consequence, extrinsic effects currently limit in part our quantitative understanding of the photophysical properties of CNTs which is key to the development of novel nanotube-based optoelectronic devices.
Here we demonstrate that exciton localization in as-grown suspended nanotubes facilitates the study of intrinsic optical properties of CNTs. As a consequence of quantum dot (QD) exciton formation we found photoluminescence (PL) lifetimes in the range of nanoseconds at the temperature of liquid helium ( K) as predicted by theory for the intrinsic radiative lifetime of CNT excitons Perebeinos et al. (2004, 2005); Spataru et al. (2005). Moreover, the PL spectra are as narrow as eV and free of spectral wandering, identifying ps time scale as a lower bound to the exciton coherence time. Alike monolayer-fluctuation QDs in narrow semiconductor quantum wells Hess et al. (1994) or QDs formed by self-assembly Leonard et al. (1993), QDs in our CNT material occur unintentionally. In addition to spectrally narrow emission lines QD excitons in CNTs share other remarkable properties with their celebrated zero-dimensional counterparts in compound semiconductors such as characteristic resonances in photoluminescence excitation (PLE), spectral signatures of exciton-phonon interaction and strong photon antibunching Högele et al. (2008).
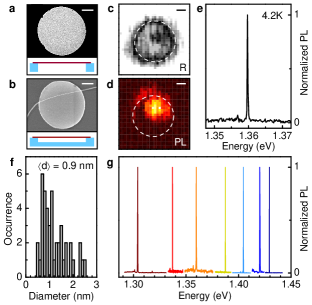
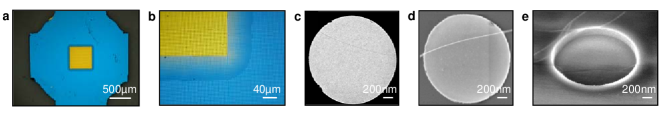
Our surprising findings are a result of the interplay between rational sample design and accidental exciton localization. A central aspect of our sample design, inspired by results from electron transport spectroscopy in clean CNTs Cao et al. (2005), was the use of as-grown suspended CNTs without any post-processing. Transmission and scanning electron micrographs in Fig. 1a and 1b show representative images of suspended CNTs on our sample. The carrier substrate, Si3N4 coated with SiO2, has two distinct regions with holes and craters of m diameter (schematics in Fig. 1a and b). Our chemical vapor deposition (CVD) method, unspecific to spatial catalyst positioning, yielded a homogeneous CNT density over the entire sample of mm dimensions. In this study we present measurements on CNTs suspended over craters as in Fig. 1b SM .
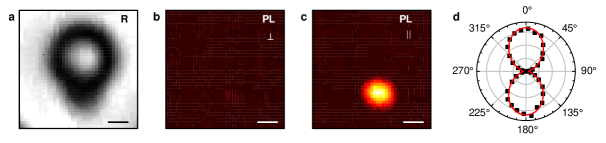
A representative confocal PL map of such a crater is shown in Fig. 1d: intense and faint PL signals were detected in the inner part and at the outer perimeter of the crater, respectively. The spatial extent of the crater was mapped out with raster-scan reflection imaging (the reduced laser reflection by the crater ground in Fig. 1c is due to its out-of-focal-plane displacement). The PL intensity displayed a pronounced antenna effect SM , a characteristic feature of individual CNTs Hartschuh et al. (2003). Spectral dispersion of the luminescence revealed a remarkably narrow emission line (Fig. 1e) centered at eV and confined to CCD-pixels of eV spectral width. This feature of a resolution-limited linewidth was consistently observed for all CNTs studied in the emission window eV with representative PL spectra displayed in Fig. 1g. The spread in emission energies is related on the one hand to different chiralities present in our CVD-material with a mean diameter of nm (Fig. 1f), and to dissimilarities between CNTs of the same chirality on the other hand. CNTs of five different chiralities, and , are likely to emit at K into the spectral window of Fig. 1g SM .
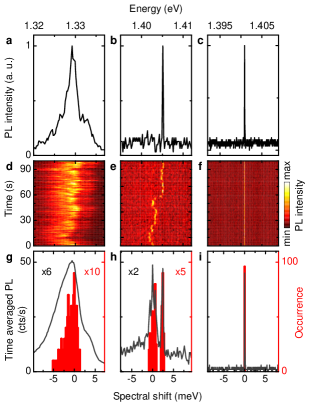
Narrow optical linewidths at cryogenic temperatures are untypical for CNTs Lefebvre et al. (2004); Htoon et al. (2004); Kiowski et al. (2007); Högele et al. (2008). For reference we studied nanotubes obtained by the same growth procedure in contact with SiO2 as well as commercial CoMoCat-nanotubes with comparable diameters Bachilo et al. (2003) encapsulated in SDS and dispersed on SiO2 SM . Under similar experimental conditions CoMoCat-nanotubes typically exhibited asymmetric PL profiles Htoon et al. (2004); Högele et al. (2008); Galland et al. (2008) with linewidths of meV (Fig. 2a), one order of magnitude broader than our CVD-grown nanotubes in s integration time (Fig. 2b and c). While on longer timescales of the experiment the linewidth of the time-averaged PL broadened even further for reference CNTs (time averaged PL spectra in Fig. 2g and h), suspended CNTs showed no change in the emission profile irrespective of the integration time (effective integration time of s in Fig. 2i and up to several days of observation). PL time traces in Fig. 2d - f reveal that spectral wandering is responsible for the broadening of the optical linewidth on meV energy scale, in accord with previous reports Htoon et al. (2004); Kiowski et al. (2007); Högele et al. (2008); Matsuda et al. (2008). At the same time it also accounts for apparent fine-structure Lefebvre et al. (2004); Matsuda et al. (2008) and to some extent for the asymmetry in the spectral profile (histograms in Fig. 2g - I): an initially narrow spectrum of a CVD-nanotube in contact with SiO2 (Fig. 2b) developed in the course of integration (corresponding to time averaging of the PL trace in Fig. 2e) an asymmetric peak accompanied by a satellite (Fig. 2h). For suspended CNTs, these features of spectral wandering are entirely absent within the spectral resolution and on all time scales of our experiment (Fig. 2c, f, i).
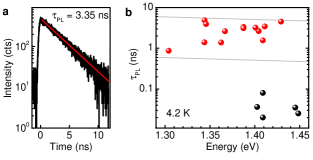
Another remarkable signature of suspended CNTs was revealed by time-resolved PL spectroscopy. For all suspended tubes we observed monoexponential PL decay with timescales above one nanosecond. A PL decay trace for a single CNT with a decay time of ns is shown in Fig. 3a. Nanoseconds decay times, one order of magnitude longer than in the CoMoCat reference material (red vs black circles in Fig. 3b), are in stark contrast to all previous reports. Room-temperature experiments determined both monoexponential Gokus et al. (2008) and biexponential Berciaud et al. (2008); Miyauchi et al. (2009); Gokus et al. (2010) decays depending on the material quality with decay times of the order of tens of ps. Similar results were obtained at low temperatures Hagen et al. (2005). Consensus between ps PL lifetimes observed experimentally and intrinsic exciton lifetimes predicted by theory Perebeinos et al. (2004, 2005); Spataru et al. (2005) was achieved by assuming rapid nonradiative decay channels arising from defects.
It is unlikely that our CNTs are entirely free of defects. Even if they were perfect in crystalline structure and free of surface adsorbates, the exciton should diffusively explore the nanotube and eventually encounter the substrate supports at the ends of the suspended segment of m length at maximum. We argue therefore that the excitons in our CNTs are localized in QDs. Being immobile they do not encounter nonradiative quenching sites and therefore exhibit intrinsic exciton lifetimes. At the same time localization ensures narrow emission profiles by protecting the exciton from diffusively exploring inhomogeneities along the tube axis which would give rise to line broadening via dephasing. Taking the resolution limit as a conservative value for the total linewidth we arrive at dephasing times above ps. Unlike diffusive excitons in CNTs, localized QD excitons exhibit both long decay and dephasing times as key signatures of their optical characteristics.
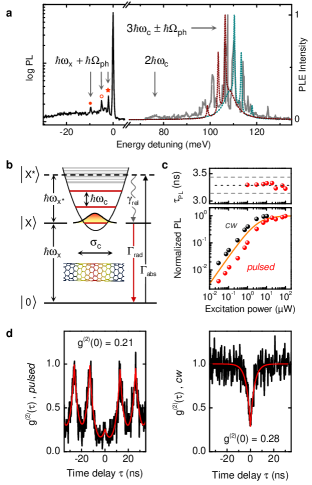
Taking the PL decay time as the intrinsic exciton lifetime allows us to estimate the strength of the confinement potential SM . Localization limits the exciton coherence length to the confinement length (Fig. 4b) that we estimate to exciton Bohr radii nm Capaz et al. (2006) on the basis of PL lifetimes in the range of ns and theoretically calculated oscillator strengths Perebeinos et al. (2004, 2005); Spataru et al. (2005). For the QD exciton in Fig. 3a, ns implies a harmonic level spacing of meV. This number was confirmed with PLE spectroscopy (grey spectrum in Fig. 4a): the PL emission was enhanced for laser energy detunings of meV and meV above the lowest exciton state , consistent with resonances at and and weak anharmonicity. Both the PL (left graph in Fig. 4a) and the PLE spectra exhibited modulation by phonons with energies in the meV range. Clearly, different phonons are responsible for the modulation of the ground state and the third excited state that is of opposite symmetry: our simple model of the absorption resonance (Stokes and Anti-Stokes Raman spectra in Fig. 4a calculated as a convolution of the zero-phonon absorption line at with meV linewdith and meV broad phonon replica with energies meV, meV and meV as found in PL emission) fails to reproduce the PLE spectrum. The rich structure related to exciton-phonon interaction requires a more detailed analysis.
Remarkably, our quasi-resonant excitation scheme yields the saturation response of a three-level system (Fig. 4c). In time-resolved PL we found no evidence for Auger decay typically responsible for saturation effects in the CNT emission Murakami and Kono (2009). Despite saturation above W excitation powers the PL lifetime remained monoexponential within the temporal resolution of our detector (Fig. 4c) and without signatures of an emerging secondary decay. At the same time photon correlation results with pronounced antibunching (Fig. 4d) exclude multiexciton recombination. Instead, the saturation response is quantitatively captured with a model three-level system SM . The saturation function shown as solid line in Fig. 4c was obtained without free parameters, implying for QD excitons in CNTs a quantum yield of and no indication for shelving in the lowest-lying dark exciton states Perebeinos et al. (2005); Spataru et al. (2005).
Our results establish QD excitons as a new regime of CNT optics. In our samples exciton localization was obtained by chance. There is no fundamental reason, however, that precludes QD formation by design. Electrostatic traps are commonly used in CNT transport experiments to define and vary localization boundaries of electrons or holes, a strategy also applicable to neutral excitons Wilson-Rae et al. . Chemical functionalization of nanotube ends or structural modification on the atomic scale as used to assemble designer graphene Gomes et al. (2012) are alternative strategies to control the position and the extent of exciton localization. Paired with the exceptional mechanical properties of CNTs our results also stimulate novel experiments in nano-optomechanics.
The research was funded by the German Excellence Initiative via the Nanosystems Initiative Munich (NIM), with financial support from the Center for NanoScience (CeNS) and LMUexcellent. We thank J. P. Kotthaus for continuous support, S. Stapfner, C. Bourjau, R. Dehmel, and F. Storek for assistance with nanotube synthesis and sample fabrication. We acknowledge C. Schönenberger and M. Weiss for introducing to us in the early stage of the project their CNT synthesis at the University of Basel, Switzerland. A.H. thanks A. Imamoglu, P. Maletinsky, V. Perebeinos, S. Rotkin, A. Srivastava, and I. Wilson-Rae for useful discussions.
References
- O’Connell et al. (2002) M. J. O’Connell, S. M. Bachilo, C. B. Huffman, V. C. Moore, M. S. Strano, E. H. Haroz, K. L. Rialon, P. J. Boul, W. H. Noon, C. Kittrell, et al., Science 297, 593 (2002).
- Bachilo et al. (2002) S. M. Bachilo, M. S. Strano, C. Kittrell, R. H. Hauge, R. E. Smalley, and R. B. Weisman, Science 298, 2361 (2002).
- Wang et al. (2005) F. Wang, G. Dukovic, L. E. Brus, and T. F. Heinz, Science 308, 838 (2005).
- Maultzsch et al. (2005) J. Maultzsch, R. Pomraenke, S. Reich, E. Chang, D. Prezzi, A. Ruini, E. Molinari, M. S. Strano, C. Thomsen, and C. Lienau, Phys. Rev. B 72, 241402 (2005).
- Lefebvre et al. (2006) J. Lefebvre, D. G. Austing, J. Bond, and P. Finnie, Nano Letters 6, 1603 (2006).
- Cognet et al. (2007) L. Cognet, D. A. Tsyboulski, J.-D. R. Rocha, C. D. Doyle, J. M. Tour, and R. B. Weisman, Science 316, 1465 (2007).
- Lüer et al. (2009) L. Lüer, S. Hoseinkhani, D. Polli, J. Crochet, T. Hertel, and G. Lanzani, Nature Phys. 5, 54 (2009).
- Barone et al. (2005) P. W. Barone, S. Baik, D. A. Heller, and M. S. Strano, Nature Mater. 4, 86 (2005).
- Withey et al. (2012) P. A. Withey, V. S. M. Vemuru, S. M. Bachilo, S. Nagarajaiah, and R. B. Weisman, Nano Letters 12, 3497 (2012).
- Duque et al. (2009) J. G. Duque, M. Pasquali, L. Cognet, and B. Lounis, ACS Nano 3, 2153 (2009).
- Perebeinos et al. (2004) V. Perebeinos, J. Tersoff, and P. Avouris, Phys. Rev. Lett. 92, 257402 (2004).
- Perebeinos et al. (2005) V. Perebeinos, J. Tersoff, and P. Avouris, Nano Lett. 5, 2495 (2005).
- Spataru et al. (2005) C. D. Spataru, S. Ismail-Beigi, R. B. Capaz, and S. G. Louie, Phys. Rev. Lett. 95, 247402 (2005).
- Hess et al. (1994) H. F. Hess, E. Betzig, T. D. Harris, L. N. Pfeiffer, and K. W. West, Science 264, 1740 (1994).
- Leonard et al. (1993) D. Leonard, M. Krishnamurthy, C. M. Reaves, S. P. Denbaars, and P. M. Petroff, Appl. Phys. Lett. 63, 3203 (1993).
- Högele et al. (2008) A. Högele, C. Galland, M. Winger, and A. Imamoğlu, Phys. Rev. Lett. 100, 217401 (2008).
- Cao et al. (2005) J. Cao, Q. Wang, and H. Dai, Nature Materials 4, 745 (2005).
- (18) See supplementary materials.
- Hartschuh et al. (2003) A. Hartschuh, H. N. Pedrosa, L. Novotny, and T. D. Krauss, Science 301, 1354 (2003).
- Lefebvre et al. (2004) J. Lefebvre, P. Finnie, and Y. Homma, Phys. Rev. B 70, 045419 (2004).
- Htoon et al. (2004) H. Htoon, M. J. O’Connell, P. J. Cox, S. K. Doorn, and V. I. Klimov, Phys. Rev. Lett. 93, 027401 (2004).
- Kiowski et al. (2007) O. Kiowski, S. Lebedkin, F. Hennrich, and M. M. Kappes, Phys. Rev. B 76, 075422 (2007).
- Bachilo et al. (2003) S. M. Bachilo, L. Balzano, J. E. Herrera, F. Pompeo, D. E. Resasco, and R. B. Weisman, J. Am. Chem. Soc. 125, 11186 (2003).
- Galland et al. (2008) C. Galland, A. Högele, H. E. Türeci, and A. Imamoğlu, Phys. Rev. Lett. 101, 067402 (2008).
- Matsuda et al. (2008) K. Matsuda, T. Inoue, Y. Murakami, S. Maruyama, and Y. Kanemitsu, Phys. Rev. B 77, 193405 (2008).
- Gokus et al. (2008) T. Gokus, A. Hartschuh, H. Harutyunyan, M. Allegrini, F. Hennrich, M. Kappes, A. A. Green, M. C. Hersam, P. T. Araújo, and A. Jorio, Appl. Phys. Lett. 92, 153116 (2008).
- Berciaud et al. (2008) S. Berciaud, L. Cognet, and B. Lounis, Phys. Rev. Lett. 101, 077402 (2008).
- Miyauchi et al. (2009) Y. Miyauchi, H. Hirori, K. Matsuda, and Y. Kanemitsu, Phys. Rev. B 80, 081410 (2009).
- Gokus et al. (2010) T. Gokus, L. Cognet, J. G. Duque, M. Pasquali, A. Hartschuh, and B. Lounis, J. Phys. Chem. C 114, 14025 (2010).
- Hagen et al. (2005) A. Hagen, M. Steiner, M. B. Raschke, C. Lienau, T. Hertel, H. Qian, A. J. Meixner, and A. Hartschuh, Phys. Rev. Lett. 95, 197401 (2005).
- Capaz et al. (2006) R. B. Capaz, C. D. Spataru, S. Ismail-Beigi, and S. G. Louie, Phys. Rev. B 74, 121401 (2006).
- Murakami and Kono (2009) Y. Murakami and J. Kono, Phys. Rev. Lett. 102, 037401 (2009).
- (33) I. Wilson-Rae, C. Galland, W. Zwerger, and A. Imamoğlu, arXiv:0911.1330v1.
- Gomes et al. (2012) K. K. Gomes, W. Mar, W. Ko, F. Guinea, and H. C. Manoharan, Nature 483, 306 (2012).
Supplementary material
I Experimental details
I.1 Carbon nanotube samples
Chemical vapor deposition (CVD) was used to synthesize carbon nanotubes (CNTs) in a standard CVD furnace. The growth was assisted by a bimetallic FeRu catalyst. Catalyst particles were deposited on carrier substrates from the FeRu suspension either by spin or by drop coating. The samples were heated in the CVD furnace to C in an Ar/H2 () gas mixture. The growth procedure was optimized to yield a CNT density below m-2 and narrow-diameter nanotubes with a mean diameter below nm. Diameter distributions were obtained by tapping-mode atomic force microscopy on samples with CNTs on SiO2. Samples with as-grown CNTs in contact with SiO2 were used as reference material for density and diameter distributions as well as in cryogenic spectroscopy.
Suspended CNTs were synthesized on commercial grids typically used in transmission electron microscopy (TEM). The specific grid used in the experiments was perforated with holes of m diameter and a pitch of m (Fig. 1a) and coated with nm of SiO2 by plasma enhanced CVD. Fig. 1a and 1b show optical micrographs of the sample for two different magnifications. The grids provided for suspension of nanotubes in the region where the hole-perforated Si3N4 membrane was not supported by the underlying SiO2 frame; this region appears yellowish in Fig. 1a, b. In this region fully suspended nanotubes were identified by TEM imaging (Fig. 1c). In regions where the perforated membrane was in contact with the underlying carrier frame (blue regions in Fig. 1a and 1b) we identified with scanning electron microscopy (SEM) CNTs suspended over the full diameter of the crater (Fig. 1d) as well as CNTs that were suspended only near the walls of the crater (Fig. 1e).
Commercial CoMoCAT-nanotubes (SouthWest NanoTechnologies) encapsulated in sodium dodecylbenzenesulfonate (SDS) were dispersed out of an aqueous suspension on SiO2 substrates.
I.2 Cryogenic spectroscopy
For cryogenic spectroscopy we used a home-built confocal microscope with a full-width-half-maximum () diffraction-limited optical spot size of . The two-lens imaging system was not compensated for chromatic aberrations. The microscope was operated in a bath cryostat at temperatures of liquid nitrogen ( K) or liquid helium ( K).
The sample was characterized by scanning a finite area of a few and recording either the reflected signal of a laser diode at nm wavelength (Fig. 2a) or the PL intensity (Fig. 2b and 2c). For PL excitation a Ti:Sapphire laser in continuous wave (cw) mode was tuned between nm and nm. Strong antenna effect in the PL intensity (Fig. 2b, c, d) was characteristic for sample regions with individual CNTs. The PL was dispersed in a standard monochromator ( mm focal length) and detected with a nitrogen cooled silicon-CCD (with eV spectral width of one CCD pixel).
For time-resolved PL and pulsed photon correlation in a standard Hanbury-Brown and Twiss setup the Ti:sapphire laser was operated in the fs-pulsed mode ( fs pulse width, MHz repetition rate). PL was recorded by avalanche photodiodes (APDs) with a temporal resolution of ps. A streak-camera with ps temporal resolution was used for PL lifetime measurements of micelle-encapsulated CoMoCAT nanotubes.
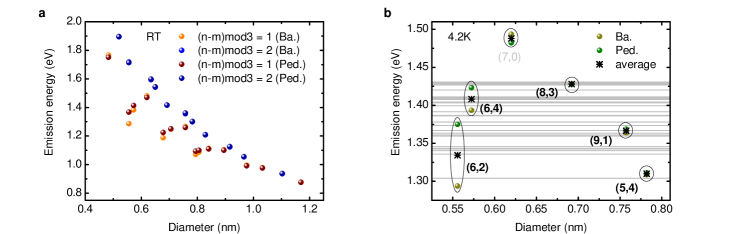
Emission energies of all suspended CNTs studied in this work at K are represented in Fig. 3b by gray horizontal lines. In order to correlate the nanotube emission with chirality, we calculated in a first step room temperature emission energies according to Bachilo et al. Bachilo et al. (2002) and Pedersen Pedersen (2004). The resulting emission energies for the -transitions are depicted in Fig. 3a. In a second step the emission energies were corrected for temperature related spectral shifts according to Capaz et al. Capaz et al. (2005). The results for the relevant spectral range eV are summarized in Fig. 3b. From comparison of calculated emission energies with experimental data we limit the relevant chiralities to , and . Further corrections to the emission energy due to strain or details of the confinement potential were not considered.
II Theoretical modelling
II.1 Exciton lifetimes
Following Perebeinos et al. Perebeinos et al. (2005) we calculate the intrinsic radiative lifetime of CNT excitons as the inverse of the radiative decay rate
| (1) |
with the dielectric permittivity , the free electron mass , the speed of light , and the refractive index , with for a CNT in vacuum Capaz et al. (2006). For a CNT with chirality and diameter ( is the the C–C bond length) Saito et al. (1998) the exciton emission energy is approximated by and the oscillator strength per carbon atom by Perebeinos et al. (2004). Here is the coherence length given by the confinement length, and is the area per carbon atom. The exciton Bohr radius is calculated according to Ref. Capaz et al. (2006). The values for the intrinsic exciton lifetimes obtained from Eq. 1 are in good agreement with ab initio calculations by Spataru et al. Spataru et al. (2005), see Table 1.
| Ref. Spataru et al. (2005): | Ref. Perebeinos et al. (2005): | |
|---|---|---|
| (0) (ps) | (0) (ps) | |
| (7,0) | 12.8 | 8.6 |
| (8,0) | 8.1 | 9.8 |
| (10,0) | 19.1 | 12.2 |
| (11,0) | 14.3 | 13.5 |
The energy level spacing of a one-dimensional harmonic confinement potential with confinement length is obtained from
| (2) |
using the exciton mass , and , calculated according to Ref. Jorio et al. (2005).
II.2 Saturation of a three-level model system
With the definitions given in the main text we obtain the saturation behavior of a three-level system (set up by the crystal ground state , and the exciton ground and excited states, and , respectively) by solving the coupled rate equations
| (3) | |||
| (4) | |||
| (5) |
for steady-state, . Here denotes the population of state with , and , , are the absorption, relaxation and radiative recombination rates, respectively. For the population of the exciton ground state we find:
| (6) |
which reduces in the limit to
| (7) |
The PL intensity is given by with the experimental detection quantum efficiency . Normalizing the PL intensity by the constant value in saturation we obtain using Eq. 7:
| (8) |
The saturation is uniquely determined by the ratio of the radiative rate to the absorption rate. In the following we relate to parameters which we access directly in our experiments.
In the linear response, i. e. as long as the excited state transition is not saturated by the laser, the absorption rate is proportional to the incident laser power . The proportionality factor is given by the ratio of the absorption cross-section of the transition to the focal spot area (with for a focussed Gaussian beam; in our experiment ). Expressing the laser power in terms of the incident photon flux (i. e. the number of photons per second) we obtain for the absorption rate:
| (9) |
We estimate the absorption cross-section of the excited state using the radiatively limited scattering cross-section of the fundamental exciton transition with transition wavelength ( is the refractive index). According to the optical theorem the scattering cross-section of a radiatively limited transition is given by Jackson (1999, 3rd ed.):
| (10) |
Assuming that the oscillator strengths per atom are equal for the ground and excited states, we have to take into account that the excited state is spatially more extended. For a one-dimensional harmonic potential the confinement length grows with the quantum number as . On the other hand, the excited state is broadened by nonradiative relaxation with rate . Thus we have for the th excited state:
| (11) |
| (12) |
All parameters quantifying in Eq. 12 are known from the experiment. Specifically, for the QD exciton in Fig.s 3 and 4 of the manuscript, the relevant parameters are as follows: the excitation resonance wavelength for the third excited state with was nm, the emission of the fundamental exciton state was detected in PL at nm, the radiative decay rate was obtained from time-resolved PL as the inverse PL lifetime with ns, and the relaxation rate was deduced from the linewidth of the PLE resonance as . With this complete set of parameters we calculated the saturation behavior as a function of laser power focussed to a spot area of . The result of the calculation is shown by the solid line in Fig. 4 of the manuscript.
References
- Bachilo et al. (2002) S. M. Bachilo, M. S. Strano, C. Kittrell, R. H. Hauge, R. E. Smalley, and R. B. Weisman, Science 298, 2361 (2002).
- Pedersen (2004) T. G. Pedersen, Carbon 42, 1007 (2004).
- Capaz et al. (2005) R. B. Capaz, C. D. Spataru, P. Tangney, M. L. Cohen, and S. G. Louie, Phys. Rev. Lett. 94, 036801 (2005).
- Perebeinos et al. (2005) V. Perebeinos, J. Tersoff, and P. Avouris, Nano Lett. 5, 2495 (2005).
- Capaz et al. (2006) R. B. Capaz, C. D. Spataru, S. Ismail-Beigi, and S. G. Louie, Phys. Rev. B 74, 121401 (2006).
- Saito et al. (1998) R. Saito, D. Dresselhaus, and M. S. Dresselhaus, Physical Properties Of Carbon Nanotubes (Imperial College Press, 1998).
- Perebeinos et al. (2004) V. Perebeinos, J. Tersoff, and P. Avouris, Phys. Rev. Lett. 92, 257402 (2004).
- Spataru et al. (2005) C. D. Spataru, S. Ismail-Beigi, R. B. Capaz, and S. G. Louie, Phys. Rev. Lett. 95, 247402 (2005).
- Jorio et al. (2005) A. Jorio, C. Fantini, M. A. Pimenta, R. B. Capaz, G. G. Samsonidze, G. Dresselhaus, M. S. Dresselhaus, J. Jiang, N. Kobayashi, A. Grüneis, et al., Phys. Rev. B 71, 075401 (2005).
- Jackson (1999, 3rd ed.) J. D. Jackson, Classical Electrodynamics (John Wiley & Sons, New York, 1999, 3rd ed.).