Slow Magneto-acoustic Waves Observed above Quiet-Sun Region in a Dark Cavity
Abstract
Waves play a crucial role in diagnosing the plasma properties of various structures in the solar corona and coronal heating. Slow magneto-acoustic (MA) waves are one of the important magnetohydrodynamic waves. In past decades, numerous slow MA waves were detected above the active regions and coronal holes, but rarely found elsewhere. Here, we investigate a ‘tornado’-like structure consisting of quasi-periodic streaks within a dark cavity at about 40–110 Mm above the quiet-Sun region on 2011 September 25. Our analysis reveals that these streaks are actually slow MA wave trains. The properties of these wave trains, including the phase speed, compression ratio, kinetic energy density, etc., are similar to those of the reported slow MA waves, except that the period of these waves is about 50 s, much shorter than the typical reported values (3–5 minutes).
1 Introduction
Magnetohydrodynamic (MHD) waves are important phenomena in solar corona and catch broad interests. They are believed to be the energy carriers for coronal heating [e.g., Erdélyi and Fedun, 2007; Jess et al., 2009; McIntosh et al., 2011],and also be a powerful tool to diagnose plasma properties and physical processes in the solar atmosphere [e.g., Roberts, 2000; Banerjee et al., 2007; Marsh et al., 2009]. Slow magneto-acoustic (MA) waves are one of the eigenmodes of MHD waves, and were frequently observed above the active regions, e.g., in coronal loops, and above coronal holes, e.g., in plumes [e.g., Ofman et al., 1997, 1999; DeForest and Gurman, 1998; Berghmans and Clette, 1999; Berghmans et al., 2001; Schrijver et al., 1999; Nightingale et al., 1999; De Moortel et al., 2002b; Banerjee et al., 2007; Mariska and Muglach, 2010]. The propagation speed of these waves is usually around 100 km s-1 with a period of about 3 min above active regions or of about min above coronal holes. Due to the different magnetic field configurations, they could be found over a wide range of altitudes from 7 Mm to about several hundred Megameters above coronal holes [e.g., DeForest and Gurman, 1998; Ofman et al., 1997], but usually below 20 Mm in coronal loops above active regions [e.g., Berghmans and Clette, 1999; De Moortel et al., 2002b, a].
In past decades, slow MA waves above quiet Sun regions were rarely reported. It was probably due to the limitation of instruments. Before the era of the Solar Dynamic Observatory (SDO) mission [Pesnell et al., 2012], imaging instruments have provided either full-disk observations at relatively low spatial resolution and low cadence (e.g., SOHO/EIT, referring to Delaboudinière et al. 1995, STEREO/EUVI, Wuelser et al. 2004), or high resolution and high cadence but limited field of view (FOV) (e.g., TRACE, Handy et al. 1999, Hinode/EIS, Culhane et al. 1997). The instrument AIA [Lemen et al., 2012] on board SDO provides so far the best combination of resolution, cadence, FOV and EUV wavelength coverage. In particular, its full-disk and round-the-clock coverage allows one to launch a comprehensive search for a phenomenon of interest. The only shortcoming of AIA data is the lack of Doppler information. Although this shortcoming brings difficulty in the identification of waves, it could be compensated by the analysis of multi-wavelength observations. In this paper, we report an observation of multiple slow MA wave trains in a dark cavity above a quiet-Sun region, which may advance our understanding on the MA waves in the solar atmosphere.
2 Overview
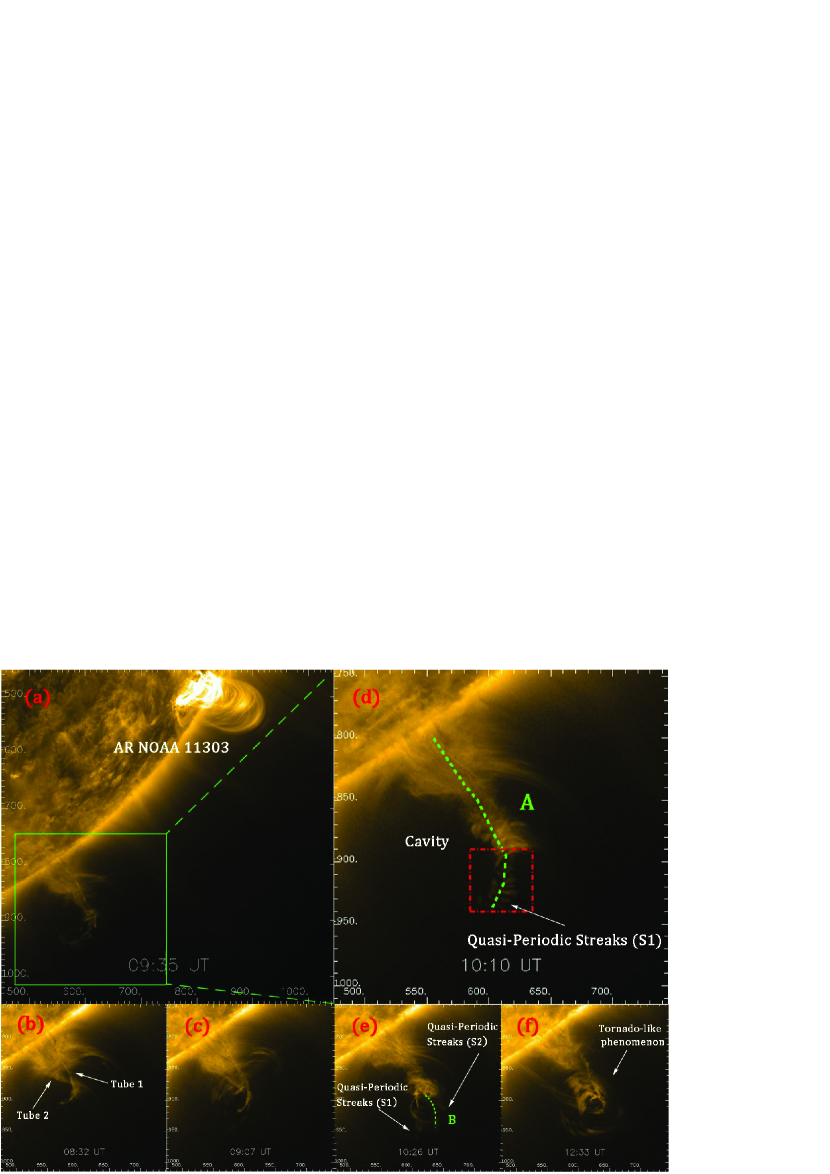
The event of interest took place on 2011 September 25 above the southwest limb within a dark cavity above the quiet Sun region (as shown in Fig. 1(a)). The overall cavity structure stayed stable all the time, but the prominence-like material under the cavity was perturbed at the beginning of September 25 and finally settled down on the next day. The process from 08:00 to 13:00 UT on September 25 can be seen in the online movie M1. Among various phenomena in this process, Li et al. [2012] reported a so-called ‘huge solar tornado’.
In this study, we focus on the nature of the repeated quasi-periodic (QP) streaks starting from about 9:00 UT. The most clear group of QP streaks (labeled as S1 in Fig.1(d)) appeared around 10:10 UT in the 171 Å channel, whose peak formation temperature is about 0.63 MK. Several 171 Å images taken before, during and after this interval are displayed in Figure 1. Before the appearance of the QP streaks, there were apparently two plasma tubes (labeled as 1 and 2) standing right above the limb in the dark cavity (Fig. 1(b)). Initially, the two tubes were slightly tangled as if they were crossed each other in projection. Thereafter, those two tubes were disturbed by an M1.5 flare in the nearby active region NOAA 11303 (Fig. 1(a)) and ended up ‘apparently’ merging together after 9:20 UT.
Meanwhile, continuous upward flows along Tube 1 can be noticed to originate from the tube bottom starting from around 08:20 UT. The upward flows seemingly transformed into helical-like flows with increasing height, and near the top of Tube 1 the helical-like flows quickly expanded and developed into QP streaks, which intermittently appeared with various intensity and broadness in the next 4 hours. Figure 1(e) shows another group of streaks (labeled as S2). These streaks propagated along the tube once they appeared.
3 Helical magnetic structure, intermittent mass flows or wave trains?
The nature of the QP streaks is of particular interest. Intuitively, one may think that these QP streaks reflected the helical motion of plasmas in a magnetic flux rope. If this conjecture is true, the degree of the twist of the magnetic field in the flux rope could be inferred from the number of streaks. In the 171 Å image at 10:10 UT, for example, at least 10 streaks were displayed at the upper portion of the tube, and it implies that the magnetic field lines twisted more than 10 rounds or in radian. Previous works have suggested that a flux rope with force-free field tends to be kink unstable when the twist exceeds about , and the growth rate is on the order of minutes [Hood and Priest, 1979; Török and Kliem, 2003; Török et al., 2004]. Some recent studies further suggested that, for a flux rope with a larger aspect ratio or axial mass flow, the threshold may increase up to [Baty, 2001; Srivastava et al., 2010; Zaqarashvili et al., 2010]. The QP streaks S1 studied here exceeded the threshold, but did not show any rapid increase in size, brightness, or dramatic change in shape, which means that there is no evident signature of the development of the kink instability. Moreover, our data process cannot find any signatures of the plasma motion along these streaks. Thus, these QP streaks could not be the result of the plasma motion along twisted helical magnetic field lines.
A wave train seems to be a more plausible interpretation for the QP streaks. A 5-pixel wide slice, labeled ‘A’ in Figure 1(d), is placed along the axis of Tube 1 to analyze the plasma motion. Figure 2(a) shows the space-time plot generated by “seeing” through Slice A in AIA 171 Å images. Its left vertical axis gives the distance from the start point along the slice, and the corresponding height from solar surface is marked in the right vertical axis. It could be seen that the lower part of the tube oscillated with a period of about 25 minutes, which was presumably excited by the explosive activity in AR NOAA 11303 at around 09:30 UT (Fig. 1(a)). The upward flows mentioned before could be identified as stripes with a positive slope in the plot (Fig. 2(a)). Linear fitting to the stripes suggests that the upward flows moved along the tube at a speed of about 32 km s-1.
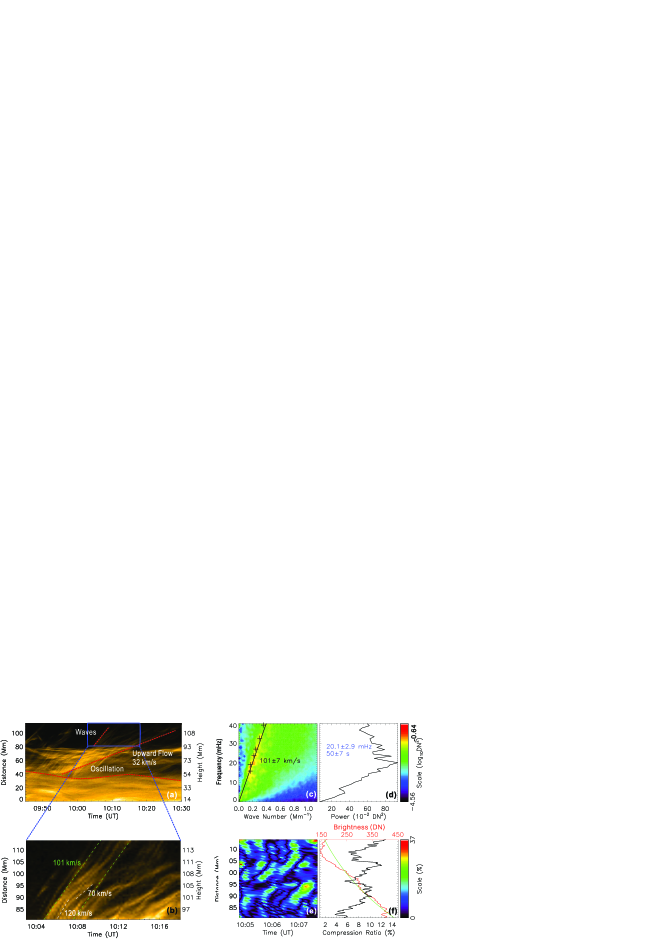
The QP streaks S1 were located above the distance of 80 Mm after 10:04 UT in Figure 2(a). Figure 2(b) shows a zoom-in plot of the blue box region in Figure 2(a) from 10:03 to 10:18 UT. The temporal evolution of these streaks is shown as alternating bright and dark stripes in the space-time plot. Obviously, these stripes are steeper than those produced by the upward flows. According to the space-time plot, the propagation speed of these streaks varied from about 70 km s-1 to 120 km s-1 with an average speed of about 100 km s-1. It could also be estimated that the spatial separation of the streaks is about 5 Mm. Therefore, the period is about 50 s if the streaks were caused by a wave train.
Following the method by DeForest [2004] and Liu et al. [2011], Fourier analysis is applied to S1. We generate a three dimensional data cube using a series of running difference 171 Å images in the FOV enclosed by the red box in Figure 1(d) from 10:03 to 10:18 UT. The Fourier transformation converts the data cube from the space-time domain to the wavenumber-frequency domain ) (as shown in Fig. 2(c)). A slanted stripe with large powers (painted in yellow to red colors) can be clearly seen in Figure 2(c). The phase speed of the wave can be estimated from the slope of the stripe. For that purpose, we equally cut the - plot into six pieces along the frequency axis above 10 mHz, and identify the point with the maximum power in each piece (as marked by the plus signs in Fig. 2(c)). The phase speed is just the average of the slopes of these points, which is about km s-1 with an uncertainty of about km s-1. The integrated power over wave number is presented by the black line in Figure 2(d), which peaks at about mHz, corresponding to a period of about s. Both results are consistent with the direct estimation from the space-time plot in Figure 2(b).
Performing the same analysis to the QP streaks S2 shown in Figure 1(e), we obtain a similar result which gives a phase speed of about 110 km s -1 and a period of about 45 s. These waves were probably excited by the oscillation of the tubes or by the upward flows from the tube bottom.
Recently, some argued that such QP streaks can also be explained by heated QP mass flows [e.g., De Pontieu and McIntosh, 2010; McIntosh et al., 2010; De Pontieu et al., 2011; Tian et al., 2011]. Those QP mass flows may propagate into corona at a speed of order 100 km s-1. To distinguish a wave train from QP mass flows, we compare the multi-wavelength observations from AIA, just like those done by Kiddie et al. [2012]. If the observed QP streaks were produced by mass flows, their propagation speed would not depend on the temperature, i.e., there is no dispersion signature; otherwise, the observed QP streaks were caused by a MA wave train.
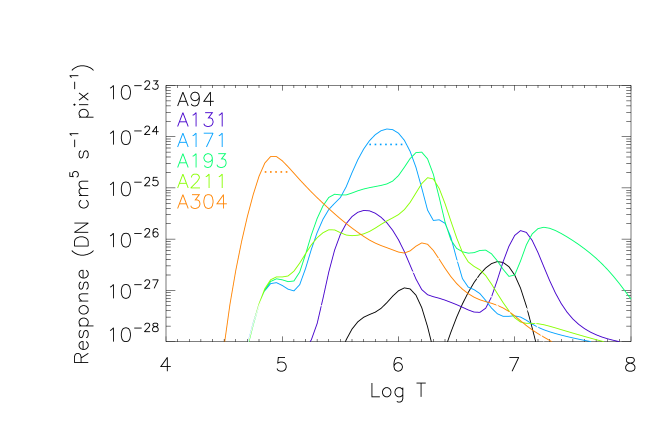
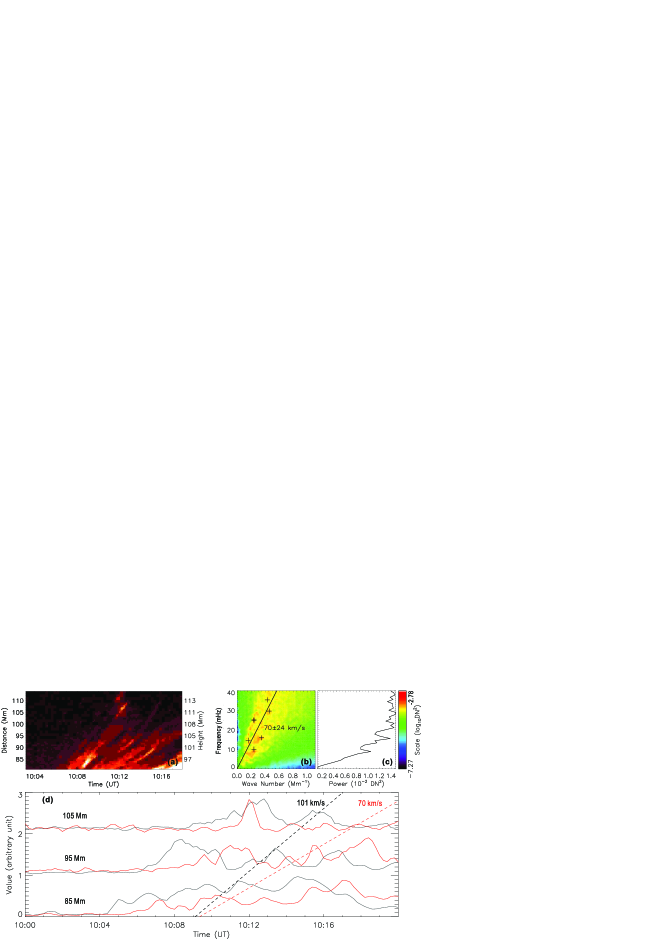
The temperature response curves of AIA passbands shown in Figure 3, which is generated by the SSW procedure ‘aia_get_response.pro’ provided by AIA team [Lemen et al., 2012], suggest that, except 171 Å and 304 Å passbands, all the other passbands obviously correspond to multiple temperatures. Thus, 304 Å data is used to compare with 171 Å data. It is obvious that there is a similar wave signature in 304 Å data (Fig. 4(a)–(b)), and even more importantly, the phase speed is about km s-1, which is much smaller than the phase speed derived from 171 Å data. However, there is no clear peak frequency in the integrated power spectrum (Fig.4(c)); the power roughly stays at the same high level from 20 to 40 mHz. This is probably due to the relatively low signal-to-noise in 304 A data. Further, a comparison of the wave phase between the 171 Å and 304 Å data is given in Figure 4(d), in which the time sequences at lower, middle and higher positions are presented. The phase difference between the two passbands varies with the position changing, which means that the group of QP streaks S1 is likely a wave train rather than mass flows. The dispersion of the MA wave suggests that the plasma tube is likely a multi-thread structure, different threads have different temperatures, and the propagation with different phase speeds in different passbands is equivalent to the propagation of waves in different threads.
4 Evidence of slow magneto-acoustic waves
The QP streaks as viewed in EUV 171 Å reflect the fluctuation of the emission intensity (i.e., brightness), and therefore the fluctuation of the plasma density. It suggests that these waves are compressional. In order to obtain the amplitude or compression ratio of the wave train S1, the parallelogram defined by the two green dashed lines in Figure 2(b), where the QP streaks are most clear, is further investigated. The background (or unperturbed) brightness in this region is a function of distance, which is obtained by simply averaging the pixel values at each distance, as this region covers several wavelengths of the wave. The red line in Figure 2(f) shows the background brightness, . The amplitude of the fluctuation of the emission intensity, , is therefore obtained by subtracting the background brightness from the observed one. In optically thin corona, it is usually true that and therefore the compression ratio, which is defined as , could be approximately given by [Aschwanden, 2004; Liu et al., 2011].
Figure 2(e) presents the compression ratio in the region of interest. Note that the parallelogram is rectified so that, along the vertical axis, distance and time variations are coupled together. Since the green dashed line is selected to match the wave speed of 101 km s -1, the vertical variation in Figure 2(e) can be roughly interpreted as the variation of the wave amplitude for certain phases. The black line in Figure 2(f) gives the average compression ratio over time, which is about 8.4% on average with a standard deviation of about 2.0%. No significant damping in amplitude is found over the propagation distance of about 33 Mm. Since the amplitude of the density fluctuation is relatively small compared to the background density, it could be treated as a linear wave train. In linear theory, of all propagating MHD waves, only MA waves can cause density compression.
The region we studied is in a dark cavity, presumably void of plasmas [Low, 1996; Fuller and Gibson, 2009]. It is hence expected that the magnetic field inside the dark cavity is relatively stronger than that outside, so that a pressure balance is maintained. Thus the Alfvén speed in the dark cavity should be approximately equal to or even larger than the typical Alfvén speed in quiet-Sun region, which is about 220 km s -1 [McIntosh et al., 2011]. The MA waves we investigated here propagated at much slower speeds than the Alfvén speed, and therefore these waves are slow MA waves.
Since these slow MA waves propagated along the tubes, which implies that the wave vector is approximately parallel to the magnetic field lines, the phase speed of the waves should be close to the sound speed. The local sound speed is given by , where is the capacity ratio, is the Boltzmann constant, is the proton mass and is the temperature. The 171 Å passband corresponds to the temperature of about MK, as indicated by the horizontal dashed line in Figure 3. The sound speed at this temperature range is about km s-1. The 304 Å passband corresponds to the temperature of about MK, and the sound speed is about km s-1. These results are close to the phase speeds directly derived from the imaging data, but not a perfect match, especially for the 171 Å data. There could be various explanations for the deviation. In a uniform magnetic field, if the wave vector of S1 was not exactly parallel to the magnetic field, the phase speed should be smaller than the local sound speed. Projection effect also can result in the underestimation of the derived phase speed from the imaging data. Besides, previous theoretical analysis showed that, in a magnetic tube, slow MA waves propagate at a so called tube speed, which is smaller than the local sound speed [e.g., Edwin and Roberts, 1983].
5 Energy flux carried by the waves
The kinetic energy density of a MA wave can be estimated by the formula , where is the plasma density and is the phase speed of the wave. The energy flux is given by . The analysis of the 171 Å data in the previous sections has revealed that for wave S1, is km s -1 and is . By further assuming the number density to be the typical value of cm-3 in dark cavities [Fuller and Gibson, 2009], we infer that the energy density carried by wave S1 is erg cm-3, or the energy flux is erg cm-2 s-1.
Since the emission intensity and therefore the density obviously decreases with increasing distance (Figure 2(f)), the wave energy actually dissipated when it propagated along the tube. We applies an exponential equation to fit the observed brightness given by the red line in Figure 2(f). The free parameters , and are found to be 434, and 80, respectively. The green fitting curve suggests that the background brightness weakened by a factor of 63% over a distance of about 33 Mm or in about 5 min. Thus, it is inferred that the average dissipation rate of the wave energy is erg cm-3 s-1.
6 Summary
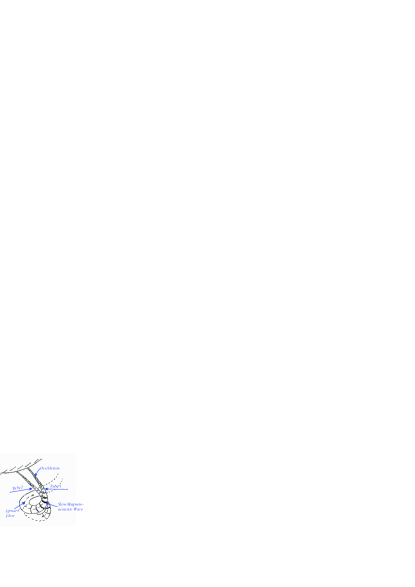
In this paper, we identified the QP streaks, appearing above the quiet-Sun region on 2011 September 25, with the slow MA waves. The overall picture of this ‘tornado’-like event is summarized in Figure 5. There were two flux tubes in a dark cavity. Oscillations and upward flows were initiated in the tubes around 08:00 UT by some perturbations. About one hour later, slow MA waves were excited by the oscillations and/or the upward flows, and manifested as QP streaks in the upper portion of the tubes. The tornado-like phenomenon shown in Figure 1(f) was the results of the bulk flows along the curved tubes.
The wave train S1 propagated along Tube1 around 10:10 UT is particularly analyzed. Its propagation speed is about 101 km s-1 in the 171 Å bassband or 70 km s-1 in the 304 Å passband, which is comparable with those of the slow MA waves found above active regions, 122 km s -1 [De Moortel et al., 2002b, a] or coronal holes, km s -1 [DeForest and Gurman, 1998], while its period is about 50 s, which is much shorter than those found above active regions, min, or coronal holes, usually min. According to the fluctuation in brightness, the density amplitude of the wave is about 8.4%, also comparable with that of the slow MA waves found elsewhere ( above active regions and above coronal holes, respectively). The dissipation rate of the wave energy is estimated from to erg cm-3 s-1, which is about one-order of magnitude smaller than that of the radiative loss of the local corona [Withbroe and Noyes, 1977; Aschwanden, 2006].
Our study implies that (1) slow MA waves not only appear above active regions or coronal holes, but also exist above quiet-Sun regions, and the fact that they were rarely found above quiet-Sun region before SDO mission is probably simply due to the instrument limitation; and (2) the slow MA wave train in this study is not sufficient for local coronal heating. It should be noted that the slow MA waves were repeatedly observed during the event, and sometimes, two or more wave trains appeared simultaneously. Whether such slow MA waves ubiquitously exist in the corona and whether they do a significant contribution to coronal heating is worth to be investigated further.
Acknowledgements.
We acknowledge the use of data from AIA instrument on Solar Dynamics Observatory (SDO). This work is supported by grants from the CAS (the Key Research Program KZZD-EW-01-4, 100-talent program, KZCX2-YW-QN511 and startup fund), 973 key project (2011CB811403), NSFC (41131065, 40904046, 40874075, and 41121003), MOEC (20113402110001) and the fundamental research funds for the central universities.References
- Aschwanden [2004] Aschwanden, M. J., The Role of Observed MHD Oscillations and Waves for Coronal Heating, ESASP, 575, 97–107, 2004.
- Aschwanden [2006] Aschwanden, M. J., Physics of the Solar Corona - An Introduction with Problems and Solutions, Springer, 2006.
- Banerjee et al. [2007] Banerjee, D., R. Erdélyi, R. Oliver, and E. O′Shea, Present and Future Observing Trends in Atmospheric Magnetoseismology, Sol. Phys., 246(1), 3–29, 10.1007/s11207-007-9029-z, 2007.
- Baty [2001] Baty, H., On the MHD stability of the kink mode in solar coronal loops, Astron. & Astrophys., 367, 321–325, 2001.
- Berghmans and Clette [1999] Berghmans, D., and F. Clette, Active Region EUV Transient Brightenings – First Results by EIT of SOHO JOP 80, Sol. Phys., 186, 207–229, 1999.
- Berghmans et al. [2001] Berghmans, D., D. Mckenzie, and F. Clette, Active Region Transient Brightenings - A Simultaneous View by SXT , EIT and TRACE, A&A, 369, 291–304, 10.1051/0004-6361, 2001.
- Culhane et al. [1997] Culhane, J. L., L. K. Harra, A. M. James, K. Al-Janabi, L. J. Bradley, R. A. Chaudry, K. Rees, J. A. Tandy, P. Thomas, M. C. R. Whillock, B. Winter, G. A. Doschek, C. M. Korendyke, C. M. Brown, S. Myers, J. Mariska, J. Seely, J. Lang, B. J. Kent, B. M. Shaughnessy, P. R. Young, G. M. Simnett, C. M. Castelli, S. Mahmoud, H. Mapson-Menard, B. J. Probyn, R. J. Thomas, J. Davila, K. Dere, D. Windt, J. Shea, R. Hagood, R. Moye, H. Hara, T. Watanabe, K. Matsuzaki, T. Kosugi, V. Hansteen, and . Wikstol, The EUV Imaging Spectrometer for Hinode, Sol. Phys., 243, 19–61, 1997.
- De Moortel et al. [2002a] De Moortel, I., A. W. Hood, J. Ireland, and R. W. Walsh, Longitudinal Intensity Oscillations in Coronal Loops Observed with TRACE - II. Discussion of Measured Parameters, Sol. Phys., 209, 89–108, 2002a.
- De Moortel et al. [2002b] De Moortel, I., J. Ireland, R. W. Walsh, and A. W. Hood, Longitudinal Intensity Oscillations in Coronal Loops Observed with TRACE - I. Overview of Measured Parameters, Sol. Phys., 209, 61–88, 2002b.
- De Pontieu and McIntosh [2010] De Pontieu, B., and S. W. McIntosh, Quasi-periodic propagating signals in the solar corona: The signature of magnetoacoustic waves or high-velocity upflows?, Astrophys. J., 722, 1013–1029, 2010.
- De Pontieu et al. [2011] De Pontieu, B., S. W. McIntosh, M. Carlsson, V. H. Hansteen, T. D. Tarbell, P. Boerner, J. Martinez-Sykora, C. J. Schrijver, and A. M. Title, The origins of hot plasma in the solar corona, Science, 331, 55, 2011.
- DeForest [2004] DeForest, C. E., High-Frequency Waves Detected in the Solar Atmosphere, Astrophys. J., 617, L89–L92, 2004.
- DeForest and Gurman [1998] DeForest, C. E., and J. B. Gurman, Observation of Quasi-Periodic Compressive Waves in Solar Polar Plumes, Astrophys. J., 501, L217–L220, 1998.
- Delaboudinière et al. [1995] Delaboudinière, J.-P., G. E. Artzner, J. Brunaud, and E. al., EIT: Extreme-Ultraviolet Imaging Telescope for the SOHO Mission, Sol. Phys., 162, 291–312, 1995.
- Edwin and Roberts [1983] Edwin, P. M., and B. Roberts, Wave propagation in a magnetic cylinder, Sol. Phys., 88, 179–191, 1983.
- Erdélyi and Fedun [2007] Erdélyi, R., and V. Fedun, Are There Alfvén Waves in the Solar Atmosphere?, Science, 318, 1572–1574, 10.1126/science.1153006, 2007.
- Fuller and Gibson [2009] Fuller, J., and S. E. Gibson, a Survey of Coronal Cavity Density Profiles, Astrophys. J., 700(2), 1205–1215, 10.1088/0004-637X/700/2/1205, 2009.
- Handy et al. [1999] Handy, B. N., L. W. Acton, C. C. Kankelborg, C. J. Wolfson, D. J. Akin, M. E. Bruner, R. Caravalho, R. C. Catura, R. Chevalier, D. W. Duncan, C. G. Edwards, C. N. Feinstein, S. L. Freeland, F. M. Friedlaender, C. H. Hoffmann, N. E. Hurlburt, B. K. Jurcevich, N. L. Katz, G. A. Kelly, J. R. Lemen, M. Levay, R. W. Lindgren, D. P. Mathur, S. B. Meyer, S. J. Morrison, M. D. Morrison, R. W. Nightingale, T. P. Pope, R. A. Rehse, C. J. Schrijver, R. A. Shine, L. Shing, K. T. Strong, T. D. Tarbell, A. M. Title, D. D. Torgerson, L. Golub, J. A. Bookbinder, D. Caldwell, P. N. Cheimets, W. N. Davis, E. E. Deluca, R. A. McMullen, H. P. Warren, D. Amato, R. Fisher, H. Maldonado, and C. Parkinson, The Transition Region and Coronal Explorer, Sol. Phys., 187, 229–260, 1999.
- Hood and Priest [1979] Hood, A. W., and E. R. Priest, The Equilibrium of Solar Coronal Magnetic Loops, A&A, 77, 233–251, 1979.
- Jess et al. [2009] Jess, D. B., M. Mathioudakis, R. Erdélyi, P. J. Crockett, F. P. Keenan, and D. J. Christian, Alfvén waves in the lower solar atmosphere, Science, 323, 1582–1585, 2009.
- Kiddie et al. [2012] Kiddie, G., I. De Moortel, G. Del Zanna, S. McIntosh, and I. Whittaker, Propagating disturbances in coronal loops: A detailed analysis of propagation speeds, Sol. Phys., 279, 427–452, 2012.
- Lemen et al. [2012] Lemen, J. R., A. M. Title, D. J. Akin, P. F. Boerner, C. Chou, J. F. Drake, D. W. Duncan, C. G. Edwards, F. M. Friedlaender, G. F. Heyman, N. E. Hurlburt, N. L. Katz, G. D. Kushner, M. Levay, R. W. Lindgren, D. P. Mathur, E. L. Mcfeaters, S. Mitchell, R. A. Rehse, C. J. Schrijver, L. A. Springer, R. A. Stern, T. D. Tarbell, C. J. Wolfson, C. Yanari, J. A. Bookbinder, P. N. Cheimets, D. Caldwell, E. E. Deluca, R. Gates, L. Golub, S. Park, W. A. Podgorski, R. I. Bush, P. H. Scherrer, M. A. Gummin, P. Smith, G. Auker, P. Jerram, P. Pool, R. Soufli, D. L. Windt, S. Beardsley, M. Clapp, J. Lang, and N. Waltham, The Atmospheric Imaging Assembly ( AIA ) on the Solar Dynamics Observatory ( SDO ), Sol. Phys., 275, 17–40, 10.1007/s11207-011-9776-8, 2012.
- Li et al. [2012] Li, X., H. Morgan, D. Leonard, and L. Jeska, A Solar Tornado Observed by AIA/SDO: Rotational Flow and Evolution of Magnetic Helicity in a Prominence and Cavity, Astrophys. J., 752, L22, 2012.
- Liu et al. [2011] Liu, W., A. M. Title, J. W. Zhao, L. Ofman, J. Schruver, M. J. Aschwanden, B. De Pontieu, and T. D. Tarbell, Direct Imaging of quasi-periodic Fast Propagating Waves of ~2000 Km/s in the low Solar Corona by the Solar Dynamics Observatory Atmospheric Imaging Assembly, Astrophys. J., 763, L13–L18, 2011.
- Low [1996] Low, B. C., Solar Activity and the Corona, Sol. Phys., 167, 217–265, 1996.
- Mariska and Muglach [2010] Mariska, J. T., and K. Muglach, Doppler-Shift, Intensity, and Density Oscillations Observed With the Extreme Ultraviolet Imaging Spectrometer on Hinode, Astrophys. J., 713, 573–583, 10.1088/0004-637X/713/1/573, 2010.
- Marsh et al. [2009] Marsh, M. S., R. W. Walsh, and S. Plunkett, Three-Dimensional Coronal Slow Modes: Toward Three-Dimensional Seismology, Astrophys. J., 679, 1674–1680, 10.1088/0004-637X/697/2/1674, 2009.
- McIntosh et al. [2010] McIntosh, S. W., D. E. Innes, B. De Pontieu, and R. J. Leamon, Stereo observations of quasi-periodically driven high velocity outflows in polar plumes, Astron. & Astrophys., 510, L2, 2010.
- McIntosh et al. [2011] McIntosh, S. W., B. D. Pontieu, M. Carlsson, V. Hansteen, P. Boerner, and M. Goossens, Alfvénic Waves with Sufficient Energy to Power the Quiet Solar Corona and Fast Solar Wind, Nature, 475(7357), 477–480, 10.1038/nature10235, 2011.
- Nightingale et al. [1999] Nightingale, R., M. Aschwanden, and N. E. Hurlburt, Time Variability of EUV Brightenings in Coronal Loops Observed with TRACE, Sol. Phys., 190, 249–265, 1999.
- Ofman et al. [1997] Ofman, L., M. Romoli, G. Poletto, G. Noci, and J. L. Kohl, Ultraviolet Coronagraph Spectrometer Observations of Density Fluctuations in the Solar Wind, Astrophys. J., 491, L111–L114, 1997.
- Ofman et al. [1999] Ofman, L., V. Nakariakov, and C. E. DeForest, Slow Magnetosonic Waves in Coronal Plumes, Astrophys. J., 514, 441–447, 1999.
- Pesnell et al. [2012] Pesnell, W. D., B. J. Thompson, and P. C. Chamberlin, The Solar Dynamics Observatory (SDO), Sol. Phys., 275, 3–15, 2012.
- Roberts [2000] Roberts, B., Waves and Oscillations in the Corona, Sol. Phys., 193, 139–152, 2000.
- Schrijver et al. [1999] Schrijver, C. J., A. M. Title, T. E. Berger, L. Fletcher, N. E. Hurlburt, R. W. Nightingale, R. A. Shine, T. D. Tarbell, J. Wolfson, L. Golub, J. A. Bookbinder, E. E. Deluca, R. A. Mcmullen, H. P. Warren, C. C. Kankelborg, B. N. Handy, and B. De Pontieu, A New View of the Solar Outer Atmosphere by the Trasition Region And Coronal Explorer, Sol. Phys., 187, 261–302, 1999.
- Srivastava et al. [2010] Srivastava, A. K., T. V. Zaqarashvili, Pankaj Kumar, and M. L. Khodachenko, Observation of kink instability during small B5.0 solar flare on 2007 June 4, Astrophys. J., 715, 292–299, 2010.
- Tian et al. [2011] Tian, H., S. W. McIntosh, and B. De Pontieu, The spectroscopic signature of quasi-periodic upflows in active region timeseries, Astrophys. J., 727, L37, 2011.
- Török and Kliem [2003] Török, T., and B. Kliem, The evolution of twisting coronal magnetic flux tubes, Astron. & Astrophys., 406, 1043–1059, 2003.
- Török et al. [2004] Török, T., B. Kliem, and V. S. Titov, Ideal kink instability of a magnetic loop equilibrium, Astron. & Astrophys., 413, L27–L30, 2004.
- Withbroe and Noyes [1977] Withbroe, G. L., and R. W. Noyes, Mass and Energy Flow in the Solar Chromosphere and Corona, ARA&A, 15, 363–387, 1977.
- Wuelser et al. [2004] Wuelser, J.-P., J. R. Lemen, T. D. Tarbell, C. J. Wolfson, J. C. Cannon, B. A. Carpenter, D. W. Duncan, G. S. Gradwohl, S. B. Meyer, A. S. Moore, R. L. Navarro, J. D. Pearson, G. R. Rossi, L. A. Springer, R. A. Howard, J. D. Moses, J. S. Newmark, J.-P. Delaboudiniere, G. E. Artzner, F. Auchere, M. Bougnet, P. Bouyries, F. Bridou, J.-Y. Clotaire, G. Colas, F. Delmotte, A. Jerome, M. Lamare, R. Mercier, M. Mullot, M.-F. Ravet, X. Song, V. Bothmer, and W. Deutsch, EUVI: the STEREO-SECCHI Extreme Ultraviolet Imager, SPIE, 5171, 111–122, 2004.
- Zaqarashvili et al. [2010] Zaraqashvili, T. V., A. J. Díaz, R. Oliver, and J. L. Ballester, Instability of twisted magnetic tubes with axial mass flows, Astron. & Astrophys., 516, A84, 2010.