PHENIX Collaboration
Inclusive cross section and single transverse spin asymmetry for very forward neutron production in polarized collisions at = 200 GeV
Abstract
The energy dependence of the single-transverse-spin asymmetry, , and the cross section for neutron production at very forward angles were measured in the PHENIX experiment at RHIC for polarized collisions at =200 GeV. The neutrons were observed in forward detectors covering an angular range of up to 2.2 mrad. We report results for neutrons with momentum fraction of =0.45 to 1.0. The energy dependence of the measured cross sections were consistent with scaling, compared to measurements by an ISR experiment which measured neutron production in unpolarized collisions at =30.6–62.7 GeV. The cross sections for large neutron production for collisions, as well as those in collisions measured at HERA, are described by a pion exchange mechanism. The observed forward neutron asymmetries were large, reaching for =0.8; the measured backward asymmetries, for negative , were consistent with zero. The observed asymmetry for forward neutron production is discussed within the pion exchange framework, with interference between the spin-flip amplitude due to the pion exchange and nonflip amplitudes from all Reggeon exchanges. Within the pion exchange description, the measured neutron asymmetry is sensitive to the contribution of other Reggeon exchanges even for small amplitudes.
pacs:
13.85.Ni,13.88.+e,14.20.Dh,25.75.DwI Introduction
With the first polarized + collisions at = 200 GeV at the Relativistic Heavy Ion Collider (RHIC), a large single transverse spin asymmetry () for neutron production in very forward kinematics was discovered by a polarimeter development experiment Fukao:2006vd . That experiment was designed to measure the asymmetry for very forward photons and used an electromagnetic calorimeter. The calorimeter was used to identify neutrons, originally to remove them from the photon data, when a large asymmetry was observed in forward neutrons. The neutron energy resolution was coarse, so no cross section measurement was reported. The discovery inspired the PHENIX experiment to use existing very forward hadronic calorimeters, with additional shower maximum detectors, to measure the neutron transverse asymmetry at the PHENIX interaction point at RHIC with a significantly better neutron energy resolution. Here we report the first measurements of very forward inclusive and semi-inclusive neutron production cross sections at = 200 GeV and measurements of for forward and backward production with improved neutron energy resolution. The is a left–right asymmetry written as:
| (1) |
for yields observed to the left when facing along the polarized proton’s momentum vector, where () is the production cross section when the protons are polarized up (down). The with cross section measurements for higher energy collisions provide qualitatively new information toward an understanding of the production mechanism.
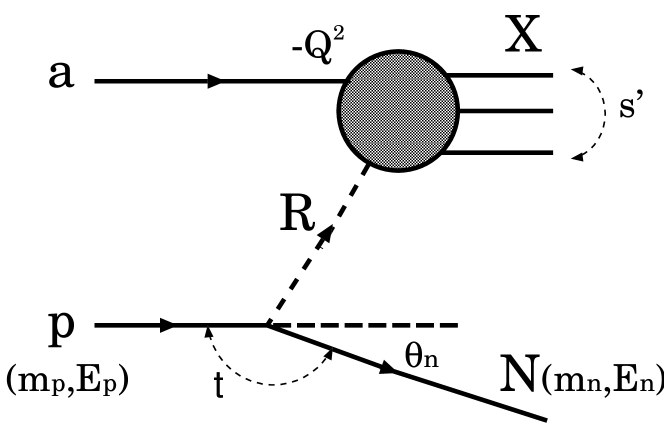
Cross sections of inclusive neutron production in unpolarized collisions were measured at the ISR from = 30.6 to 62.7 GeV Engler:1974nz ; Flauger:1976ju . These cross sections have been described using One Pion Exchange (OPE) models Capella:1975qk ; Kopeliovich:1996iw ; Nikolaev:1997cn ; Nikolaev:1998se ; D'Alesio:1998bf ; Kaidalov:2006cw ; Bunyatyan:2006vy . In OPE, the incoming proton emits a pion which scatters on the other proton as shown in Figure 1. Kinematics of the neutron are characterized by two variables, and defined by,
| (2) | |||||
| (3) |
where is the momentum component of the neutron in the proton-beam direction, and are energies of the neutron and the proton beam, and is the polar angle of the neutron from the beam direction which is very small (mrad) for forward neutron production. The measured cross section showed a peak around and was found to have almost no dependence. OPE models gave a reasonable description of the data.
OPE models were also used to describe proton and photon induced production of neutrons measured at the HERA collider Chekanov:2007tv ; Aaron:2010ze . These measurements probe the pion structure function at small . The NA49 collaboration also published the cross section for forward neutron production for collisions at = 17.3 GeV Anticic:2009wd . They compared the result with those from ISR and HERA and found they did not agree.
The neutron asymmetry provides a new tool to probe the production mechanism. For the OPE model, arises from an interference between spin-flip and spin-nonflip amplitudes. Since the pion-exchange amplitude is fully spin-flip, the asymmetry is sensitive to other Reggeon exchange amplitudes which are spin-nonflip, even for small amplitudes.
This paper presents the dependence of cross sections, inclusive and semi-inclusive (with a beam-beam interaction requirement), and for very forward and very backward neutron production in polarized collisions at = 200 GeV.
II Experimental setup
II.1 Detector apparatus
A plan view of the experimental setup for very forward neutron measurement at PHENIX Adcox:2003zm is shown in Fig. 2. The RHIC polarized proton beams were vertically polarized. Each collider ring of RHIC was filled with up to 111 bunches in a 120 bunch pattern, spaced 106 ns apart, with predetermined patterns of polarization signs for the bunches. The colliding beam rotating clockwise when viewed from above is referred to as the “Blue beam” and the beam rotating counterclockwise, the “Yellow beam”.
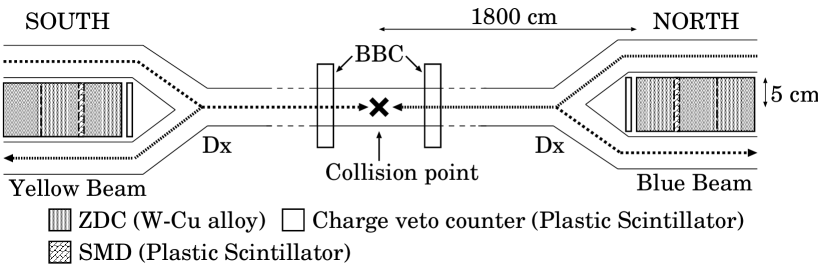
Neutrons were measured by a Zero-Degree Calorimeter (ZDC) Adler:2000bd with a position-sensitive Shower-Maximum Detector (SMD). One ZDC module is composed of Cu-W alloy absorbers with PMMA-based communication grade optical fibers, and corresponds to 1.7 nuclear interaction lengths. A single photomultiplier collects Čerenkov light via optical fibers. Three ZDC modules are located in series (5.1 nuclear interaction lengths) at 1800 cm away from the collision point, covering 10 cm in the transverse plane.
The SMD comprises - scintillator strip hodoscopes and is inserted between the first and second ZDC modules (see Fig. 5 of Adler:2000bd ) at approximately the depth of the maximum of the hadronic shower. The -coordinate (horizontal) is given by 7 scintillator strips of 15 mm width, while the -coordinate (vertical) is given by 8 strips of 20 mm width, tilted by 45 degrees.
The neutron position can be reconstructed from the energy deposited in scintillators with the centroid method. We calculated the centroid:
| (4) |
where and are the energy deposit and the position of the -th scintillator, respectively. The number of scintillators with pulse height above the Minimum Ionization Particle (MIP) peak is shown as which is defined as the SMD multiplicity.
Detectors are located downstream of the RHIC dipole (DX) magnet, so that collision-related charged particles are swept out. A forward scintillation counter, with dimensions 1012 cm, was installed in front of the ZDC to remove charged particle backgrounds from other sources. In this analysis, we used only the south ZDC detector, which is facing the Yellow beam.
As a beam luminosity monitor, Beam Beam Counters (BBCs) are used. The BBC comprises 64 photomultiplier tubes and 3 cm thick quartz Čerenkov radiators. The two BBCs are mounted around the beam pipe 144 cm away from the collision point which cover (3.0–3.9) in pseudorapidity and in azimuth.
The neutron data were collected in 2006 with two triggers. One is the ZDC trigger for neutron inclusive measurements, requiring an energy deposit in the south ZDC greater than 5 GeV. The other trigger was a ZDCBBC trigger, a coincidence trigger of the ZDC trigger with BBC hits which are defined as one or more charged particles in both of the BBC detectors. We note that the ZDC trigger was prescaled due to data acquisition limitations. Therefore, the ZDC trigger samples are significantly smaller than the ZDCBBC trigger samples.
II.2 Detector performance
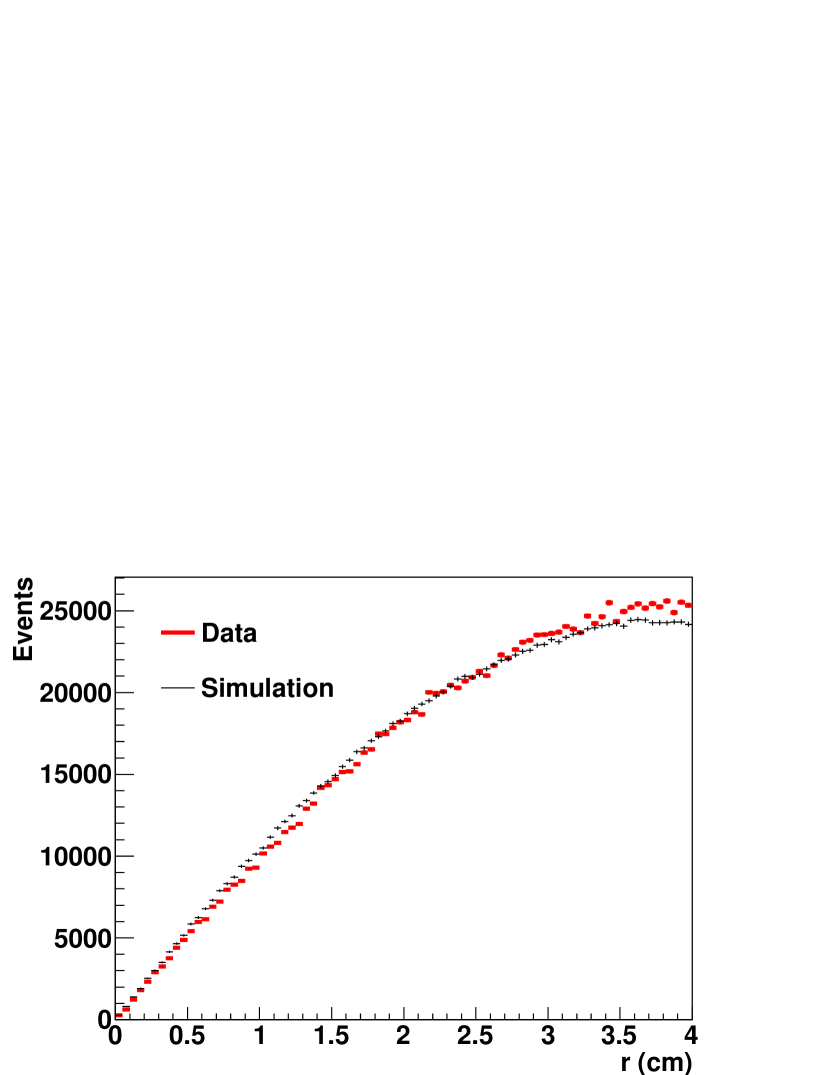
In order to evaluate the detector performance, simulation studies were performed with geant3 with GHEISHA Brun:1994aa which simulated the response of the prototype ZDC to hadrons well. A single neutron event generator and pythia (version 6.220) Sjostrand:2000wi were used to generate events. The single neutron event generator simulated neutrons as a function of and . The distribution which was used for the simulation input was determined as a differential cross section, , in the cross section analysis (section III.1). The distribution is difficult to determine by the PHENIX data alone since the position and energy resolutions are insufficient to adequately determine it, so the distribution from the ISR result, exp(4.8 (GeV/)), was used as simulation input, assuming scaling from the ISR to the PHENIX energies. To check the reliability of this assumption, distributions of radial distance from the detector center, , for the data and simulation were compared based on the relation of as,
| (5) |
where is the distance from the collision point to the detector, corresponding to 1800 cm, and is determined for the shower centroid with Eq. (4).
The comparison of distributions with the integration of measured ZDC energies 20–120 GeV agreed well as shown in Fig. 3.
II.2.1 Performance of the energy measurement
The neutron energy measurement with the ZDC was degraded by a nonlinearity of the photoelectron yield and shower leakage out the back and sides of the detector (edge effect). The ZDC response was studied by simulation with the single neutron event generator.
The energy linearity and resolution were evaluated from the response to incident neutrons with energies from 20 to 100 GeV in the simulation. The absolute scale was normalized at 100 GeV with the experimental data. The ZDC response below 100 GeV exhibits nonlinear behavior as shown in Fig. 4. We applied a correction of the nonlinearity to the experimental data based on this result. We used the difference between the linear and nonlinear response as a component of the systematic uncertainty in the determination of the cross section (section III.1).
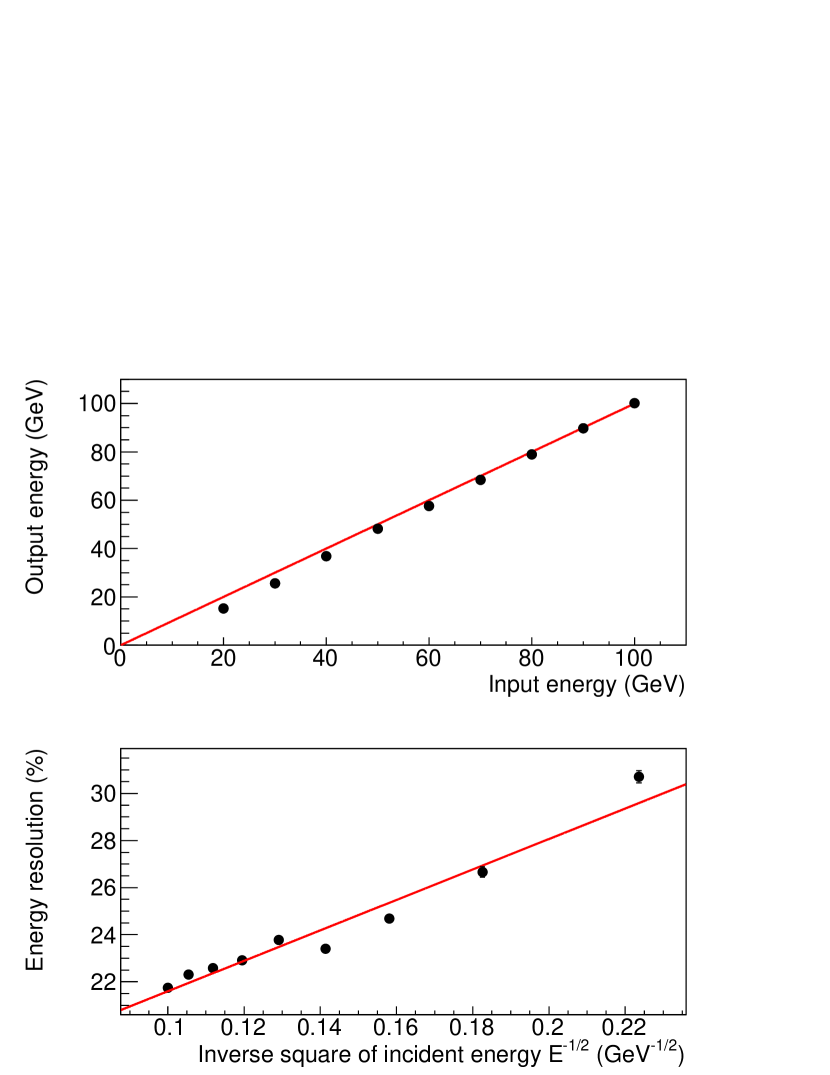
As shown in Fig. 4, the energy resolution for 20–100 GeV neutrons was described by
| (6) |
The absolute scale of the energy measurement was normalized with the 100 GeV single neutron peak in heavy ion collisions. However, the energy of neutrons from collisions was below 100 GeV, so simulation was used to estimate the detector response for neutron energies in this region.
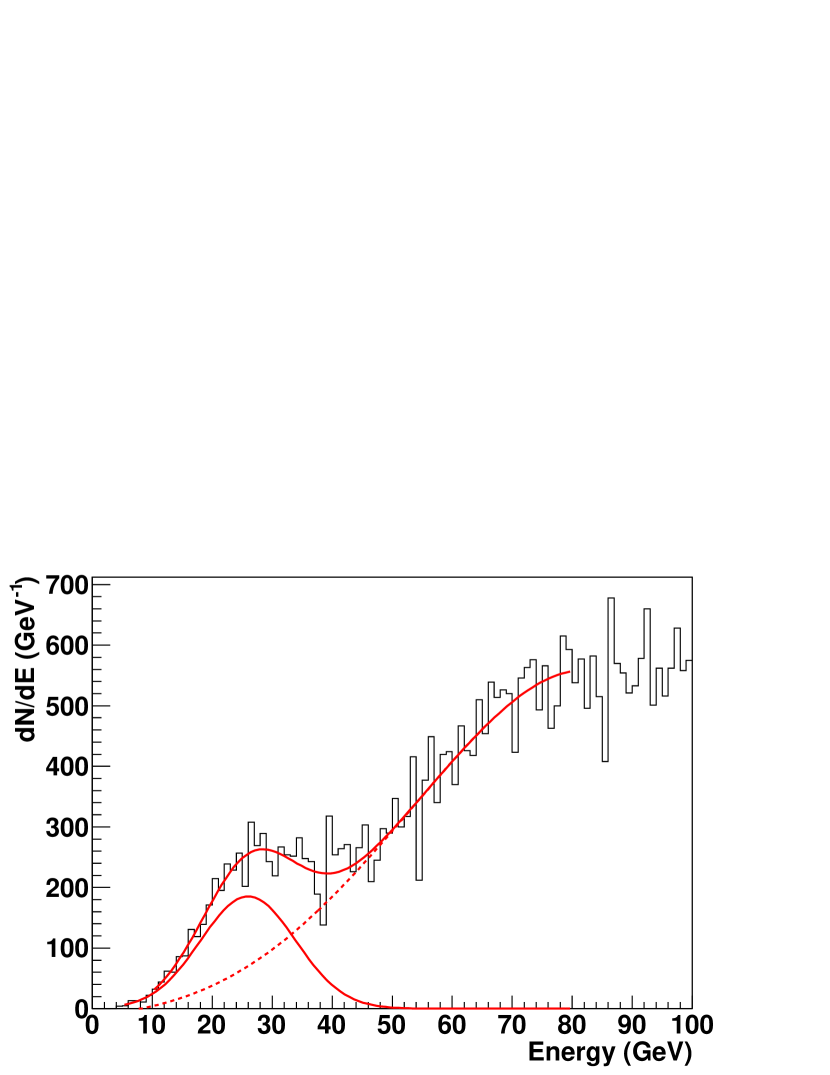
Figure 5 shows the absolute energy scale calibrated by observing one neutron from peripheral Cu+Cu collisions at = 200 GeV; 100 GeV neutrons less than 2 mrad from the beam axis produced the single neutron peak. The energy resolution expected from simulation was about 22% for the 100 GeV neutron and was consistent with the observed width of the single neutron peak as shown in Fig. 5. The energy nonlinearity was confirmed by the single neutron peak from Cu+Cu collisions at = 62.4 GeV shown in Fig. 6 which peaked at 260.3 GeV, consistent with nonlinearity indicated by the simulation.
The edge effect was studied by a prototype ZDC with a 100 GeV proton beam at CERN. Generally, the measured energy decreased near the edge, however, nearest the PMT, the measured energy increased. This was found to be caused by the fibers in the top region which connected to the PMT (see Fig. 5 of Adler:2000bd ); where the shower hit the fibers directly. The simulation used to study the prototype reproduced this effect.
A residual edge effect was seen in the data at the top and bottom of the detector, so we chose to apply a fiducial cut to minimize the effect. According to the simulation, 95–100% of the incident energy was contained within 3 cm.
II.2.2 Performance of the position measurement
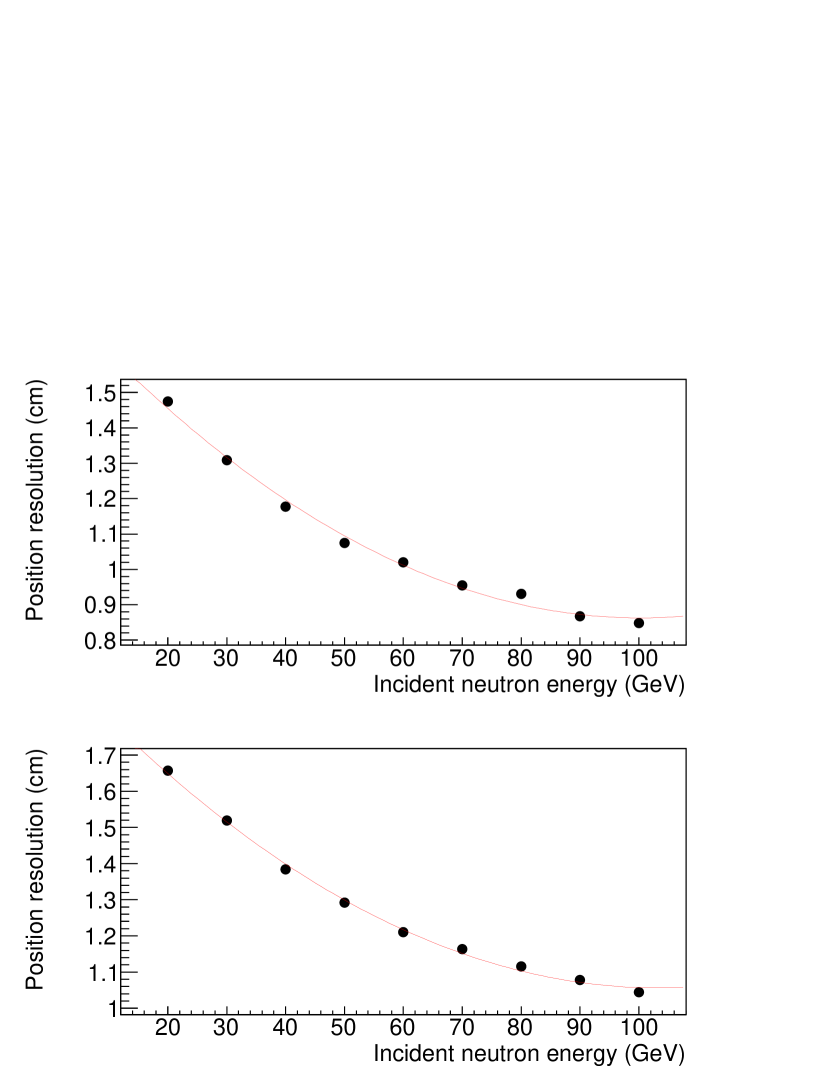
The position resolutions were evaluated by the simulation. Figure 7 shows the position resolution (RMS) as a function of the neutron incident energy for (horizontal) and (vertical) positions. The position resolution was approximately 1 cm for the neutron energy at 100 GeV.
Near the edge of the detector, the position measurement is also affected by shower leakage. If the incident position was in the edge area, the output position was shifted to the detector center due to shower leakage, independent of neutron energy. This position shift caused by the edge effect is corrected based on the simulation.
The reliability of the position measurement was studied by comparing hadron shower shapes of the data and simulation. The shower width and highest shower fraction among all scintillators were calculated for and independently. We compared the measured distribution with simulation for each SMD multiplicity since the hadron shower shape sensitively depends on the SMD multiplicity. The distribution of was well reproduced by the simulation, however the distribution of was not well reproduced, especially for the highest shower fraction in high SMD multiplicity events. The systematic uncertainties for the position measurement were estimated by matching the highest shower fraction of by smearing the simulated shower shapes in case of the SMD multiplicity = 7, which shows the worst agreement between the data and simulation. After the smearing to match the highest shower fraction, the shower width of the simulation also reproduced that of the experimental data. The position resolution increased 14% after the smearing.
II.2.3 Performance of the neutron identification
Events within the detector acceptance in collisions were studied with geant3 with pythia event generators, and the performance of neutron identification and its reliability were evaluated.
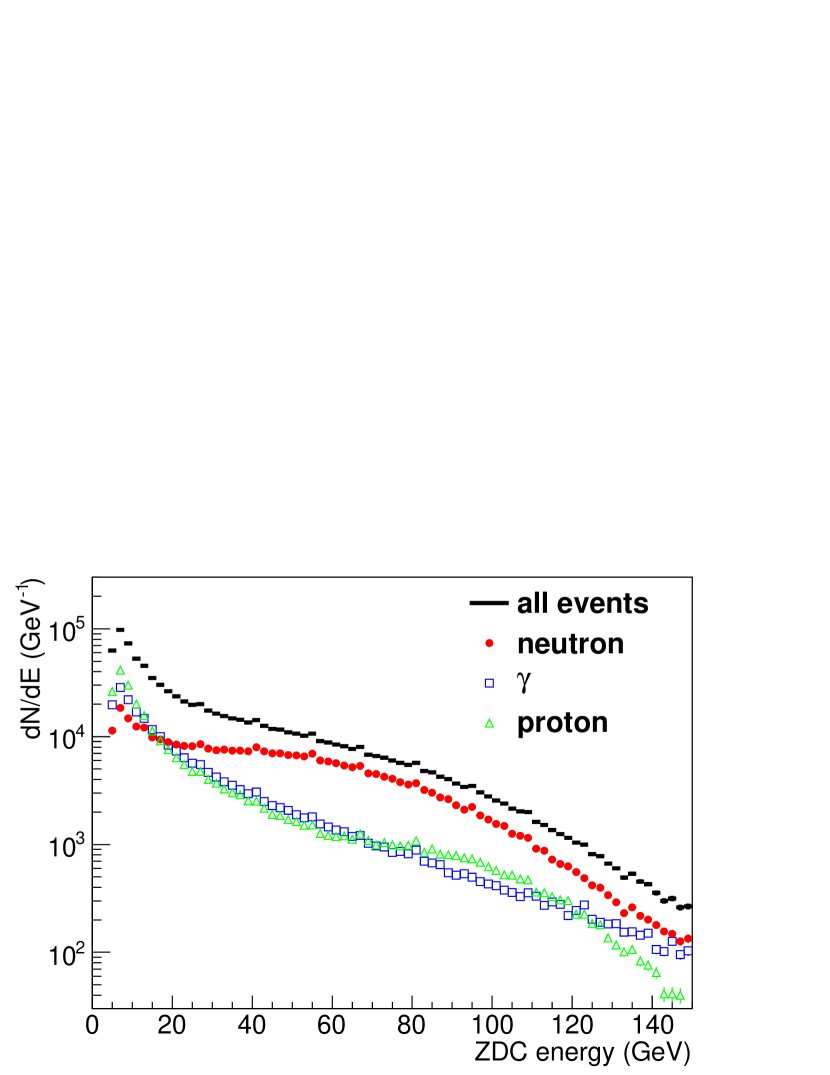
We studied particle species detected in the ZDC with the 5 GeV energy threshold which was required for the ZDC trigger (without the BBC coincidence requirement). In about 92% of events, only a single particle was detected by the ZDC in each collision, mainly photons, neutrons and protons. Energy distributions for these three particles are plotted in Fig. 8.
Only neutral particles, photons and neutrons, were expected to be detected with the ZDC due to sweeping of charged particles by the DX magnet. However scattered protons could hit the DX magnet or beam pipe and create a hadronic shower and particles from the shower could hit the ZDC.
Most of the photons and neutrons were generated by diffractive and gluon scattering processes. In pythia hard processes, neutrons are generated mainly from string fragmentation (65%) and then decay from . The forward photons were generated by decays of s (91%) and s (7%). Protons were generated by elastic and diffractive processes. Particles depositing less than 20 GeV of energy in the ZDC were predominantly photons and protons as shown in Fig. 8.
Photons are mostly absorbed in the first ZDC module, which is 51 radiation lengths long. Thus, photons were removed by requiring energy deposited in the SMD or in the second ZDC module. In photon rejection with the SMD, more than one scintillator above threshold (the SMD multiplicity 2) were required for both and . After applying this cut, the neutron purity was estimated to be 93.60.3%. In photon rejection with the second ZDC module, energy deposited in the second ZDC module above 20 GeV was required. After applying this cut, the neutron purity was estimated to be 93.60.5%. In the analyses of the cross section and the asymmetry, photon rejection with the SMD was applied since the position information calculated by the SMD was required. Rejection with the second ZDC was used for the estimation of the rejection efficiency with the SMD which is discussed in section III.1.
The charge veto counter was used to reject protons. A neutron energy above 20 GeV and the charge veto cut removed most proton events, as discussed later in this section.
The main backgrounds after neutron identification are s and protons. The purities were estimated for neutron energies above 20 GeV. In the cross section and the asymmetry analyses, we also required the acceptance cut and/or a higher energy cut. In these cases, the purities improve and are estimated in each analysis section.
In the ISR experiment, the contamination to the neutron measurement was estimated from the measurements Flauger:1976ju . They obtained 10 % contamination at =0.2 and less than 4 % at 0.4. The fraction of to neutron in pythia is consistent with the ISR result. We have included no correction for the contamination in this analysis.
The proton background is very sensitive to the materials around the ZDC and the magnet tuning in the accelerator. The systematic uncertainty of proton contamination was estimated by the simulation using the measured fraction of charged events in the charge veto counter. Noise was estimated by the pedestal width of the data and was incorporated into the simulation. For the proton contamination analysis, photon events were removed by requiring the second ZDC module cut. The fraction of proton events can be estimated as a fraction of charged candidates, which are the events with one more MIPs in the charge veto counter. These fractions were 0.42 and 0.28 for the data and simulation, respectively. Proton events in the experimental data were about 1.5 times more frequent than that of the simulation. We ascribe the difference to beam conditions that cause interactions with materials around the DX magnet and the ZDC.
The threshold dependence of the selection of charged particle candidates was also studied. The change in charged particle fraction was less than 1% so that the threshold dependence was negligibly small. Therefore, the factor 1.5 was a reasonable estimate for the fraction of charged candidates between the data and simulation.
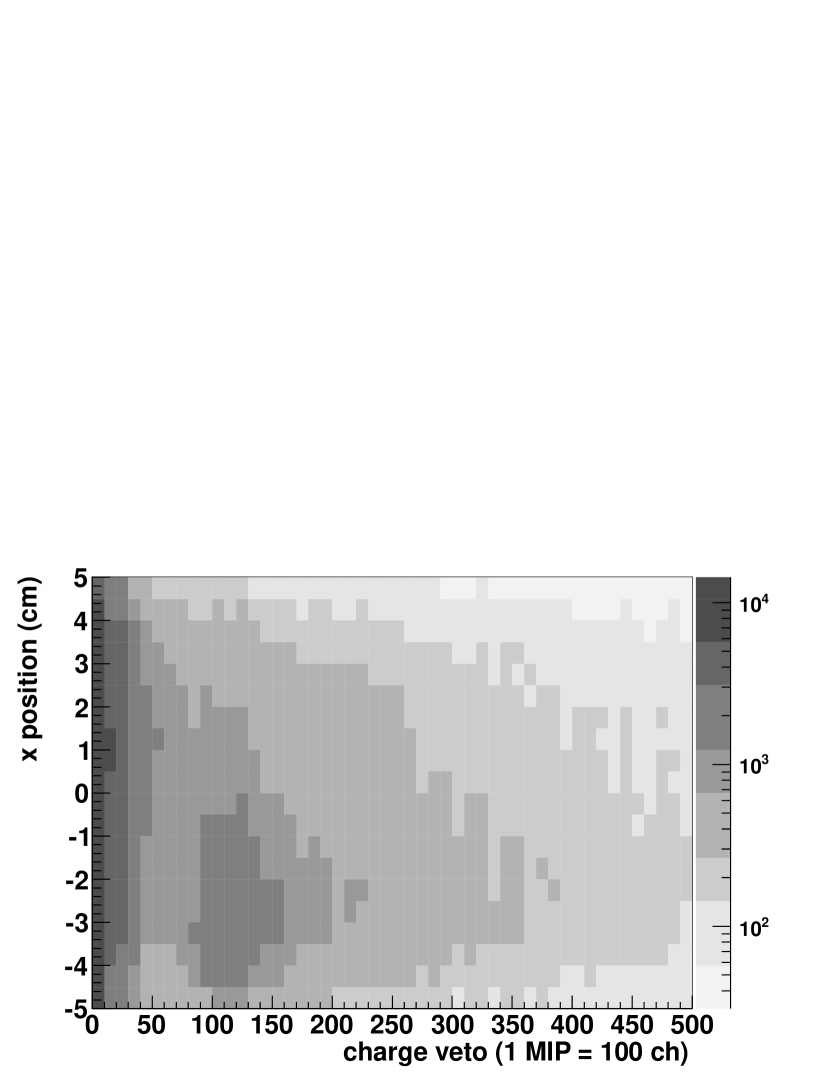
The proton background was estimated and included in the systematic uncertainties. According to the simulation study for the structure of proton events, proton events should be detected in the direction of beam bending which is negative for the south ZDC. This behavior was confirmed by the experimental data as shown in Fig. 9 which is a plot of the position determined by the SMD the charge distribution in the charge veto counter. Most charged candidates were distributed in the negative region. We assumed the proton background equals zero and evaluated its systematic uncertainty by the dilution method with =0 in the asymmetry analysis.
III Cross section measurement
III.1 Analysis
The differential cross section with respect to was measured:
| (7) |
where is the number of neutrons after the correction of cut efficiencies and the energy unfolding.
For the cross section analysis, 6.5 million events taken by the ZDC trigger were used from the sampled luminosity of 240 nb-1. The acceptance cut 2 cm was used to select kinematics similar to the ISR experiment. We assumed the beam axis was the same as the ZDC center in this analysis and the deviation was evaluated as a systematic uncertainty. The beam axis compared to the ZDC center is discussed in Appendix A.
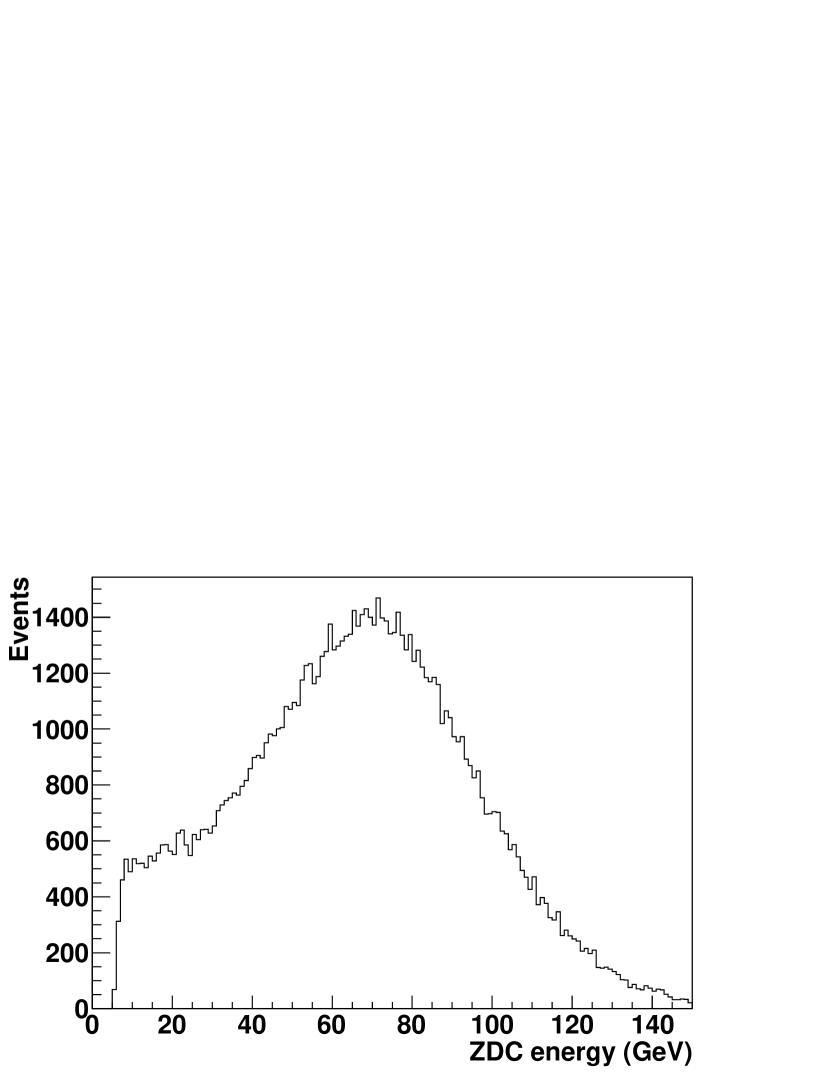
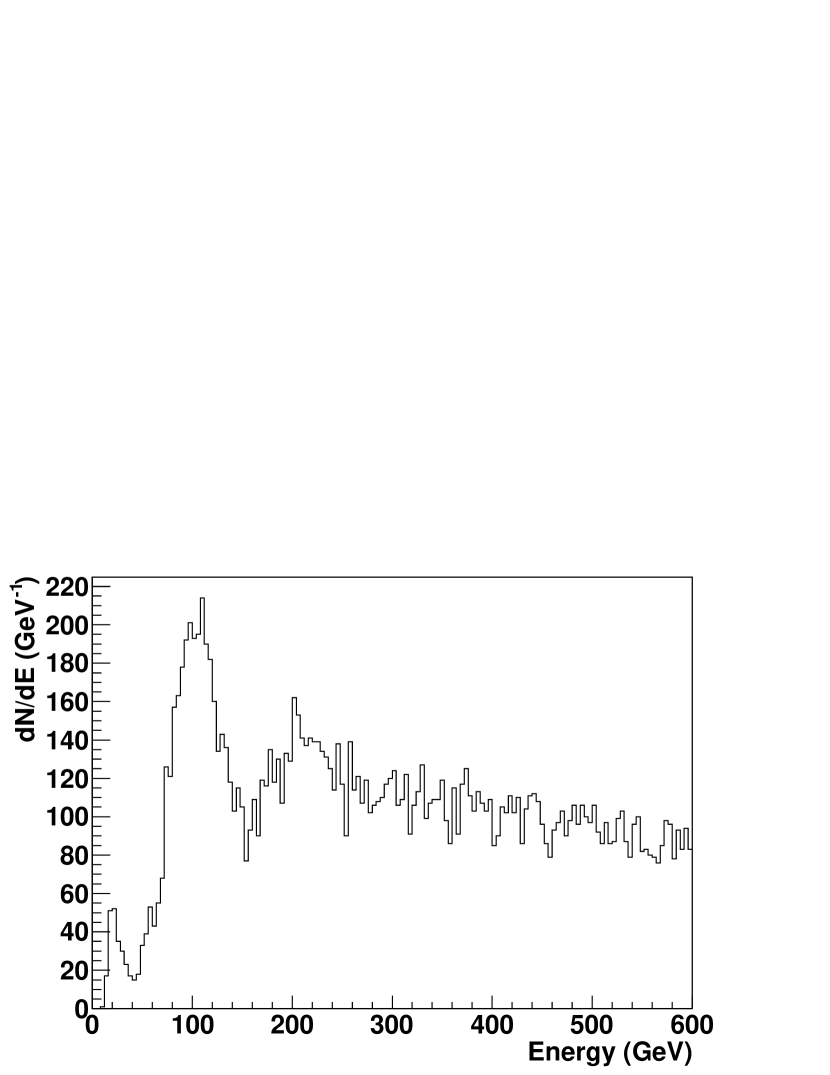
Figure 10 shows the energy distribution measured with the ZDC after the neutron identification and the acceptance cut. The energy spectrum was peaked at about 70 GeV, and this was used for a stability check of the ZDC gain run by run, which was found to be stable. The ratio of the neutron yield to the BBC counts without the collision vertex requirement was used for a stability check of the neutron selection, and it was also found to be stable.
One background source was beam-gas interaction. Beam-gas events are normally removed by requiring a forward-backward coincidence of the BBC detectors. However, this could not be done for the ZDC triggered events. Instead, we evaluated the fraction of beam-gas background using the 9 noncolliding bunch crossings with the combination of filled and empty bunches at PHENIX. We found that the fraction was 0.00620.0004 on average, negligibly small.
The neutron hit position was calculated by the centroid method using the distribution of scintillator charge above the threshold in the SMD, Eq. (4). In this analysis, the same threshold was applied to the data and simulation and the efficiency of the SMD cut was estimated by simulation. The difference of efficiencies caused by uncertainty of the SMD cut efficiency was estimated using the nearly pure neutron sample by the neutron identification with the second ZDC cut (section II.2.3). The energy spectrum was corrected based on the SMD cut efficiency before the energy unfolding.
The measured neutron energy with the ZDC is smeared by the energy resolution. To extract the initial energy distribution, it is necessary to unfold the measured energy distribution. The energy unfolding method is described in Appendix B.
The ZDC energy response to neutrons below 100 GeV was found by the simulation to be nonlinear as described in section II.2.1. This nonlinearity was included in the transition matrix of Appendix B, and corrected by the energy unfolding. Since the hadronic interaction could only be determined from simulation, a systematic uncertainty was included, using the variation of the cross section evaluated with a different matrix with a linear response.
The efficiency of the experimental cuts, including the neutron identification and the acceptance cut, for the unfolded distribution was estimated by the simulation with the single neutron event generator. The acceptance cut used the radius, , and the efficiency was evaluated from the distribution based on Eq. (3): GeV/.
For the distribution, we used two distributions: a Gaussian form , where was obtained by HERA Chekanov:2007tv with error evaluation, and an exponential form , where (GeV)-1 which was used in the ISR analysis Engler:1974nz ; Flauger:1976ju . The simulated distributions with those two input distribution were compared with experimental data normalized to the same total entries. It was found that the differences between data and those two inputs were not large as shown in Fig. 11.
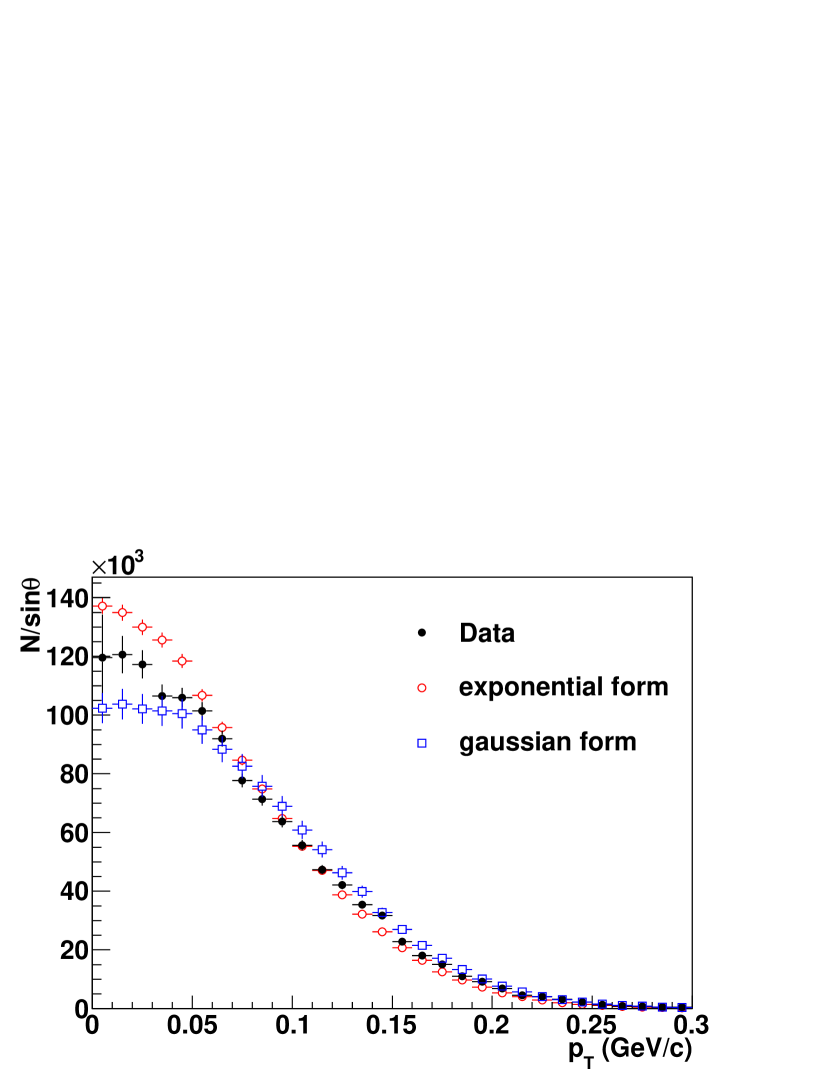
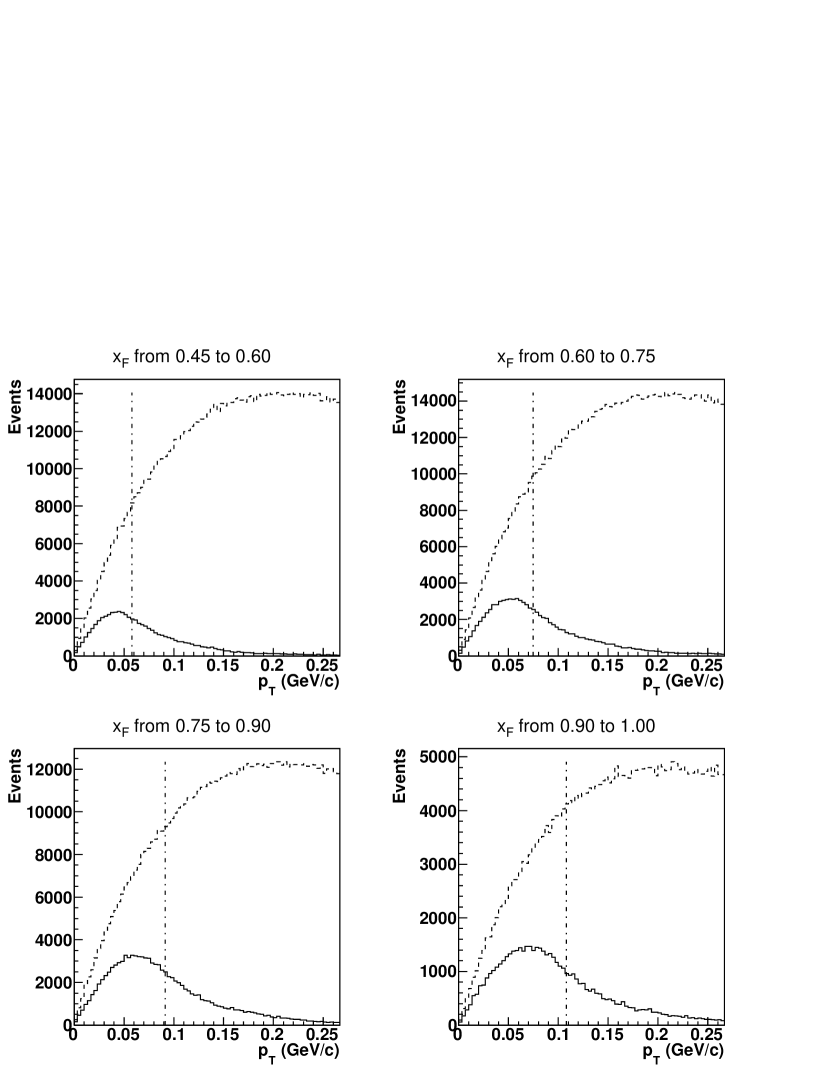
Figure 12 shows the simulated distributions (dashed line) in each bin. The geometrical maximum for the acceptance cut, cm, in each are given by GeV/, shown as dot-dashed vertical lines. The actual distributions with the experimental cuts were smeared due to the position resolution and the energy resolution, shown as solid lines. Ratios of these counts are the efficiency for the experimental cuts, and are listed in Table 1. The errors were derived considering the uncertainty in the parameter in the Gaussian form evaluated by HERA. There is no significant difference in the result in case of using the ISR (exponential) distribution.
| neutron | mean | efficiency |
|---|---|---|
| (GeV/) | ||
| 0.45–0.60 | 0.072 | 0.779 0.014 (1.8%) |
| 0.60–0.75 | 0.085 | 0.750 0.009 (1.2%) |
| 0.75–0.90 | 0.096 | 0.723 0.006 (0.8%) |
| 0.90–1.00 | 0.104 | 0.680 0.016 (2.3%) |
The mean values of the simulated distributions in each energy region are also listed in Table 1. The cross section was obtained after the correction of the energy unfolding and the cut efficiency.
| exponential form | Gaussian form | |
|---|---|---|
| distribution | 3 – 10% | 7 – 22% |
| beam center shift | 3 – 31% | |
| proton background | 3.6% | |
| multiple hit | 7% | |
| total | 11 – 33% | 16 – 39% |
Table 2 summarizes all systematic uncertainties evaluated as the ratio of the variation to the final cross section values. The absolute normalization error is not included in these errors. It was estimated by BBC counts to be 9.7% (22.92.2 mb for the BBC trigger cross section).
The background contamination in the measured neutron energy with the ZDC energy from 20 to 140 GeV for the acceptance cut of 2 cm was estimated by the simulation with the pythia event generator. The background from protons was estimated to be 2.4% in the simulation. The systematic uncertainty in the experimental data was determined to be 1.5 times larger than this as discussed in section II.2.3. Multiple particle detection in each collision was estimated to be 7% with the 2cm cut.
In the cross section analysis, we evaluated the beam center shift described in Appendix A as a systematic uncertainty. For the evaluation, cross sections were calculated in the different acceptances according to the result of the beam center shift while requiring 2 cm, and the variations were applied as a systematic uncertainty.
III.2 Result
| exponential form | Gaussian form | |
|---|---|---|
| 0.53 | 0.2430.0240.043 | 0.1940.0210.037 |
| 0.68 | 0.4910.0390.052 | 0.4550.0360.085 |
| 0.83 | 0.6800.0440.094 | 0.6120.0440.096 |
| 0.93 | 0.3340.0350.111 | 0.3190.0370.123 |
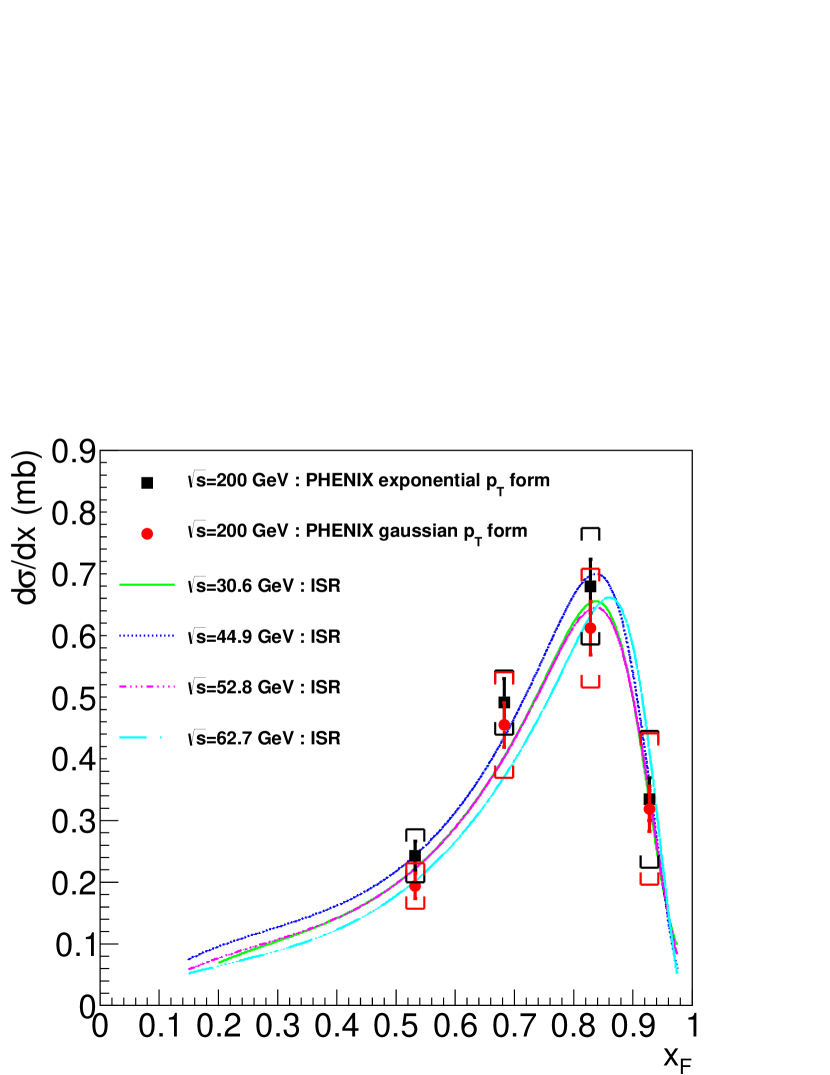
The differential cross section, , for forward neutron production in collisions at =200 GeV was determined using two distributions: a Gaussian form, as used in HERA analysis, and an exponential form, used for ISR data analysis. The results are listed in Table 3 and plotted in Fig. 13. We show the results for above 0.45 since the data below 0.45 are significantly affected by the energy cut-off before the unfolding. The range in each bin is GeV/ from Eq. (2) with the acceptance cut of cm. The absolute normalization uncertainty for the PHENIX measurement, 9.7%, is not included.
Invariant cross sections measured at the ISR experiment were converted to differential cross sections for the comparison with the PHENIX data. The conversion formula from the invariant cross section to is described with the approximation in the forward kinematics as
| (8) |
where means the range of the PHENIX acceptance cut; GeV/ for the cm cut. As a shape, we used an exponential form which was obtained from the region from the ISR results Engler:1974nz ; Flauger:1976ju .
For both the table and figure, we give the PHENIX results for two shapes, the exponential shape used for the ISR results, and the Gaussian shape used for HERA results.
The measured cross section at =200 GeV is consistent with the ISR result, indicating that scaling is satisfied at the higher center of mass energy. This result is consistent with the OPE model.
IV Single transverse spin asymmetry measurement
IV.1 Analysis
The single transverse spin asymmetry is obtained from the azimuthal modulation of neutron production relative to the polarization direction of a transversely polarized beam on an unpolarized target, and normalized by an independent measurement of the beam polarization. The stable polarization direction of protons is vertical with respect to the accelerator plane. There is an approximately equal number of bunches filled with the spin of polarization-up protons as of polarization-down protons. With both beams polarized, single-spin analyses were performed by taking into account the polarization states of one beam, averaging over those of the other. The beam polarizations were measured using fast carbon target polarimeters Jinnouchi at a different location at RHIC with several measurements in each fill. The carbon target measurements were normalized to absolute polarization measurements made by a separate polarized atomic hydrogen jet polarimeter Okada:2005gu . The polarizations ranged from 0.43 to 0.48 for the Blue beam and from 0.46 to 0.52 for the Yellow beam. Systematic uncertainty for the Blue beam polarization is 5.9%, and that for the Yellow beam polarization is 6.2%.
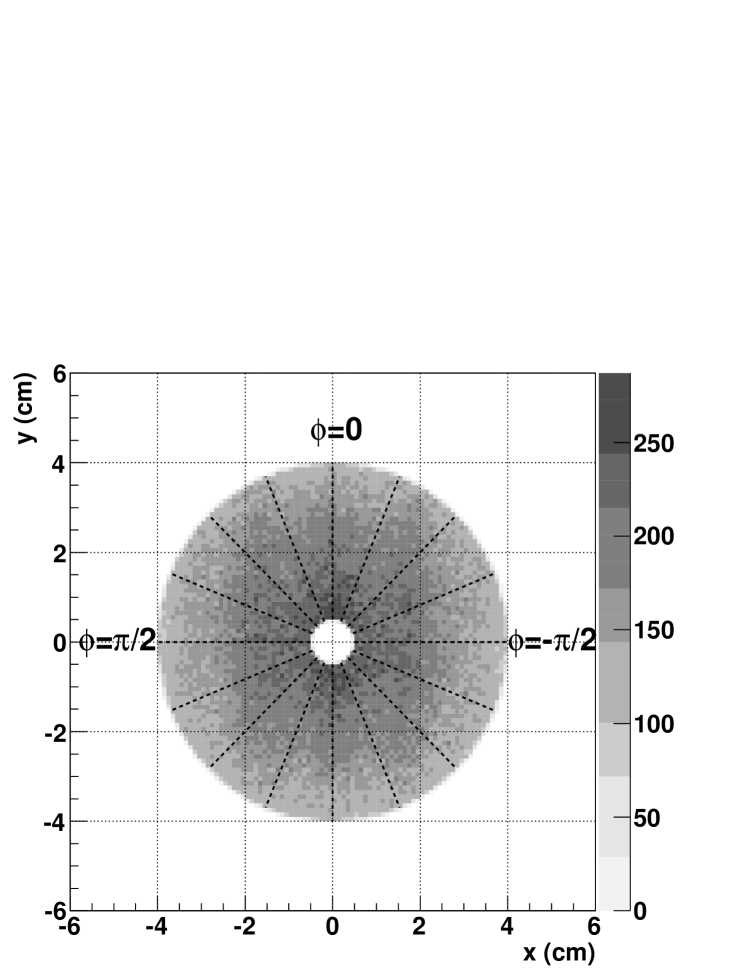
The acceptance definition for the azimuthal angle () of neutron production is shown in Fig. 14, where the polarization-up direction points to . The acceptance cut at the ZDC required 0.54.0 cm. The acceptance area was divided into 16 slices in a radial pattern. For the asymmetry calculation, we used a square-root formula which cancels many systematic uncertainties, such as detector and luminosity asymmetries:
| (9) |
where () is the number of events with polarization-up (-down) producing neutrons to azimuthal angle .
A correction is applied, discussed later, to account for smearing from position resolution. After normalization by the polarization, , we obtain the asymmetry as,
| (10) |
For this analysis, we used 6.5 million and 17.6 million events for the ZDC trigger sample and ZDCBBC trigger sample respectively from the sampled luminosity of 240 nb-1. A ZDC energy cut was required to select 40–120 GeV in the measured energy.
The raw measured asymmetry divided by the polarization are fitted to a sine:
| (11) |
where allows a deviation of the maximum asymmetry axis from vertical.
In the present analysis, we used only the south ZDC detector, which faces the Yellow beam. The forward neutron asymmetry uses the polarized Yellow beam and sums over the polarization states of the Blue beam bunches. Following the Basel (Ann Arbor) Convention Ashkin:1977ek , a positive indicates more production to the left of the polarized (Yellow) beam, for the polarization-up bunches in the Yellow beam. The asymmetry for neutrons produced backward was measured using a polarized Blue beam, summing over the polarization states of the Yellow beam bunches. In order to follow the Basel Convention, signs of the backward were inverted from the fitting results. A positive would indicate more neutron production to the left of the Blue (polarized) beam for polarization-up bunches.
We performed two sets of simulations to estimate the smearing parameters, , which were correlated to the neutron energy-dependent position resolution (section II.2.1). The energy distributions for the simulation inputs were determined in the same way as the cross section analysis (Section III.1).
The was smeared from the due to position resolution. From Eq. (10), the smearing parameter, , can be evaluated from simulation as,
| (12) |
where corresponds to the of the experimental data; it includes effects of the experimental cut and the position resolution. As , we generated neutrons with the sine modulated as Eq. (11) with ==0.10. The smeared amplitude was obtained as =0.076 and their ratio, 0.76, is the correction factor of the smearing effect, = 0.760 0.015 (ZDC trigger). For the ZDCBBC trigger we obtained the smearing parameter = 0.746 0.016 (ZDCBBC trigger).
For the analysis of the dependence of , we chose bins of 40-60, 60-80, and 80-120 GeV in the measured ZDC energy. Events with ZDC energy greater than 120 GeV were eliminated from this analysis (3.8% of the events). Similar simulations and calculations of were performed for the analysis of the dependence of the asymmetry with both the ZDC trigger and ZDCBBC trigger.
After correction for the smearing effect, we obtain the measured energy dependence of . The mean values for the ZDC trigger sample and ZDCBBC trigger sample were evaluated by the simulations which were modified to reproduce the measured energy distributions for each trigger sample.
The background contamination was studied by the simulation with the pythia event generator. In the analysis of the dependence of , an acceptance cut of 3 cm was applied.
After the neutron identification and the acceptance cut, as described in section II.2.3, the neutron purities were 0.975 0.006 for the ZDC trigger sample, and 0.977 0.010 for ZDCBBC trigger sample. Main background contributions were the and proton. According to the discussion in section II.2.3, we applied the systematic uncertainty contributed from the proton only. They were 1.4% and 1.0% for the ZDC trigger and ZDCBBC trigger respectively and were increased by the factor 1.5 estimated higher frequency of proton background in the experimental data, compared to simulation, to give 2.1% and 1.5%, which were included as systematic uncertainties. Multiple particle detection in each collision was estimated to be 6.5% for the ZDC trigger and 5.9% for the ZDCBBC trigger for the 0.54.0 cm cut.
To evaluate the systematic uncertainty for determination of the beam axis, were calculated with center positions as (,) = (0.46, 0.00), (0.00, -1.10) and (0.46, -1.10) cm while keeping the acceptance cut, 0.54.0 cm. These values were chosen based on measurements of the beam center as discussed in Appendix A. Maximum variations to final values, which were calculated by (,) = (0.00, 0.00) cm, were included as systematic uncertainties.
Since the smearing effect was caused by the position resolution, the systematic uncertainty of the position resolution, 14% (section II.2.2), should be reflected in the uncertainties for the result. This was evaluated with a variation of the asymmetry calculated with 14% increased position resolution uncertainty in the simulation. The asymmetry was reduced by 4.2%. This was assigned as a systematic uncertainty of the smearing correction.
A technique called “bunch shuffling” was used to check for systematic effects in the asymmetry measurements due to a variation of beam characteristics bunch by bunch. By randomly assigning bunch polarization directions, we create data sets of experimental data with little or no net polarization, and compare the resulting measured asymmetry with statistical uncertainties. The fluctuation of measured asymmetries should correspond to the statistical uncertainty. We concluded that the fake asymmetry from bunch characteristics is less than 0.39 and 0.36 for the ZDC trigger and ZDCBBC trigger respectively. We do not include these uncertainties in the final systematic uncertainties for .
-correlated uncertainties from the beam center shift were evaluated in a similar way to the cross section analysis described in Appendix A. They were 0.004 in the -integrated analysis, and 0.004–0.010 in the -dependent analysis.
| ZDC trigger | ZDCBBC trigger | |
|---|---|---|
| proton background | 2.1% | 1.5% |
| multiple hit | 6.5% | 5.9% |
| smearing | 4.2% | |
| total | 8.0% | 7.4% |
Scale uncertainties are summarized in Table 4 for the measurements. Values are presented as scale variations to the final values. Total uncertainties were calculated by quadratic sum. The scale uncertainty from the beam polarization is not included in the table. The uncertainty in the Yellow beam polarization which was used in the forward neutron asymmetry measurement was 6.2%, and that in the Blue beam polarization used in the backward neutron asymmetry measurement was 5.9%.
IV.2 Azimuthal modulation of forward neutron production
In this section we present the results for the azimuthal modulations for neutron production, within the acceptance from mrad ( cm at ZDC) to mrad ( cm), and ZDC energy from 40 GeV to 120 GeV.
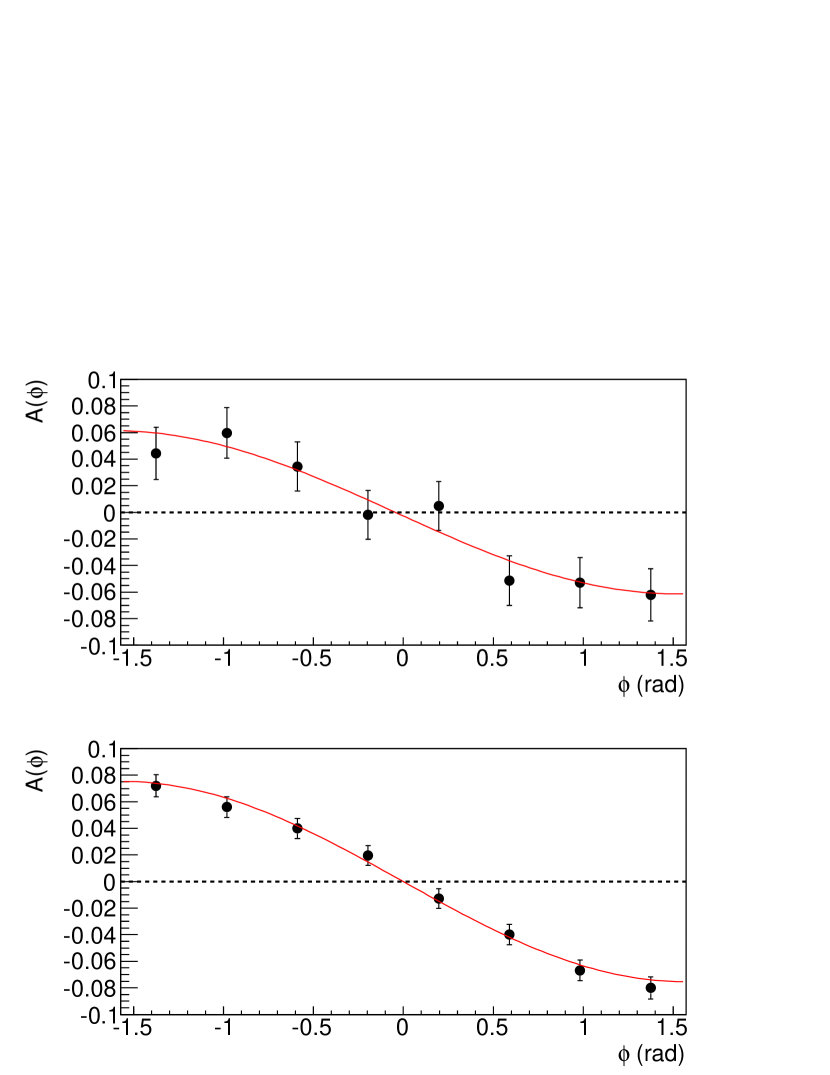
Asymmetries were calculated for eight azimuthal angle bins, using Eq. (9) and Eq. (10). Figure 15 and 16 present for the two trigger conditions, for forward and backward neutron production respectively. Statistical uncertainties are shown in the figure. The -correlated systematic uncertainties from the beam center shift are not shown. In addition, there are scale uncertainties listed in Table 4 and polarization scale uncertainties.
A significant asymmetry is present for forward neutron production. The data were fitted with a sine curve, Eq.(11), to obtain . The azimuthal offsets, , were consistent with . The results obtained for are: () for the ZDC trigger sample and () for the ZDCBBC trigger sample. There is no observed asymmetry for backward neutron production. The results for backward neutron production for are: () for the ZDC trigger sample and () for the ZDCBBC trigger sample.
To compare with the previous result Fukao:2006vd from the polarimeter development experiment at RHIC, we compared to the of the forward ZDCBBC trigger sample. The amplitude of the measured was; . Errors indicate the statistics, systematics and the scaling uncertainty from the polarization measurement. The two results are consistent within the errors, including the scaling uncertainties. We note that the two measurements used slightly different detection coverages for the charged particle interaction trigger: 2.23.9 in the horizontal and vertical directions for the polarimeter development experiment, and 3.03.9 for the PHENIX experiment.
IV.3 dependence of
| -0.776 | -0.00590.02520.0095 | 11.6/7 |
|---|---|---|
| -0.682 | -0.02190.02550.0035 | 6.833/7 |
| -0.568 | -0.00500.03030.0076 | 9.252/7 |
| 0.568 | -0.05030.02630.0076 | 7.012/7 |
| 0.682 | -0.06250.02210.0035 | 2.68/7 |
| 0.776 | -0.07720.02170.0095 | 5.38/7 |
| -0.749 | 0.00350.01170.0082 | 2.672/7 |
|---|---|---|
| -0.664 | -0.00930.01060.0037 | 2.915/7 |
| -0.547 | -0.00330.01150.0096 | 6.783/7 |
| 0.547 | -0.06290.00970.0096 | 13.27/7 |
| 0.664 | -0.06570.00900.0037 | 5.425/7 |
| 0.749 | -0.06670.00990.0082 | 5.003/7 |
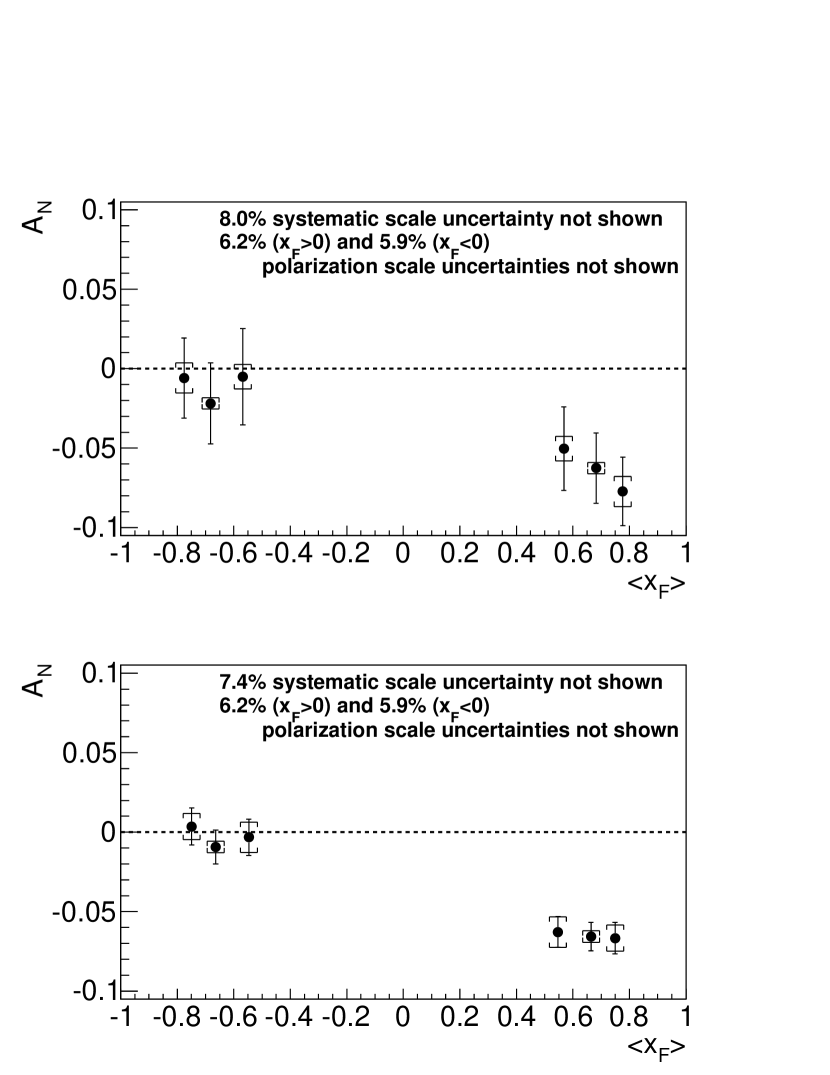
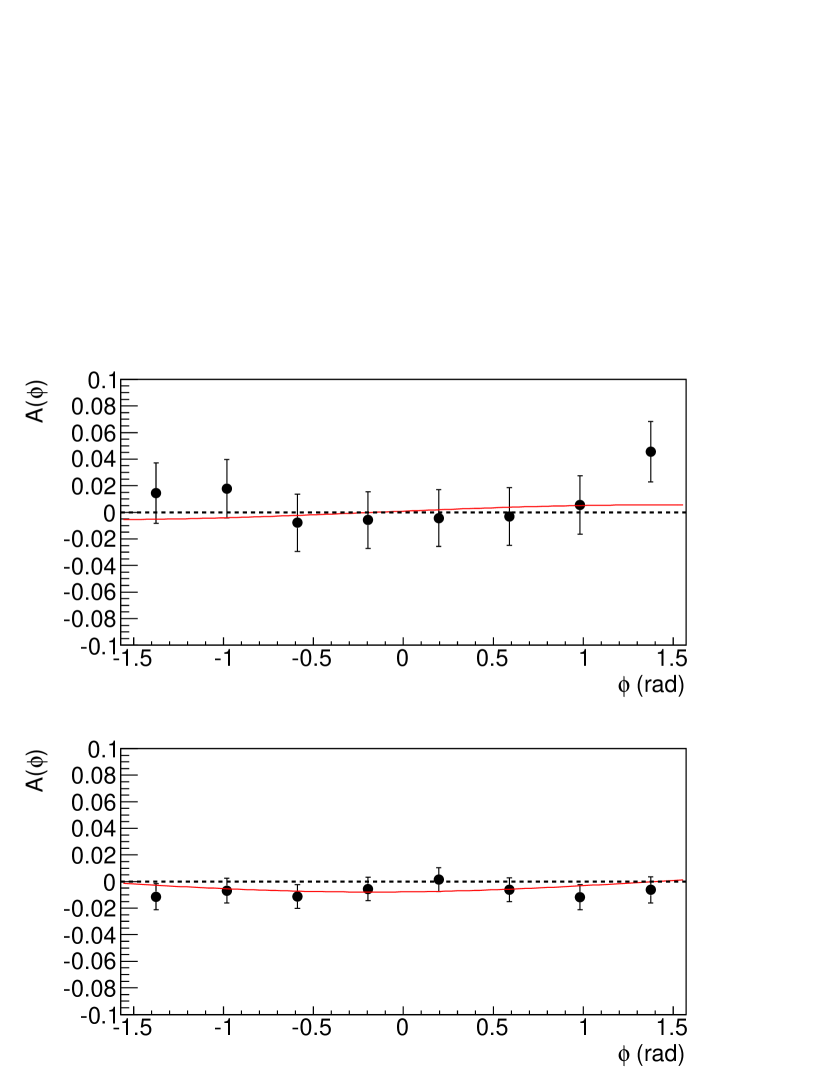
The dependence of for production is listed in Table 5 and 6, and plotted in Fig. 17. The data were fitted with a sine curve, Eq.(11), to obtain with . The mean values were determined according to section IV.1. Statistical uncertainties are shown as error bars and -correlated systematic uncertainties are shown as brackets. Scale uncertainties from the asymmetry measurements and the beam polarization are not included.
We observe significant negative for neutron production in the positive region and with no energy dependence within the uncertainties, both for inclusive neutron production and for production including a beam-beam interaction requirement. No significant backward neutron production asymmetry is observed.
V Discussion
The measurement of the cross section for the production of neutrons at =200 GeV has been presented here, and it is consistent with scaling when compared to ISR results. These cross sections are described by the OPE model in Regge calculus Capella:1975qk ; Kopeliovich:1996iw ; Nikolaev:1997cn ; Nikolaev:1998se ; D'Alesio:1998bf ; Kaidalov:2006cw ; Bunyatyan:2006vy . Therefore, the observed large asymmetry for neutron production at RHIC, as presented in Fukao:2006vd and here, may arise from the interference between a spin-flip amplitude due to the pion exchange and nonflip amplitudes from other Reggeon exchanges. So far our knowledge of Reggeon exchange components for neutron production is limited to the pion. Under the OPE interpretation, the asymmetry has sensitivity to the contribution of all spin nonflip Reggeon exchanges, even if the amplitudes are small. Recently Kopeliovich et al. calculated the of forward neutron production from the interference of pion and Reggeon exchanges, and the results were in good agreement with the PHENIX data Kopeliovich:2011bx .
We can also discuss our results based on the meson-cloud model meson-cloud . This model gives a good description for the result from a Drell-Yan experiment at FNAL, E866Towell:2001nh . In this model, the Drell-Yan process is generated by the interaction between the quark in one proton and the quark in the of state for other proton. In this model the neutron should be generated with very forward kinematics, possibly similar to the kinematics of the results presented here. The meson-cloud model was successfully applied to neutron production in the ISR experiment D'Alesio:1998bf and we expect it is applicable to our and cross section measurements for higher energy collisions.
VI Conclusion
We have measured the cross section and single transverse spin asymmetry, , for very forward neutron production in polarized + collisions at =200 GeV. The results from the PHENIX experiment at RHIC were based on a zero degree hadronic calorimeter (ZDC) augmented by a shower maximum detector, covering neutron production angles to =2.2 mrad. A large for neutron production had been observed in a polarimeter development experiment at RHIC, using an electromagnetic calorimeter to identify neutrons, with coarse neutron energy resolutionFukao:2006vd . The PHENIX experiment then outfitted existing ZDC detectors to act as polarimeters to monitor the beam polarizations and polarization directions at the experiment. The results presented here are based on studies with the ZDC polarimeter, which due to a much better measurement of the neutron energy, provide first measurements of the neutron production cross section at RHIC energy, and the dependence of on the neutron energy.
The measured cross section is consistent with scaling from ISR results. Within uncertainties, the observed were consistent with the previous result at RHIC Fukao:2006vd and for (the region measured by this experiment) no significant dependence was observed. We also present measured for neutrons produced backward from the polarized beam. These results are consistent with zero.
The cross sections for large neutron production, as well as those in collisions at HERA, are largely reproduced by a one pion exchange model (OPE). Using this model, the observed large asymmetry for the neutron production would be considered to come from the interference between a spin-flip amplitude due to the pion exchange and nonflip amplitudes from other Reggeon exchanges. On the basis of the OPE model, the large neutron would have sensitivity to the contribution of other Reggeon exchanges.
Future measurements of neutron production cross sections and asymmetries will include analysis of RHIC runs at =62.4 GeV and at 500 GeV. The measurements at different center of mass energies will probe the and dependence for neutron production at fixed, very forward production angles 2.2 mrad.
ACKNOWLEDGMENTS
We thank the staff of the Collider-Accelerator and Physics Departments at Brookhaven National Laboratory and the staff of the other PHENIX participating institutions for their vital contributions. We acknowledge support from the Office of Nuclear Physics in the Office of Science of the Department of Energy, the National Science Foundation, a sponsored research grant from Renaissance Technologies LLC, Abilene Christian University Research Council, Research Foundation of SUNY, and Dean of the College of Arts and Sciences, Vanderbilt University (U.S.A), Ministry of Education, Culture, Sports, Science, and Technology and the Japan Society for the Promotion of Science (Japan), Conselho Nacional de Desenvolvimento Científico e Tecnológico and Fundação de Amparo à Pesquisa do Estado de São Paulo (Brazil), Natural Science Foundation of China (P. R. China), Ministry of Education, Youth and Sports (Czech Republic), Centre National de la Recherche Scientifique, Commissariat à l’Énergie Atomique, and Institut National de Physique Nucléaire et de Physique des Particules (France), Bundesministerium für Bildung und Forschung, Deutscher Akademischer Austausch Dienst, and Alexander von Humboldt Stiftung (Germany), Hungarian National Science Fund, OTKA (Hungary), Department of Atomic Energy and Department of Science and Technology (India), Israel Science Foundation (Israel), National Research Foundation and WCU program of the Ministry Education Science and Technology (Korea), Ministry of Education and Science, Russian Academy of Sciences, Federal Agency of Atomic Energy (Russia), VR and Wallenberg Foundation (Sweden), the U.S. Civilian Research and Development Foundation for the Independent States of the Former Soviet Union, the US-Hungarian Fulbright Foundation for Educational Exchange, and the US-Israel Binational Science Foundation.
Appendix A The study of the beam axis on the detector geometry
The ZDC center was aligned to the beam axis at the beginning of the 2003 run. We assumed that the beam axis was on the ZDC center in this analysis of 2005 data. We used two approaches to estimate the beam and ZDC alignment. Peripheral neutrons from a heavy ion run just prior to the polarized proton run gave centers of cm and cm at the south ZDC. The center of the asymmetry was also used to determine the center of the beam axis at the ZDC, since must be zero at zero production angle. We used the ZDCBBC trigger sample in this analysis. The asymmetry was measured for a vertically polarized beam to obtain the center in , and for a special run with horizontally polarized beam to obtain the center in . The results were cm and cm. The results of the two techniques agreed reasonably for , and did not agree for .
The beam axis shifts that we observed were considered as systematic uncertainties for the results. The uncertainties were determined from variations of the cross section and asymmetry obtained by moving the center of acceptance while keeping the same cut region (for example, 2 cm for the cross section analysis).
Appendix B Energy Unfolding
The measured neutron energy with the ZDC is smeared by the energy resolution. For the extraction of the original energy distribution, it is necessary to unfold the measured energy distribution. We use an unfolding method proposed in Blobel:2002pu .
We assume that the initial distribution is smeared to the measured distribution and this smearing is described by a linear combination. Their relation can be given by a transition matrix as,
| (13) |
or .
If the smearing effect is large, the result is very sensitive to a small change of . It can be discussed using an orthogonal decomposition. The matrix is diagonalized into with a transformation matrix ,
| (14) |
where , and and are new vectors transformed from and , respectively. The diagonal elements of the matrix are the eigenvalues of the matrix . Each of the coefficients and in is transformed independently of any other coefficient by using eigenvalue ,
| (15) |
In order to perform the unfolding, the coefficients have been affected by statistical fluctuations of the elements of measured vector . The which includes the information of initial vector is obtained by . The statistical fluctuation of the amplified in the case of small eigenvalue , resulting in instability. Reasonable result can be obtained by cutting the which has a large statistical uncertainty.
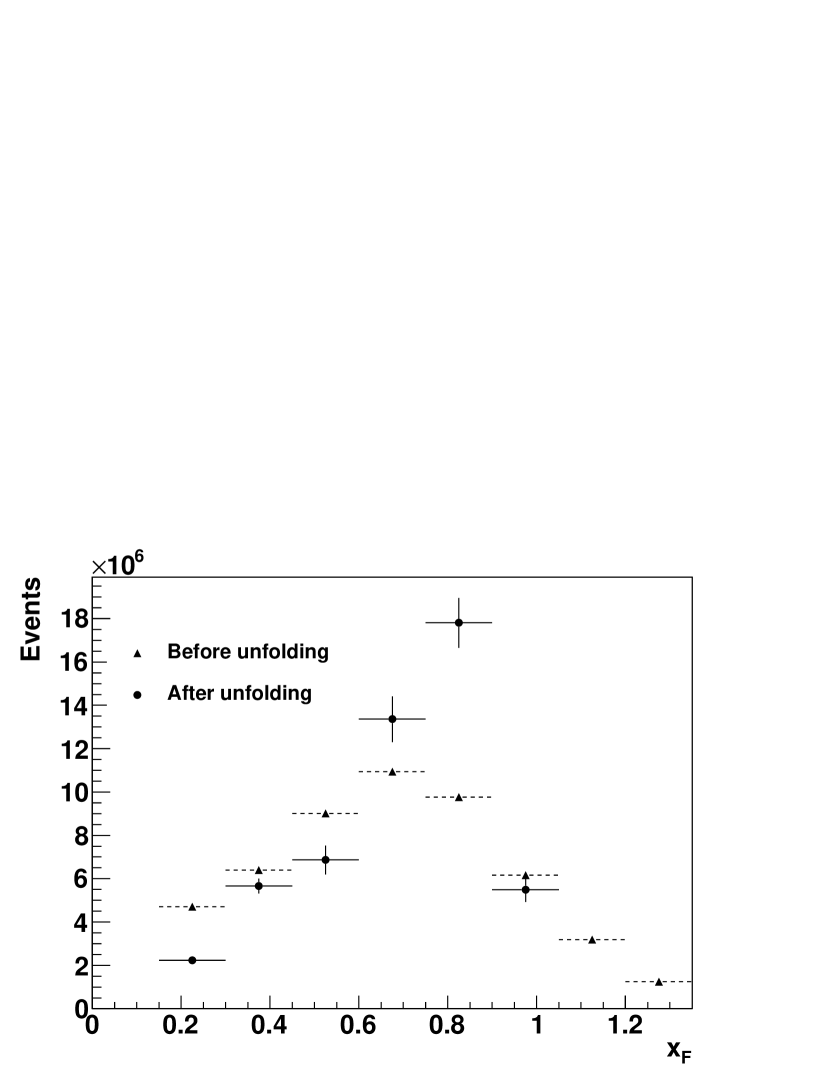
First, the coefficients were calculated. Three sets of the transition matrix , which have the same energy resolution but different initial energy distributions, were prepared with a simulation to check the statistical error propagation of the . Initial shapes were prepared to increase, be flat and decrease as a function of . These shapes are close to the cross sections at 0.0 GeV/, 0.2 GeV/ and 0.4 GeV/ in the ISR results. Energy spectra before and after the unfolding are plotted in Fig. 18. Horizontal axis is changed to by Eq. (2).
References
- (1) Y. Fukao et al., Phys. Lett. B650, 325 (2007).
- (2) J. Engler et al., Nucl. Phys. B 84, 70 (1975).
- (3) W. Flauger and F. Monnig, Nucl. Phys. B 109, 347 (1976).
- (4) A. Capella, J. Tran Thanh Van, and J. Kaplan, Nucl. Phys. B 97, 493 (1975).
- (5) B. Kopeliovich, B. Povh, and I. Potashnikova, Z. Phys. C 73, 125 (1996).
- (6) N. N. Nikolaev, J. Speth, and B. G. Zakharov, hep-ph/9708290.
- (7) N. N. Nikolaev, W. Schafer, A. Szczurek, and J. Speth, Phys. Rev. D 60, 014004 (1999).
- (8) U. D’Alesio and H. J. Pirner, Eur. Phys. J. A 7, 109 (2000).
- (9) A. B. Kaidalov, V. A. Khoze, A. D. Martin, and M. G. Ryskin, Eur. Phys. J. C 47, 385 (2006).
- (10) A. Bunyatyan and B. Povh, Eur. Phys. J. A 27, 359 (2006).
- (11) S. Chekanov et al. (ZEUS Collaboration), Nucl. Phys. B 776, 1 (2007).
- (12) F. D. Aaron et al. (H1 Collaboration), Eur. Phys. J. C 68, 381 (2010).
- (13) T. Anticic et al. (NA49 Collaboration), Eur. Phys. J. C 65, 9 (2010).
- (14) K. Adcox et al. (PHENIX Collaboration), Nucl. Instrum. Meth. A 499, 469 (2003).
- (15) C. Adler, A. Denisov, E. Garcia, M. J. Murray, H. Strobele, and S. N. White, Nucl. Instrum. Meth. A 470, 488 (2001).
- (16) R. Brun, F. Carminati, and S. Giani, “geant Detector Description and Simulation Tool,” CERN-W5013.
- (17) T. Sjostrand, P. Eden, C. Friberg, L. Lonnblad, G. Miu, S. Mrenna, and E. Norrbin, Comput. Phys. Commun. 135, 238 (2001).
- (18) O. Jinnouchi et al., RHIC/CAD Accelerator Physics Note 171, 2004.
- (19) H. Okada et al., Phys. Lett. B 638, 450 (2006).
- (20) J. Ashkin, E. Leader, M. L. Marshak, J. B. Roberts, J. Soffer, and G. H. Thomas, AIP Conf. Proc. 42, 142 (1978).
- (21) B. Z. Kopeliovich, I. K. Potashnikova, I. Schmidt, and J. Soffer, Phys. Rev. D 84, 114012 (2011)
- (22) K. G. Boreskov and A. B. Kaidalov, Eur. Phys. J. C 10, 143 (1999); R. J. Fries and A. Schafer, Phys. Lett. B 443, 40 (1998).
- (23) R. S. Towell et al. (FNAL E866/NuSea Collaboration), Phys. Rev. D 64, 052002 (2001)
- (24) V. Blobel, arXiv:hep-ex/0208022.