BAORadio: A digital pipeline for radio interferometry and 21 cm mapping of large scale structures
Abstract
3D mapping of matter distribution in the universe through the 21 cm radio emission of atomic hydrogen () is a complementary approach to optical surveys for the study of the Large Scale Structures, in particular for measuring the BAO (Baryon Acoustic Oscillation) scale up to redshifts , and therefore constraining dark energy parameters. We propose a novel method to map the mass distribution in three dimensions in radio, without detecting or identifying individual compact sources. This method would require an instrument with a large instantaneous bandwidth () and high sensitivity, while a rather modest angular resolution () should be sufficient. These requirements can be met by a dense interferometric array or a phased array (FPA) in the focal plane of a large primary reflector, representing a total collecting area of a few thousand square meters with few hundred simultaneous beams covering a 20 to 100 square degrees field of view. We describe the development and qualification of an electronic and data processing system for digital radio interferometry and beam forming suitable for such instruments with several hundred receiver elements.
Résumé BAORadio: une chaîne numérique pour la radio-interférométrie et la cartographie des grandes structures à 21 cm La cartographie de l’univers en radio, à travers l’observation de la raie à 21 cm de l’hydrogène atomique, constitue une approche complémentaire aux relevés optiques pour l’étude des grandes structures, et en particulier des oscillations acoustiques baryoniques (BAO). Nous proposons une méthode originale de la mesure de la distribution de l’hydrogène atomique neutre à travers une cartographie à 3 dimensions de l’émission du gaz à 21 cm, sans identification de sources compactes. Cette méthode nécessite un instrument avec une grande sensibilité et une grande largeur de bande instantanée ( 100 MHz), alors qu’elle peut se contenter d’une résolution angulaire moyenne (10 arcmin). Ces performances peuvent être obtenues avec un réseau interférométrique compact ou un réseau phasé au foyer d’un grand réflecteur, représentant une surface collectrice de quelques milliers de m2 avec quelques centaines de lobes simultanés couvrant un champ de vue de 20 à 100 deg2. Nous décrivons le développement et la qualification d’un système électronique et de traitement pour la radio-interférométrie et la synthèse de lobe numérique, adapté à ce type d’instrument avec plusieurs centaines d’éléments de réception.
keywords:
Cosmology; Dark Energy; 21 cm radio interferometry Mots-clés : Cosmologie; Énergie Noire; Radio-interférométrie à 21 cm;The next generation radiotelescopes/ Les radiotélescopes du futur
, , , , , , ,
1 Introduction
The nature and properties of Dark Energy are among the most puzzling questions in physics and cosmology today. Dark Energy has been hypothesized as a mysterious energy density component present in the Universe responsible for its accelerated expansion [1, 2]. The acoustic oscillations of the photon-baryon plasma prior to the decoupling are the source of modulations or wiggles present in the spatial power spectrum of matter distribution in the universe, usually referred to as BAO (Baryon Acoustic Oscillations). These acoustic oscillations have clearly been observed in the anisotropies of the Cosmic Microwave Background [3]. The measurement of the oscillation wavelength at different redshifts is a standard ruler type cosmological probe and is considered as one of the most robust probes of the Dark Energy equation of state [4].
The matter distribution in the Universe is often observed in the optical window using galaxies as tracers. The BAO scale has indeed been already measured by optical photometric or spectroscopic surveys up to redshifts (see e.g. [5]).
Another possible tracer is the neutral atomic hydrogen () gas which can be detected through its 21 cm emission or absorption. Radio surveys to map matter distribution using 21-cm emission are complementary to optical surveys to study the Large Scale Structure (LSS) statistical properties. A novel method to perform such a survey through intensity mapping has been suggested by J.B. Peterson and collaborators [6]. It should be stressed that the observation method discussed here (Intensity Mapping) aims at the measurement of the total 21 cm radiation intensity as a function of the redshift , without detection of individual compact radio sources (galaxies …) [7, 8, 9]. Such a survey would produce a 3D map of emission (2 angles + frequency redshift), with an angular resolution of 10-20 arc minutes, and 50 kHz in frequency ().
A research and development program (BAORadio) in electronics for radio interferometry for the GHz frequency domain has been initiated by LAL (CNRS/IN2P3)111http://www.lal.in2p3.fr and Irfu (CEA)222http://irfu.cea.fr at the end of 2006. Observatoire de Paris333http://www.obspm.fr (GEPI and Nançay radio observatory) is also a major partner of this program since the summer 2007. A complete analog and digital electronic pipeline, with the corresponding firmwares and acquisition and processing softwares has been designed and developed, by a team with broad technical and scientific expertise from partner laboratories and the financial support from P2I444GIS Physique des Deux Infinis, Irfu (CEA), IN2P3 (CNRS) and PNCG555Programme National Cosmologie et Galaxies. This system has been used in interferometric mode to characterize the cylindrical reflectors built by our colleagues at the University of Carnegie-Mellon (CMU) at Pittsburgh [10]. The FAN project (Focal Array at Nançay) uses also the electronic and acquisition system developed for the BAORadio project. A phased array multi-beam receiver for the Nançay Radio Telescope (NRT) has been developed and is being characterized at the focal plane of NRT in the framework of the FAN project. This can lead to the development of a multi-beam system which can enhance the sensitivity of the NRT by an order of magnitude in survey mode [martin.11].
The scientific issues and specific difficulties of the observation method proposed here, for the 3D mapping of the 21 cm emission temperature as a function of frequency (Intensity Mapping), will be presented in section 2. We will more specifically discuss the sensitivity needed to measure the spatial power spectrum of matter density inhomogeneities and the scientific and technical challenge of separating the cosmological signal from the radio foregrounds. The electronic and processing system developed for the BAORadio project will be presented in section 3 and some preliminary results obtained during different qualification tests at Nançay and Pittsburgh will be briefly discussed in section 4.
2 3D mapping of the 21 cm emission
The statistical properties of the matter distribution in the universe or the Large Scale Structures (LSS) can be used to test the cosmological model and to determine the values of the cosmological parameters, such as the matter or dark energy densities. We can observe the cosmological matter distribution, dominated by dark matter, through tracers like galaxies in most cases. These galaxies are usually detected and observed through their optical emissions, the position being determined by imaging and the redshift by spectroscopy. A similar method can be used for galaxies and compact gas cloud in radio, through the 21 cm hyperfine transition (1.42 GHz at ) of neutral atomic hydrogen. Here, the source redshift can be directly determined by comparing the observed radio frequency to the intrinsic emission frequency (). A discussion of the cosmological applications of observation of galaxies at 21 cm can be found for example in references [12, 13].
The relatively low radio brightness of these objects limits their detection to the vicinity, in cosmological sense, of our galaxy with the current instruments (e.g. [14]). An instrument with a collecting area like the Large Nançay Radio telescope (NRT) can only detect galaxies with in 21 cm up to redshift with an integration time of few hours (). Radio detection of galaxies at 21 cm would thus need collecting areas , as envisaged for the final phases of the SKA project666http://www.ska.org.
The power spectrum of density inhomogeneities is one of the most widely used mathematical tools to quantify and analyse statistical properties of matter distribution in cosmology. If denotes matter density in the cosmos and the Fourier transform of the matter density inhomogeneity field , we have:
Assuming isotropy at large scales, the statistical properties of the matter distribution can be represented by the power spectrum .
Interested readers might refer to [15] or [16] for in depth presentation of the cosmological model, structure formation and matter power spectrum.
Baryon Acoustic Oscillations (BAO) correspond to inprints left over by the matter distribution at large scales by the acoustic (pressure) waves which were propagating in the photon-baryon plasma prior to decoupling. The BAO appear as a slight modulation ( in amplitude) of the power spectrum for . This length scale (150 Mpc) corresponds to transverse structures with an angular scale around a degree and to longitudinal structures with at , at and at . The mean brightness temperature at 21 cm and the corresponding inhomogeneities level are smaller than a milli-kelvin [17, 18]. A radio instrument with a rather modest size () should thus be able to resolve these structures. However, a high sensitivity to brightness temperature variations is required to avoid the signal to be swamped by the instrumental noise, quantified by the system temperature (). The determination of the power spectrum indeed requires to survey a large volume of the universe in order to limit fluctuations due to the limited number of measured Fourier modes (Sample Variance). One has to cover a significant fraction of the sky () and a sufficiently thick slice in redshift to maintain the sample variance under control.
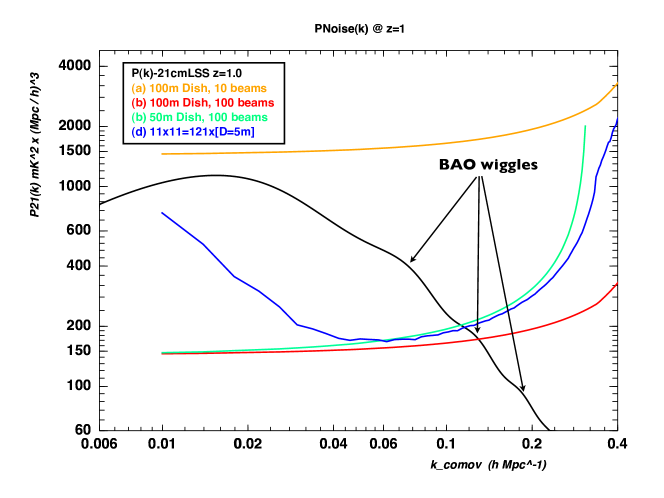
These constraints can be fulfilled by a wide band () radio instrument with a large instantaneous field of view (20-100 ), which will provide three dimensional (2 angles and frequency) maps of the 21 cm brightness temperature with angular resolution and frequency resolution. These maps could then be used to determine the atomic hydrogen spatial power spectrum. Figure 1 shows the contribution of instrumental noise for various instrument configurations for a radio survey covering a quarter of the sky (10000 deg2) over one year. The power spectrum of the expected spatial variations of the 21 cm brightness temperature is shown, as well as the BAO wiggles[18].
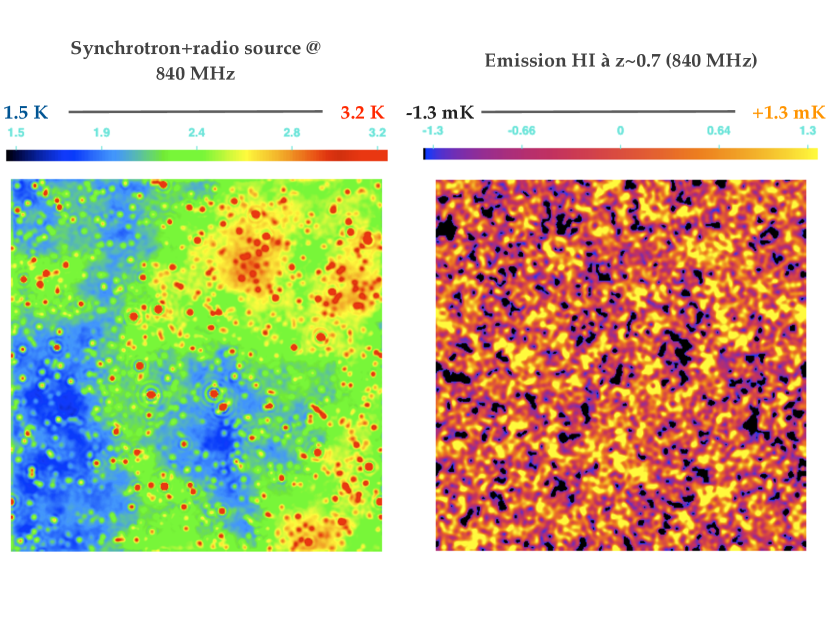
The level of instrumental noise is not the only experimental challenge of the Intensity Mapping method. Indeed, the radio foregrounds due to the synchrotron emission of the Milky Way and the continuum emission of compact radio sources are a thousand times brighter than the emission. Figure 2 provides a simulated map showing the expected level of variations of the 21 cm emission of neutral atomic hydrogen at , compared to the Galactic synchrotron and radio source temperature, for one of the coldest regions of the sky. To fight against this overwhelming sky emission level, several authors have suggested to use the spectral power law behaviour of the synchrotron emission to separate the cosmological signal from the foreground and background radio contamination. Encouraging results have been obtained with preliminary studies using such a method for component separation, based on simulations [18].
3 BAORadio electronic pipeline
End of 2006, following J.Peterson and U-L Pen proposal for a 21 cm intensity mapping survey for dark energy, LAL & Irfu initiated an ambitious R&D effort for the development of an electronic system suitable for interferometric radio surveys in UHF/L bands. Our engineering team has designed and built a complete analog and digital electronic system for acquisition and processing of radio signals.
The striking feature of the system resides in its nearly fully digital design, the use of FPGA based, application oriented custom designed boards, to obtain large bandwidth digital processing, while keeping low power consumption. In addition, the system has been designed to be scalable to large number of channels (few hundreds to thousands analog channels), and distributable over a large area (few hundred meters). Other digital system, with similar features for radio astronomy [19], have been developed, or are under development: CASPER/ROACH at Berkeley [20] and Uniboard in Europe [21].
Analog signals are digitized at 500 Msample/s, providing a 250 MHz total instantaneous bandwidth in the current system version. The digital data flow is then processed through the different stages, either by firmware in FPGA’s or by software in the acquisition computer cluster. The system has been mainly designed and developed during the three years 2007-2009. In addition to measurements using test bench in the laboratory, the system has undergone extensive qualification tests at Nançay using the large radio telescope (NRT), or with the cylindrical reflector prototypes at Pittsburgh. The system is composed of several components which are briefly described below. A more technical description of the system and its performance can be found in [22].
-
1.
The analog modules AEM perform two main functions : amplification, filtering of the RF signal, and frequency down conversion to intermediate frequency (IF). The current boards have filters designed to mix the 1250-1500 MHz band down to 0-250 MHz, with the local oscillator at 1250 MHz.
-
2.
The clock and control signal distribution DCLK is a crucial subsystem. DCLK is designed to transfer a master clock from a central facility to slave clock and control signal synthetizer boards. These secondary boards, located close to the reflectors, distribute the master clock to the analog modules and the sampling (digitizer) boards. This is a key component for building a large digital interferometer.
-
3.
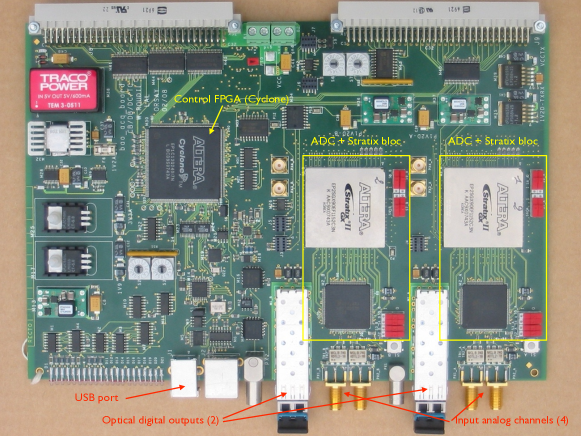
The DIGFFT sampling board features 4 analog inputs which are sampled at 500 Msample/s with 8 bits dynamic range. The board is equipped with powerful digital circuits (FPGA) capable of processing on the fly the digital stream to separate the signal into frequency components, through an FFT like digital filter in firmware. The data are transmitted through two high speed (5 Gbits/s) optical fibers to the acquisition computers, or to a dedicated beam-former, located in a central building. These boards are equipped with USB and VME interfaces used to configure the circuits and for slow control. We have developed a set of firmwares for the DIGFFT boards: the RAW firmware samples and transfers over optical fibers the corresponding raw data with a maximum of 48 kSample per digitization frame; the FFT firmware performs sampling, Fourier transform and transfer of the Fourier coefficients (2 bytes, real/imaginary). The FFT is performed on 8 kSample data chunks per channel, yielding a frequency resolution of 61 kHz. The 8 bit dynamic range of the RAW data and truncated FFT coefficients should give enough dynamic range to identify and clean RFI (Radio Frequency Interference) due to terrestrial radio sources.
-
4.
A set of PCI-Express optical data receivers PDR modules receive the data from the optical stream and transfer it to the acquisition system memory. We have developed the firmware for the PDR boards, as well as the acquisition software which uses the Jungo 64 bit low level PCI-Express driver. Data is exchanged between DIGFFT and PDR boards, as well as between different computing nodes in a cluster embedded in a light weight container, the BRPacket. The use of this container ensures the control of time synchronization throughout the system and the different stages of processing thanks to an hardware 125 MHz clock time tag encoded in BRPacket.
-
5.
We have also developed the control and data acquisition software which run on a cluster of Linux-PC’s. The control software uses the USB to configure DIGFFT boards and the serial RS232 interface for DCLK. The acquisition system is capable of sustained acquisition rates of several hundreds megabytes/second (MB/s) per PCI-Express receiver board. The software is object oriented, in C++ and multi-threaded. Its design ensures flexibility and very high efficiency. Data can be received through PCI-Express boards, or exchanged through the network interfaces. The software components can be assembled to perform several types of on the fly processing , distributed over the cluster computing nodes, taking advantage of the multi-cpu/multi-core processing power thanks to the multi-threaded software architecture. In particular, the acquisition program can be configured as a high throughput software correlator which computes all pair wise visibilities for interferometric observations.
-
6.
A prototype for an FPGA based digital correlator / beam former is also being developed. FFT data from the DIGFFT boards is sent directly to the beam former board. First tests of this beam former prototype should take place with the FAN prototype in Nançay in the next few months.
4 System qualification and performance
The different subsystems have been tested using test benches in the laboratory, and the complete system has been qualified using the Nançay radio telescope (NRT). It has been used in interferometric mode on the CRT (Cylindrical Radio Telescope) prototype at CMU in Pittsburgh [10]. The interferometric mode operation associated with the software correlator is also currently in use for beam forming with the FAN prototype. Major milestones for the system tests and qualification are listed here:
-
—
July 2008 : first test of a complete analog+digital electronic pipeline and the acquisition system with the NRT
-
—
November 2009 : Observation campaign using the CRT prototype at Pittsburgh, with 16 channels and the FFT firmware. Visibilities were then computed offline, from FFT data saved to disk.
-
—
November 2010 : Observation campaign using the CRT prototype at Pittsburgh, 32 channels, FFT on FPGA and software correlator.
-
—
2011 : Observation and beam forming tests with the FAN prototype at Nançay, with 12 digitization channels; use of the BAORadio electronic system for the -cluster program with NRT.
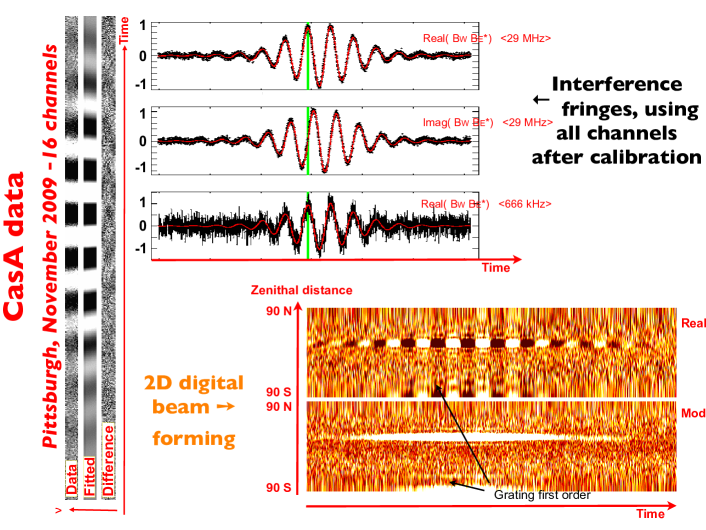
The CRT prototype at Pittsburgh is made of two cylindrical reflectors, each 25 meter long and 10 meter wide, equipped with half wavelength dipole receivers along the focal line. The cylinder axis are oriented north-south and they are 25 meters apart. A small section of the two cylinders, corresponding to 8 receivers along each cylinder, have been equipped with the BAORadio electronic system in November 2009. We have observed several bright radio source transits (Cassiopeia A, Cygnus A, Sun). Fourier coefficient data computed by the FFT-firmware on the DIGFFT boards have been saved to disk by the acquisition system. The 2009 observation campaign with the CRT at Pittsburgh enabled us to test the correct system operation, stability and time synchronization in interferometric mode, with several digitization streams (16 channels, 4 DIGFFT boards). We have also used these data to develop and debug the software correlator which has been subsequently used in Pittsburgh in 2010, and is being used for FAN beam forming. We have also developed software for RFI cleaning, relative gain and phase calibration and digital beam forming using the computed visibility data. Figure 4 shows examples of the results obtained after cleaning, calibrating and processing the November 2009 Pittsburgh data. The interference fringes between the two cylinders, using all 16 receivers (8/cylinder), after gain and phase alignment are visible in the top part with very high signal to noise ratio, while the lower map shows the two dimensional, digitally synthesized beam from the Cassiopeia A transit.
The BAORadio system is currently used at Nançay for the program, which aims at the detection of the hydrogen gas in nearby clusters () Abell 85, Abell 168, Abell 1225, Abell2440. Since end of 2010, two orthogonal polarizations of the NRT cryogenic receiver are instrumented with the complete electronic chain described in section 3, in parallel with the standard readout system. Observations have been carried out nearly routinely over the last few months, and we have accumulated about 50 TeraBytes of data, corresponding to 50 hours observations, which are stored at the IN2P3 Computing facility in Lyon. The data analysis is under way, with the primary task being the data cleaning for RFI removal.
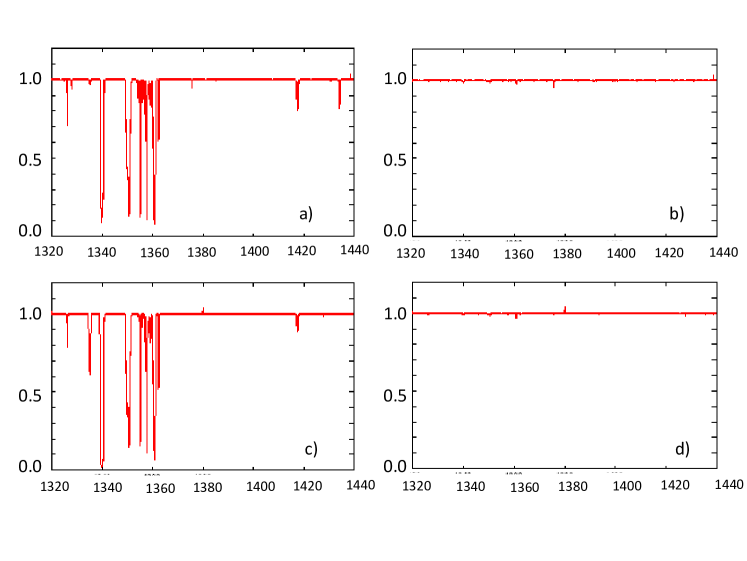
Each analog signal, corresponding to one of the two NRT polarizations, is sampled at 500 Msample/s, with 32 (16384 samples) digitization framelength, at a rate of 10000 frame/s. The data flow dumped to disk represents more than 300 MByte/s (about one TByte/hour) for the two channels, and corresponds to on sky efficiency. After offline Fourier transform (FFT), we obtain spectra with 30.5 kHz frequency resolution, covering the entire frequency band every 100 (10 kHz). The time-frequency data stream is then processed through frequency and time domain statistical filtering to remove RFI over the 250 MHz wide frequency band. Figure 5 illustrates the results on RFI cleaning obtained by this data processing. It can be seen that most of the spurious signals, due to terrestrial radio signals present in the frequency band 1320-1370 MHz has been removed. Application of similar methods to the data taken with the standard NRT correlator readout system has shown that RFI cleaning performance is enhanced by orders of magnitudes thanks to the fine time sampling, combined with the frequency resolution and dynamic range of the BAORadio chain.
5 Conclusion
3D mapping of the mass distribution through 21 cm intensity mapping in radio, in the frequency range 400-1500 MHz, is a promising method for cosmological surveys of matter distribution up to redshift , and would allow one to constrain the dark energy equation of state parameters by measuring BAO scale evolution with redshift. A multi-beam wide band instrument (few hundred MHz), FPA or interferometer, with a large field of view (20-100 deg2) should be used to insure a sufficiently large sensitivity for surveying a large volume of the universe at 21 cm. The electronic system presented here has been designed to equip multi-receiver systems, with few hundred digitization channels. The analog electronic modules (AEM), and the sampling boards (DIGFFT) can be spread over an area of a few hectares. The digital signals are then transferred to a central facility through optical fibers. This central facility might use a custom build correlator/beam former, or a computer cluster with high bandwidth network. The computing nodes would be equipped with GPU or custom designed FPGA boards to handle the CPU intensive pair wise visibilities or beam forming computation. The electronic and acquisition system has been successfully extensively tested and qualified at the Nançay radio observatory, as well as in Pittsburgh.
Acknowledgements
We would like to thank the LAL and Irfu technical staff, P. Abbon, C. Beigbeder, D. Breton, T. Caceres, D. Charlet,, E. Delagnes, H. Deschamps, C. Flouzat, P. Kestener, B. Mansoux, C. Pailler, M. Taurigna, who have designed and built the electronic and acquisition system presented in this paper. We are also grateful to the Nançay station staff for their help, in particular J. Pezzani and C. Dumez-Viou for their expertise and advice during system qualification.
References
- [1] Amendola, L. & Tsujikawa, S., DARK ENERGY, Theory and Observations, Cambridge University Press (2010)
- [2] Copeland, E.J. , Sami, M. & Tsujikawa, S., Int. J. Mod. Phys. 15, 1753 (2006)
- [3] Larson, D. et al. (WMAP), ApJS , 192, 16 (2011)
- [4] Albrecht, A., Bernstein, G., Cahn, R. et al. (Dark Energy Task Force), arXiv:astro-ph/0609591 (2006)
- [5] Percival, W.J., Reid, B.A., Eisenstein, D.J. et al., MNRAS, 401, 2148-2168 (2010)
- [6] Peterson, J.B., Bandura, K., & Pen, U.-L., Moriond Conference Proceedings, arXiv:astro-ph/0606104 (2006)
- [7] Chang, T., Pen, U.-L., Peterson, J.B. & McDonald, P., Phys. Rev. Lett., 100, 091303 (2008)
- [8] Ansari, R., Le Goff, J.-M., Magneville, C., Moniez, M. , Palanque-Delabrouille, N., Rich, J., Ruhlmann-Kleider, V., & Yèche, C. , arXiv:0807.3614 (2008)
- [9] Seo, H.J. Dodelson, S., Marriner, J. et al, ApJ, 721, 164-173 (2010)
- [10] Bandura, K., Pathfinder for a Neutral Hydrogen Dark Energy Survey, PhD thesis, Carnegie-Mellon University (Department of Physics) (2011)
- [11] Martin, J.M. et al, FAN : Étude d’antennes en réseau au foyer du Radiotélescope de Nançay, C. R. Physique 13 (2012)
- [12] Abdalla, F.B. & Rawlings, S., MNRAS, 360, 27 (2005)
- [13] Science with the Square Kilometre Array, eds: C. Carilli, S. Rawlings, New Astronomy Reviews, Vol.48, Elsevier (2004)
- [14] Martin, A.M. et al., Ap.J. 723, 1359 (2010)
- [15] James Rich, Fundamentals of Cosmology, Springer (2001)
- [16] John A. Peacock, Cosmological Physics, Cambridge University Press (1999)
- [17] Barkana, R. and Loeb, A., Rep. Prog. Phys, 70, 627 (2007)
- [18] Ansari, R. et al., 21 cm observation of LSS, instrument sensitivity and foreground subtraction, submitted to A&A, arXiv:1108.1474 (2011)
- [19] Parsons, A. et al, Digital Instrumentation for the Radio Astronomy Community, arXiv:0904.1181 (2009)
-
[20]
Center for Astronomy Signal Processing and Electronics Research web site
http://casper.berkeley.edu/ -
[21]
Advanced Radio Astronomy in Europe (RadioNet) Uniboard
http://www.radionet-eu.org/uniboard - [22] Charlet, D. et al., IEEE Transactions on Nuclear Science, 58, 4, 1833 (2011)