Herschel-ATLAS/GAMA: spatial clustering of low-redshift sub-mm galaxies††thanks: Herschel is an ESA space observatory with science instruments provided by European-led Principal Investigator consortia and with important participation from NASA
Abstract
We have measured the clustering properties of low-redshift () sub-mm galaxies detected at 250 m in the Herschel-ATLAS Science Demonstration Phase (SDP) field. We selected a sample for which we have high-quality spectroscopic redshifts, obtained from reliably matching the 250-m sources to a complete (for ) sample of galaxies from the GAMA database. Both the angular and spatial clustering strength are measured for all sources as well as for five redshift slices with thickness =0.05 in the range . Our measured spatial clustering length is comparable to that of optically-selected, moderately star-forming (blue) galaxies: we find values around 5 Mpc. One of the redshift bins contains an interesting structure, at .
keywords:
far-infrared - surveys - galaxies: statistics1 Introduction
A key statistical property of a given population of galaxies is its clustering length, most often expressed as the scale-length of the galaxy-galaxy autocorrelation function. This statistic quantifies the environment of such a galaxy population, and thus helps to interpret their other properties. This paper deals with clustering of low-redshift sub-mm detected galaxies, which are expected to be relatively normal galaxies, albeit with somewhat enhanced star formation as compared to high-redshift sub-mm galaxies, which typically have much higher star formation rates and are thought to be mostly merger-induced star-bursting galaxies.
‘Normal’, local galaxies, as detected in the optical wavebands, have clustering lengths of 5–6 Mpc, depending on colour and/or luminosity (e.g. Coil et al. 2008 for the DEEP2 sample, Zehavi et al. 2011 for the SDSS DR7 sample, and Christodoulou et al. 2012 for an analysis of the SDSS DR7 sample using photometric redshifts calibrated using GAMA data). In this paper we study the clustering properties of galaxies selected at 250 m for which we also have a spectroscopic redshift (of sufficient accuracy).
For sub-mm galaxies, various clustering estimates exist, most often for samples where redshift information is sparse and only small fields are covered. Early attempts to measure the angular correlation function for high- sub-mm galaxies detected with SCUBA include Almaini et al. (2003), Webb et al. (2003), Blain et al. (2004), and Scott et al. (2006). A more recent estimate is that of Weiß et al. (2010), using LABOCA. In this paper we make use of the Science Demonstration Phase (SDP) data of Herschel-ATLAS (Eales et al. 2010), which offers a wider area than was available to the studies mentioned above, although at a shorter wavelength (and thus a lower peak redshift). The angular clustering of all reliably detected 250 m sources in this SDP field has been measured by Maddox et al. (2010). A similar measurement for a similar sample, obtained as part of the HerMES project, was presented by Cooray et al. (2010). Both these measurements have been compared to model predictions by Short & Coles (2011).
Here we study a subset of the galaxies used for the clustering analysis of Maddox et al. (2010): those with reliable spectroscopic redshifts. This allows us to study spatial clustering, although only for redshifts below about 0.3, where we have sufficient numbers of redshifts. In a related, complementary paper, Guo et al. (2011) measure the cross-correlation of a similar sample of galaxies, to study the clustering bias of this sample and the properties of their haloes.
In Section 2 we first describe our particular sample of low-redshift sub-mm sources, and how it was selected. In Section 3 we describe the methods to estimate angular and spatial clustering measures, which are then applied in Section 4 to study the clustering properties of our sample. In Section 5 we summarize our conclusions, and look forward to what we can do once the full Herschel-ATLAS data set becomes available. In this paper we adopt the following cosmological parameters where needed: = 73 km s-1 Mpc-1, =0.25, and =0.75.
2 Observational data
The observational data used come from a match of source catalogues obtained from Herschel-ATLAS (Eales et al. 2010) and GAMA (Driver et al. 2011), performed by Smith et al. (2011). In this section we described the source catalogues and selection.
2.1 Herschel-ATLAS data and SPIRE source catalogue
Our sample of low-redshift sub-mm sources is extracted from the first Herschel-ATLAS data field that was taken as part of the Science Demonstration Phase, as described in Eales et al. (2010). Herschel-ATLAS is based on parallel scan mode observations performed with Herschel (Pilbratt et al. 2010). Maps from the SPIRE (Griffin et al. 2010) data were produced using a naive mapping technique after removing instrumental temperature variations from the time-line data (Pascale et al. 2011). Noise maps were generated by using the two cross-scan measurements to estimate the noise per detector pass, and then for each pixel the noise is scaled by the square-root of the number of detector passes.
Sub-mm sources were identified in the SPIRE maps as described in Rigby et al. (2011). To produce a catalogue of reliable sources, only those that are detected at the 5- level at 250 m were selected. In calculating the value for each source, the relevant noise map was used, and the confusion noise was added to this in quadrature. The average 1- instrumental noise values are 4, 4 and 5.7 mJy beam-1 respectively in the 250, 350 and 500 m bands. The confusion noise was estimated from the difference between the variance of the maps and the expected variance due to instrumental noise: the 1- confusion noise was found to be 5, 6 and 7 mJy beam-1 at 250, 350 and 500 m, in agreement with Nguyen et al. (2010). The resulting total 5- limits are 33, 36, and 45 mJy beam-1 respectively.


2.2 Redshifts and source selection
Spectroscopic redshifts are taken from the GAMA database (Driver et al. 2009; Baldry et al. 2010; Robotham et al. 2010; Hill et al. 2011; Driver et al. 2011), which covers most of the Herschel-ATLAS SDP field, except for a fraction below declination . These redshifts come from a variety of sources, although most were taken by the GAMA team using 2dF+AAOmega at the AAT (Driver et al. 2009).
The overlapping area contains 5370 sources for which the SPIRE 250 m flux is above 5 (corresponding to 33 mJy). In order to assign spectroscopic redshifts from GAMA, which has the SDSS sample as input catalogue, to as many of these sources as possible, Smith et al. (2011) matched the SPIRE sources to the SDSS DR7 sample (Abazajian et al. 2009), using a likelihood-ratio analysis (Sutherland & Saunders 1992). All SDSS sources within a 10 arcsec radius of each SPIRE source were considered, taking into account that the true counterpart could be below the optical magnitude limit. In this process, Smith et al. (2011) also calculated a reliability for any given source to be the correct counterpart, and we follow their recommendation to only use sources with .
Besides cutting at reliability , we also select GAMA sources with redshifts of sufficient quality (3, see Driver et al. 2011 for a detailed definition of the redshift quality parameter ), and with , which is the Petrosian magnitude cut for which GAMA was designed to be complete in redshift coverage; GAMA has almost achieved that ( completeness for this cut).
We have tried supplementing these redshifts with (available) photometric redshifts from Smith et al. (2011), selecting only those that have uncertainties , which is equal to the size of the redshift bins we chose for our redshift slices (see section 4.1.2). These redshifts are mostly in the range , but we found that their number is too few to give a reliable clustering estimate in this range. Also, the additional complexity of taking into account the relatively large redshift errors result in clustering detections that are marginal at best. We therefore chose not to use photometric redshifts for this study.
Summarizing, we selected low-redshift sub-mm galaxies which:
-
•
are above 5 at 250 m (a flux cut of 33 mJy);
-
•
are in the GAMA 9h field;
-
•
have source ID reliability ;
-
•
have spectroscopic redshift quality
-
•
have ;
-
•
have .
The sample thus constructed, with flux limits in both optical and sub-mm bands, leads to a somewhat specialized selection. In particular at the faint end we select galaxies that are either red, dusty, or both. For our spectroscopic redshifts we are restricted to galaxies, but we do have photometric redshifts for many galaxies beyond that (Smith et al. 2011). This allows us to estimate the minimum fraction of low-redshift sub-mm galaxies missed in our analysis (i.e. those with but with a low photometric redshift) for each of the redshift slices considered. For the Herschel-ATLAS Phase 1 dataset, which is much larger than the SDP dataset considered here, photometric redshift have recently been estimated (Pearson et al. 2012) for galaxies down to , giving sufficient depth and width to give a reasonable incompleteness estimate for our low-redshift sub-mm samples, even though this is a lower limit (there will still be low-redshift sub-mm galaxies with , although we do not expect this fraction to be large).
Performing this analysis for the G09 Phase 1 field, we find an minimum incompleteness fraction of 14 per cent for , where this fraction is very low at the lowest redshift end, and around 40 per cent near . These and additional fractions are given and discussed in the relevant sections below.
The top panel of Fig. 1 shows all SPIRE sources within the GAMA field (using just the first two criteria that are listed above), most of which are not actually identified in the GAMA source catalogue. Those that are identified as GAMA sources, have , , and are sufficiently reliable matches with good quality redshifts ( and ), are shown in the bottom panel of Fig. 1. Both panels were rotated by 25∘ to take into account the orientation of the Herschel SDP field. The corner region below is the area that is not part of the GAMA survey, and therefore disregarded for the purpose of this paper.
The redshift distribution of the sources with GAMA redshifts is shown in Fig. 2 (all criteria except the last have been applied). Beyond the number of spectroscopic redshifts (thin histogram in Fig. 2) quickly decreases, so we restrict ourselves to in this paper.
For the purpose of estimating the spatial clustering length through the Limber equation inversion method (which involves numerical solutions), we fit the redshift distribution to a function of the form . The best fit to our observed distribution is for and (shown as a smooth solid line in Fig. 2).

Figure 2: Redshift distribution of our sample of 250-m sources above 33 mJy, with the reliability, redshift quality, and Petrosian -band cuts applied (see main text for details). The smooth solid line is a fit to the distribution of all selected redshifts: . Slice minimum incompleteness [arcmin] [Mpc] all 5363 - 0.006 0.008 0.51 0.09 - 724 14% 0.28 0.33 1.10 0.39 6.34 5.44 123 1.1% 1.09 0.97 0.80 0.29 3.23 2.19 137 2.3% 2.45 1.20 0.62 0.15 4.47 1.72 167 7% 2.13 0.62 0.95 0.19 7.20 1.81 136 20% 0.59 0.66 0.58 0.19 3.02 2.50 145 39% 0.66 0.86 1.05 0.83 5.13 5.50 Table 1: Clustering measures for all samples considered (see main text for details) for the two-parameter fits. An estimate for for the ‘all z’ sample has not been given as its redshift distribution is unknown. 3 Methods
3.1 Estimating the angular correlation function
The standard estimator for measuring angular correlations is (Landy & Szalay 1993), where , and are the (normalized) galaxy-galaxy, galaxy-random and random-random pair counts at separation . We employ a more abundant random catalogue (by a factor of ten) that Poisson samples the same survey region as our observed catalogue. The normalization takes out the overabundance of the random catalogue by scaling the and counts accordingly. For the estimate of and its errors we use the Jackknife technique (e.g. Wall & Jenkins 2003, Norberg et al. 2009), employing regions and estimating errors from the Jackknife sampling variance.
The estimator is to be fitted by its expected value
, where the ‘integral constraint’ is the integral of the model for the two-point correlation function over the survey area. We consider a two-parameter fit for the generic power-law , as well as a single parameter fit for with constant slope . Van Kampen et al. (2005) give details on the fitting technique, which employs non-linear -fitting using the Levenberg-Marquardt method (Press et al. 1988). This allows us to easily take into account the integral constraint, but also produces the covariance matrix of the fitted parameters which provides a good estimate of their uncertainties.For small samples, the estimates depend somewhat on the way the data is binned. For this reason we have used a range of bin sizes and intervals over which we bin the angular separations, and adopt the one that produces the smallest fractional uncertainties in the jackknife estimates. Furthermore, there is some evidence of a feature in the angular correlation function near the filter scale of 2 arcmin used in the source detection, so we excluded the corresponding bin from the fit. This was only found to be important for the full sample (as demonstrated by the fourth datapoint in Figure 3): no difference was seen for the subsamples introduced in Section 4.2.

Figure 3: Angular correlation functions for all 250 m galaxies in the SDP field (i.e. the sample shown in the top panel of Fig. 1). The solid line shows the two-parameter fit, where the fitted parameter values can be found in the top row of Table 1. Open symbols represent negative values for the estimated correlation function. Errors are obtained using the jackknife technique (see main text for details). 3.2 Spatial correlation length from
The traditional method (e.g. Peebles 1980) for estimating the spatial clustering length is to measure the angular correlation function and the redshift distribution, and then use Limber’s equation (Limber 1953) to derive . We employ the code used by Farrah et al. (2006), assuming a smooth redshift distribution of the form that is fitted to the observed redshift distribution.
Because our analysis is limited to low redshift (), the precise choice for the assumed evolution of the the correlation function does not matter too much: assuming ‘stable clustering’ (fixed in physical coordinates) of ‘comoving clustering’ (fixed in comoving coordinates) does not change the results much for (most terms scale with ), especially because we primarily consider redshift slices of thickness .
4 Results
4.1 Angular clustering without redshift information
We first look at the angular correlation function of all sub-mm galaxies detected by SPIRE at the 5 level, i.e. the sample shown in the top panel of Fig. 1. Most of these galaxies do not have measured redshifts, but because of the strong negative K-correction at these wavebands we expect a wide range of redshifts (see also Amblard et al. 2010).
The resulting angular correlation function, along with a two-parameter power-law fit, is shown in Fig. 3, and displays very little clustering, as was already shown by Maddox et al. (2010) for the slightly larger full SDP dataset (that is, including the small region that is not part of the GAMA area). This should just be seen as a confirmation of the earlier results, and is included here to demonstrate consistency.


Figure 4a: Angular correlation functions for (top left panel) and for each redshift slice, with two-parameter fits shown. The values of the fitted parameters are listed in Table 1. Open symbols represent negative values for the estimated correlation function. Errors are obtained using the jackknife technique (see main text for details). 


Figure 4b: Angular correlation functions for (top left panel) and for each redshift slice, with one-parameter fits shown. The values of the fitted parameters are listed in Table 2. Open symbols represent negative values for the estimated correlation function. Errors are obtained using the jackknife technique (see main text for details). Please note that the data points are not the same as in Fig. 4a, as the integral constraint is a function of the fitting parameters but also used to correct the data points (see main text for details). Slice [arcmin] [Mpc] all 5363 0.04 0.02 - 724 0.20 0.04 5.62 1.14 123 1.14 0.38 3.29 1.10 137 1.99 0.51 5.23 1.33 167 1.78 0.31 5.68 1.00 136 1.20 0.30 5.21 1.31 145 1.13 0.26 5.42 1.26 Table 2: Clustering measures for all samples considered (see main text for details) for the one-parameter fits (fixed slope: ). An estimate for for the ‘all z’ sample has not been given as its redshift distribution is unknown. 4.2 Angular clustering in redshift slices
As redshift information is only reasonably complete for , we now restrict ourselves to these low redshifts. We first consider the whole range , which is the sample for which the spatial distribution on the sky is shown in the bottom panel of Fig. 1. The SDP field is rotated by 25∘, so our and coordinates represent a rotated coordinate system with respect to the usual RA and Dec axes.
The angular clustering estimate for these 724 sources is shown in the top left panel of Fig. 4a, along with the two-parameter fit to this estimate. We see that the angular clustering signal is fairly low for the two-parameter fit, with a large uncertainty on the clustering amplitude (see Table 1): the dilution of any intrinsic clustering signal due to the long line-of-sight (of order 30 times the width of the lightcone) is apparently too severe. If we fix the slope at (as shown in Fig. 4b), we find a more significant one-parameter fit for the amplitude, although the uncertainty is still considerable.
To remove some of the dilution of the clustering signal due to projection along the line-of-sight, we cut the lightcone in redshift slices. Given the measured redshift distribution, as shown in Fig. 2, we selected redshift slices such that these are as thin as possible but still contain a sufficient number of sources for a reliable clustering estimate. We start at , where the redshift distribution starts to pick up, and end at , as the redshift distribution drops sharply there. Our clustering estimator works well for over a hundred sources, which allows for a redshift interval of for the present sample (for the full Herschel-ATLAS data set we should be able to adopt thinner slices). This gives us five redshift slices in all.
The resulting angular clustering estimates are shown in Fig. 4a, for the two-parameter fits, and in Fig. 4b for the one-parameter fits. Please note that the integral constraint (see Section 3.1) is a function of amplitude and slope , but is also used to correct the data points. This results in somewhat different data points in Figs. 4a and 4b (best seen at the larger angles), as the fitted values for and for the two-parameter fit will be different from the fitted value for and the choice for the one-parameter fit.
The fitting parameters corresponding to the estimates shown in Figs. 4a and 4b are listed in Tables 1 and 2, for the two- and one-parameter fits, respectively, where is the number of sources in each slice. The spatial clustering length , as listed in the last column of each table, is discussed in the following section.
For the one-parameter fit a fixed slope with was adopted, as found for local, optically selected galaxies. This value is also consistent with all fitted slopes found from the two-parameter fit, taking the uncertainties into account. It might therefore be argued that adopting a fixed slope is a good approximation and helps to produce a tighter constraint on the clustering amplitude. Still, for both the two- and one-parameter models we obtain a good fit for each of the redshift slices, even though the angular correlation function measure itself can be noisy for some of the redshift slices. The best determinations are for the bins around the peak of the redshift distribution, where we find the most significant values for the fitting parameters. The slope is in all cases consistent with that for normal galaxies, i.e. around , even though uncertainties can be considerable, and certainly for the higher redshift bins is somewhat self-induced due to the optical selection (see Section 2.2) and the choice for the fixed slope in the case of the one-parameter fits. This is discussed further in Section 5.
4.3 Spatial clustering
In order to use the Limber equation inversion to estimate the spatial clustering strength we need to use the redshift distribution, as shown in Fig. 2. Because of the relatively small field of view, this distribution shows quite a bit of variance. To ensure that the necessary numerical integrations are well behaved, we fit a continuous function of the form to the observed redshift distribution, which is shown in Fig. 2 as a smooth solid line. For the fitting parameters we found and . The redshift distribution for all sources is unknown at this point, so we do not estimate a spatial clustering length for the full sample (first row in Table 1).
We then compute the spatial correlation length for each redshift slice using the Limber equation inversion technique (see section 3.2), for both the two- and one-parameter fits, assuming comoving clustering (if we assume stable clustering we obtain values for which are roughly 10 per cent larger). For the spectroscopic redshifts we need not worry much about the redshift errors, as these are much smaller than the thickness of the slices (i.e. ).
The resulting values for are listed in Tables 1 and 2, respectively, in units of Mpc. As the resulting value is sensitive to the slope of the angular correlation function, we obtain different results for the two- and one-parameter fits when the fitted slope (for the two-parameter fit) is different from 0.8. Because of the significant uncertainties in the estimates of the clustering lengths, it is premature to study the evolution of clustering with this data set. What is interesting is that the slices are sufficiently thin to clearly detect clustering, which is not the case for the larger redshift range . Once the whole area of Herschel-ATLAS is covered, we should be able to reduce uncertainties to such a level where we can systematically study clustering trends with redshift.
4.4 A structure at =0.164

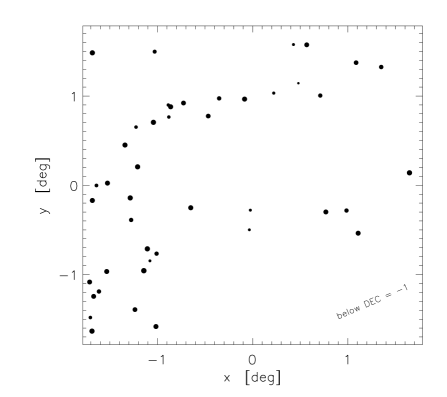

Figure 5: A structure at z=0.164. The top panel shows a zoom-in on the redshift distribution around the spike that is prominently visible in Fig. 2. Sub-mm sources in the redshift slice , with all other selection criteria applied (see Section 2.2), are shown in the middle panel. For clarity, symbol sizes are three times larger than for Fig. 1. The bottom panel displays all GAMA galaxies with redshifts in the same slice. 
Figure 6: The z=0.164 structure along the line-of-sight seen in GAMA for all galaxies with redshifts and . The ‘y’ coordinate is the same as used in Figs. 1 and 5, i.e. one of the coordinates of the SDP field that is rotated by 25 degrees with respect to RA and Dec. The redshift distribution of our selected source population, as shown in Fig. 2, displays a fairly pronounced peak near . If we zoom in on the redshift distribution around this peak, as plotted in Fig. 5 (top panel), we see that the peak is split in two, with the largest part centred around . Plotting the distribution of the corresponding sources (Fig. 5, bottom panel) around this redshift, in the interval , we see an clear structure appearing. The thickness of this redshift slice is around 15 Mpc, whereas at this redshift the field-of-view is around 34 Mpc, so we are likely seeing filamentary structure mostly aligned with the plane of the sky.
Maddox et al. (2010), who performed the first angular clustering analysis of this field, pointed out that there are patchy wisps of cirrus that plague the SDP field. However, this does not seem to align with the ‘filamentary structure’ shown in Fig. 5. Comparing to the distribution of galaxies selected in the optical, that is, all GAMA galaxies with redshifts and (bottom panel of Fig. 5), we see a similar filamentary structure, tracing the low-redshift sub-mm galaxy distribution fairly well, but also displaying several distinct galaxy groups which are absent in the low-redshift sub-mm galaxy distribution. In Fig. 6 we plot this same population of GAMA galaxies along the line of sight, which clearly shows the overdensity of galaxies at to be produced by several groups and filaments roughly perpendicular to the line-of-sight. The structure might be responsible for the somewhat larger clustering length seen in the redshift bin (see Figure 4 and Tables 1 and 2), although the excess is marginally significant.
5 Conclusions
We selected a sample of 250-m sources, detected at the 5 level, from the Herschel-ATLAS SDP data, and used the cross-match with the GAMA catalogue to assign redshifts to as many of these sources as possible, taking care to only use reliable IDs and spectroscopic redshifts of sufficient quality, and exploiting the near completeness of the GAMA spectroscopic redshifts for . Because the redshift distribution drops off fairly quickly beyond , we restricted our analysis to .
Simply taking all 250-m sources and ignoring any redshift information reproduces the result of Maddox et al. (2010) for the same data set: no clear clustering signal for these 5000 sources. Taking just the 910 galaxies at that satisfy our selection criteria, we do detect clustering. When we subdivide these galaxies into redshift slices of thickness we detect a significant clustering signal for most of the slices. Clearly the dilution of the clustering signal along the line of sight is too strong for the relatively small area we have covered for the SDP data, but the results for the slices show that for the full area of Herschel-ATLAS we should be able to cleanly detect a clustering signal, and study how this evolves with redshift.
In a related paper, Guo et al. (2011) measured the cross-correlation function of the Herschel-ATLAS SDP and GAMA sources, but also their autocorrelation functions. They used a different method, but for a similar sample. Their estimate for the spatial clustering length of Mpc, obtained for a redshift distribution peaking at , is consistent with our measures for the (thinner) redshift slices in the same range (both for the two- and one-parameter fits). Even though our clustering lengths are somewhat larger in most of our bins, the uncertainties are too large to establish whether there is a significant discrepancy between our results: we will need the full area of Herschel-ATLAS to test this.
Our estimates for the five redshift slices (in the range ) give a mean spatial clustering length of Mpc for the two-parameter fits, and Mpc for the one-parameter fits (the smaller error is due to the assumption for the slope of the correlation function). These values are very close to what is found for optically selected galaxies in the SDSS: Zedavi et al. (2011) found spatial clustering lengths between roughly 4 and 10 Mpc, depending on the absolute luminosity threshold adopted, with increasing for increasingly brighter thresholds. Most of their subsamples have in the range 5–6 Mpc. For our special selection criteria we have a distribution over optical luminosities that is not sharply cut-off, so a straightforward comparison cannot be made, although our spatial clustering lengths are in the same range. From this point of view, our 250-m selected galaxies do not appear to be very different from optically selected galaxies, edging towards blue galaxies (e.g. Coil et al. 2008, Zehavi et al. 2011, Christodoulou 2012), which would indicate that our sample consists mostly of moderately star-forming galaxies. We will investigate this in more detail for the full Herschel-ATLAS sample.
One caveat in the comparison to optically-selected galaxies is that our samples are not complete in the sub-mm band due to the optical limit , which means that we miss low-redshift galaxies with that are still bright enough in the sub-mm to be included in our sample. In Section 2.2 we introduced and estimated the minimum fraction missed for each of our subsamples (listed in Table 1). This is a minimum fraction as the photometric redshifts used in this estimate go deeper (to ) but still do not include all possible sub-mm galaxies. For the lowest redshift slices this fraction is small, so the conclusion that sub-mm galaxies in that redshift range cluster like optical galaxies is fairly robust. However, for the highest redshift slice () the incompleteness is at least 39 per cent, and the optical selection starts to become fairly dominant, making the comparison to a fully optically-selected sample somewhat self-induced.
A more general caveat is that any incompleteness in the sample could bias the clustering estimate if any of our (sub)samples is not fair, i.e. not a good representation of the sub-mm (sub)sample that would include all sources as well. As the incompleteness at low redshifts is minor, for the lowest redshift redshift slices this is not a worry, but for the higher redshift slices the samples are relatively incomplete and might be biased. This will have to be investigated further using the Phase 1 dataset, where we will also use other methods to estimate the spatial clustering length.
Finally, we found an interesting structure in the redshift cone, at , which is a likely filamentary structure roughly aligned with the plane of the sky. It is also seen to have several galaxy groups in the optical waveband which are absent in the sample we selected for the clustering analysis. The sources in these groups will provide excellent targets for follow-up studies with instruments such as ALMA that have much higher spatial resolution than SPIRE.
Acknowledgements
The Herschel-ATLAS is a project with Herschel, which is an ESA space observatory with science instruments provided by European-led Principal Investigator consortia and with important participation from NASA. The H-ATLAS website is http://www.h-atlas.org/. GAMA is a joint European-Australasian project based around a spectroscopic campaign using the Anglo-Australian Telescope. The GAMA input catalogue is based on data taken from the Sloan Digital Sky Survey and the UKIRT Infrared Deep Sky Survey. Complementary imaging of the GAMA regions is being obtained by a number of independent survey programs including GALEX MIS, VST KIDS, VISTA VIKING, WISE, Herschel-ATLAS, GMRT and ASKAP, providing UV to radio coverage. GAMA is funded by the STFC (UK), the ARC (Australia), the AAO, and the participating institutions. The GAMA website is: http://www.gama-survey.org/. This research was supported in part by the Austrian Science Foundation FWF under grants P18493 and I164, and received financial contribution from the agreement ASI-INAF I/009/10/0. Thanks to Duncan Farrah for making his Limber equation inversion code available.
References
- [2009] Abazajian K.N., et al., 2009, ApJS, 182, 543
- [2003] Almaini O., Scott S.E., Dunlop J.S., Manners J.C., Willott C.J., Lawrence A., Ivison R.J., Johnson O., Blain A.W., Peacock J.A., Oliver S.J., Fox M.J., Mann R.G., Pérez-Fournon I., Gonzákez-Solares E., Rowan-Robinson M., Serjeant S., Cabrera-Guerra F., Hughes D.H., 2003, MNRAS, 338, 308
- [2010] Amblard A., et al., 2010, A&A, 518, L9
- [2010] Baldry I.K., et al., 2010, MNRAS, 404, 86
- [2004] Blain A.W., Chapman S.C., Smail I., Ivison R., 2004, ApJ, 611, 725
- [2012] Christodoulou L., et al., 2012, MNRAS, in press (arXic 1206.0943)
- [2008] Coil A.L., et al., 2008, ApJ, 672, 153
- [2009] Driver S.P., et al., 2009, Astronomy & Geophysics, 50, 5.12
- [2011] Driver S.P., et al., 2011, MNRAS, 413, 971
- [2010] Eales S., et al., 2010, PASP, 122, 499
- [2006] Farrah D., et al., 2006, ApJ, 641, L17
- [2010] Griffin M., et al., 2010, A&A, 518, L3
- [2011] Guo Q., et al., 2011, MNRAS, 412, 2277
- [2011] Hill D.T., et al., 2011, MNRAS, 412, 765
- [2010] Ibar E., 2010, MNRAS, 409, 38
- [] Landy S.D., Szalay A.S., 1993, ApJ, 412, 64
- [] Limber D.N., 1953, ApJ, 117, 134
- [] Maddox S.J., et al., 2010, A&A, 518, L11
- [] Nguyen H.T., et al., 2010, A&A, 518, L5
- [] Norberg P., Baugh C.M., Gaztañaga E., Croton D.J., 2009, MNRAS, 396, 19
- [2010] Pascale E., et al, 2011, MNRAS, 415, 911
- [2012] Pearson E.A., et al., 2012, submitted to MNRAS
- [1980] Peebles P.J.E., 1980, The large-scale structure of the Universe, Princeton University Press, ch. 50.
- [2010] Pilbratt G.L., et al., 2010, A&A, 518, L1
- [1988] Press W.H., Flannery B.P., Teukolsky S.A., Vetterling W.T., 1988, Numerical Recipes: The Art of Scientific Computing. Cambridge University Press, Cambridge.
- [2011] Rigby E.E., et al., MNRAS, 415, 2336
- [2010] Robothan A.S.G., et al, 2010, PASA, 27, 76
- [2006] Scott S.E., Dunlop J.S., Serjeant S., 2006, MNRAS, 370, 1057
- [2011] Short J., Coles P., 2011, MNRAS, 412, L93
- [2010] Smith D.J.B., et al., 2011, MNRAS, 416, 857
- [1992] Sutherland W., Saunders W., 1992, MNRAS, 259 413
- [2005] van Kampen E., et al., 2005, MNRAS, 359, 469
- [2003] Wall J.V., Jenkins C.R., 2003, Practical Statistics for Astronomers, Cambridge University Press
- [2003] Webb T. M., Eales S.A., Lilly S.J., Clements D.L., Dunne L., Gear W.K., Ivison R.J., Flores H., Yun M., 2003, ApJ, 587, 41
- [2010] Weiß A., et al., 2010, ApJ, 707, 1201
- [2011] Zehavi I., Zheng Z., Weinberg D. H., Blanton M. R., Bahcall N. A., Berlind A. A., Brinkmann J., Frieman J. A., Gunn J. E., Lupton R. H., Nichol R. C., Percival W. J., Schneider D. P., Skibba R. A., Strauss M. A., Tegmark M., York D. G., 2011, ApJ, 736, 59