Pseusogap in cuprates by Electronic Raman scattering
Abstract
We present Raman experiments on underdoped and overdoped (Bi-2212) single crystals. We reveal the pseudogap in the electronic Raman spectra in the and geometries. In these geometries we probe respectively, the antinodal (AN) and nodal (N) regions corresponding to the principal axes and the diagonal of the Brillouin zone. The pseudogap appears in underdoped regime and manifests itself in the spectra by a strong depletion of the low energy electronic continuum as the temperature decreases. We define a temperature below which the depletion appears and the pseudogap energy, the energy at which the depeletion closes.
The pseudogap is also present in the spectra but the depletion opens at higher energy than in the spectra. We observe the creation of new electronic states inside the depletion as we enter the superconducting phase. This leads us to conclude (as proposed by S. Sakai et al. [1]) that the pseudogap has a different structure than the superconducting gap and competes with it. We show that the nodal quasiparticle dynamic is very robust and almost insensitive to the pseudogap phase contrary to the antinodal quasiparticle dynamic. We finally reveal, in contrast to what it is usually admitted,an increase of the nodal quasiparticle spectral weight with underdoping. We interpret this result as the consequence of a possible Fermi surface disturbances in the doping range .
1 Introduction
The pseudogap phase has been first revealed by nuclear magnetic resonance (NMR) [2, 3] and then it has been extensively studied by transport [4, 5, 6, 7, 8], angle resolved photoemission (ARPES) [9], optics [10, 11, 12] and scanning tunneling spectroscopy (STS) [13]. In comparison, Raman scattering investigations of the pseudogap remain relatively scarce. One reason is that the pseudogap was first detected in the geometry (nodal region) [14, 15, 16] which introduced confusion with respect to ARPES data where the pseudogap sets in the antinodal region.
In fact, Electronic Raman scattering investigations in the normal state have also revealed signatures of the pseudogap in geometry (antinodal region) [17, 18] however its effect has not been clearly quantified and well understood. For example the doping evolution of the pseudogap energy has not been studied in details and the doping level where the pseudogap disappears has not been determined.
Here, we present Raman experiments on underdoped and overdoped (Bi-2212) single crystals. In geometry the pseudogap manifests itself by a strong depletion in the low energy Raman response function which develops as the temperature decreases. The pseudogap effect in geometry is more subtle. We detect a depletion in the Raman response function but at finite energy. At low energy the Raman response function exhibits a linear slope which increases with cooling as expected for a conventional metal [15]. Interestingly, we reveal that supplementary electronic states are created inside the energy range of the depletion as we enter in the superconducting state. We interpret our experimental findings as the unforseen wave anisotropic character of the pseudogap. This leads us to conclude that the pseudogap and the superconducting gap have different symmetries and most likely compete with each other [1].
Finally we focus on the low energy Raman responses and extract the ratio where is the static scattering rate and , the renormalized quasiparticle spectral weight [19].
In the antinodal region, is temperature independent inside the pseudogap phase while it increases with temperature outside the pseudogap phase as expected for a metallic-like behavior for which the scattering rate has to increase with temperature.
In contrast in the nodal region exhibits a metallic-like temperature dependence both inside and outside the pseudogap phase. The equation of depends both on and which are difficult to disentangle in a first approach. However, a simple modeling of the Raman response function in Drude like conductivity allows us to follow separately the doping and temperature dependences of these two physical quantities in both the nodal and antinodal regions. We show that exhibits an unexpected increase with underdoping while decreases. Simultaneously the static scattering rate strongly increases while the exhibits only small changes. We interpret this result as a consequence of a Fermi surface disturbances between and in which well defined quasiparticles are preserved and even enhanced in the nodal region while they are destroyed in the antinodal region as the doping level is reduced. We find that exhibits a quasi linear temperature dependence in and out of the pseudogap phase.
2 Experimental Results
The Bi-2212 single crystals have been grown by floating zone method. Doping is achieved by changing the oxygen content only. The detailed procedures of the crystal growth are described elsewhere [20, 21]. Raman experiments have been carried out using a triple grating spectrometer (JY-T64000) equipped with a nitrogen cooled CCD detector. We used the 532 nm excitation line from a diode pumped solid state laser (DPSS) and the 514.52 nm line from a , laser. Temperature dependent measurements have been carried out in a ARS closed cycle cryostat. All measurements have been corrected for the Bose factor and the instrumental spectral response. The and geometries have been obtained using crossed light polarizations at 45o from the bond directions and along them respectively.
Special care has been devoted to make reliable quantitative comparisons between the Raman intensities of distinct crystals with different doping levels measured in the same geometry, and between measurements in distinct geometries for crystals with the same doping level. We have performed all the measurements during the same run and the crystals with various doping levels have been mounted on the same sample holder in order to keep the same optical configuration. The optical constant, deduced from spectroscopic ellipsometry measurements on Bi-2212 single crystals, have also been taken into account in order to have comparable Raman intensities of crystals with distinct doping levels.
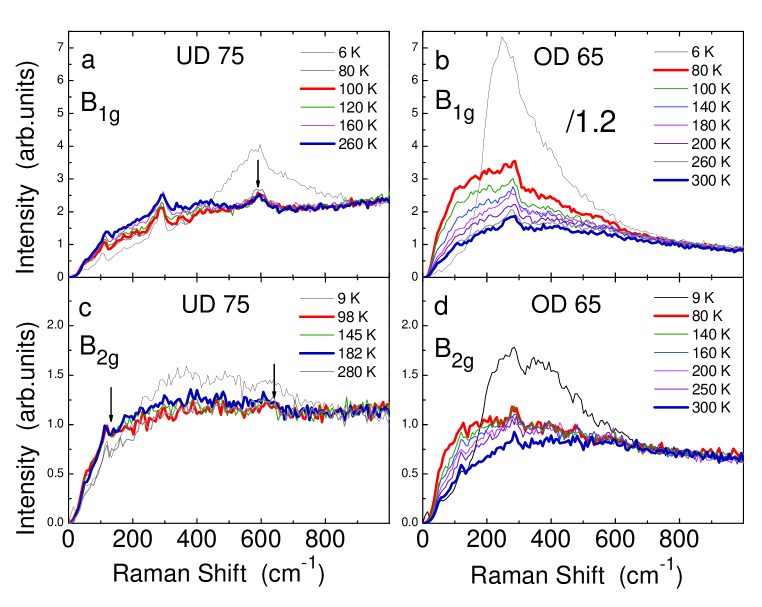
In Figure 1 are displayed the temperature dependence of the and Raman response functions for two distinct Bi-2212 single crystals. The first one is an underdoped (UD) crystal with a and the second one is overdoped (OD) with . The Raman response functions in the superconducting state (black thin curves) exhibit a pair breaking peak. This peak is much more pronounced in the than in geometry (for the same doping level) as expected for a d-wave superconducting gap [22]. We can also notice that the superconducting peak increases in intensity while its energy decreases with doping. This has already been pointed out in our previous works [23, 24] and we have assigned the integrated area under the pair breaking peak to the density of Cooper pairs in the antinodal region. In the normal state (Fig.1-a) the Raman response function of the UD 75 crystal exhibits a strong depletion of the low frequency electronic continnum as the temperature decreases. The thick curves underline the low energy depletion of the electronic background in the Raman spectra. It extends from the lowest energy to approximatively (see arrow). We define the end of this depletion in the spectra as the pseudogap energy . Such a low energy depletion has been qualitatively reproduced by recent cluster dynamical mean field methods [1, 25].
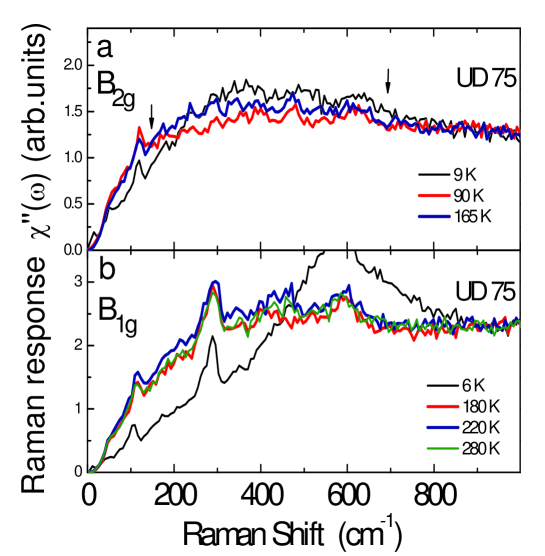
The non trivial fact is that a depletion is also detected in the geometry where it opens at finite energy, above , and closes around (see arrows in Fig.1-c and 2-a). This has also been reported in previous works [14, 15, 16]. Below , the Raman response is not altered by the depletion and the slope increases as the temperature decreases. This is expected for a metal since the low energy slope of the Raman response is proportional to the quasiparticle lifetime [22] . In sharp contrast, no trace of depletion is detected in the Raman spectra of the OD 65 crystal in both and geometries (see figs 1-b,d) and the low energy slopes of the Raman response functions increase with cooling as expected for a metal [22, 26].
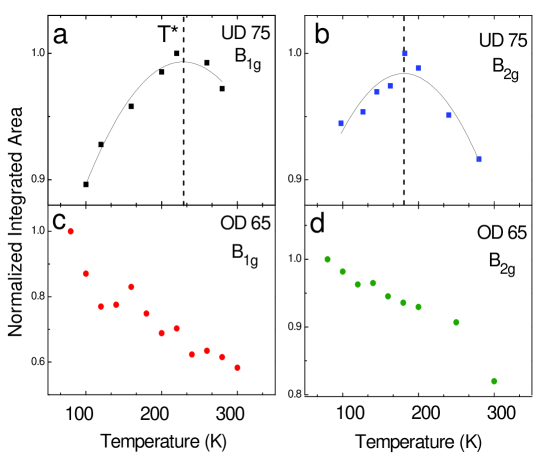
We can estimate the pseudogap temperature by studying the temperature dependence of the normalized integrated area of the Raman response (up to ). The integrated area are plotted in Fig. 3. In fig. 3-a, (ud 75), the positive slope corresponds to a filling of the depletion as the temperature increases. The electronic background is then progressively restored and we can define the temperature for which the sign of the slope changes. It is approximatively (see dashed line). Beyond, the integrated electronic continuum starts to decrease. The slope of the integrated area as a function of temperature is negative. This is a consequence of the decrease of the low energy slope of the Raman response with temperature. This is can be seen in fig.2-b where the low energy slope of the Raman response decreases between and . This corresponds to a metallic behavior [15, 22, 26].
The integrated area of UD 75 exhibits a similar temperature behaviour as shown in fig. 3-b. However, the extracted value is smaller than the one. A possible reason for this behaviour is that the depletion opens at finite energy while the low electronic continuum still exhibit a metallic behaviour. The low energy continuum thus decreases as temperature raises playing against the filling of the depletion. This effect may reduce the extracted in the nodal region with respect to the antinodal one.(see ref. [1]). In the following we will assume that the value of directly related to the pseudogap temperature is the one.
In the overdoped case (see fig.3-c,d) the temperature dependence of the integrated area in and geometries exhibit negative slopes down to the lowest temperatures. This corresponds to a continuous intensity decrease of the electronic background with temperature as expected for a metal[22]. Our experimental findings indicate that the pseudogap phase only sets in below .
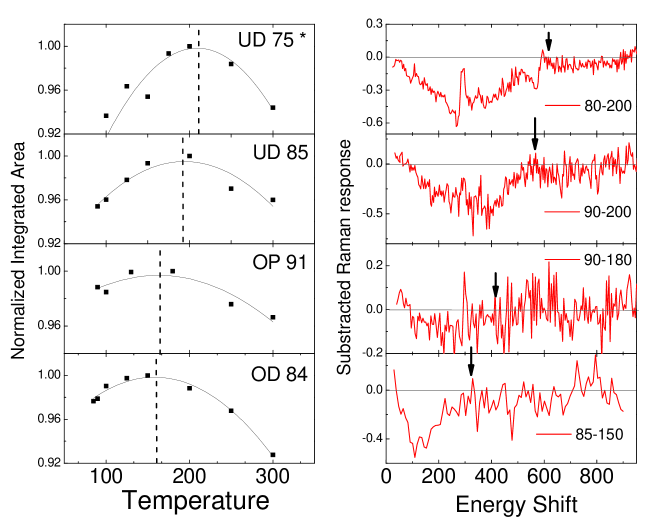
In order to map versus doping, we have performed Raman measurements on Bi-2212 crystals with various doping levels. This is shown in the left panel of fig.4 where the integrated area of the Raman response function up to is plotted for various dopin levels. The dash lines correspond to the temperature from which the slope of the integrated area curve changes of sign. We observe that increases with underdoping. We have also defined the pseudogap energy by subtracting the Raman response measured close to from the one just above . The subtracted spectra are shown in the right panel of fig.4. The pseudogap energy corresponds to the energy for where the depletion closes. We see that also increases with underdoping.
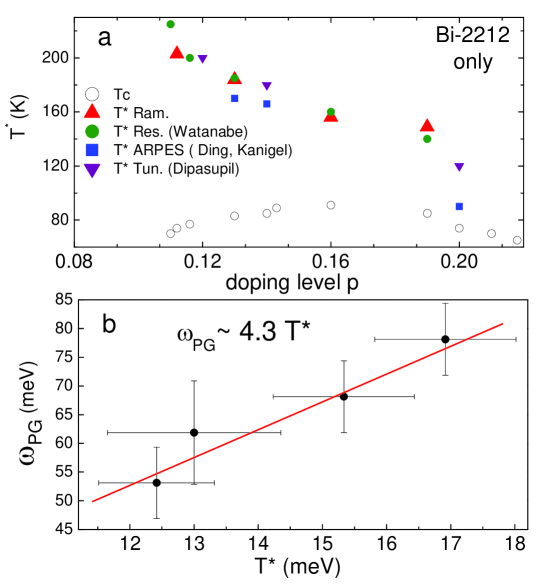
We have also plotted the pseudogap energy obtained from distinct probes on the same Bi-2212 system: resistivity [27], ARPES [28, 29] tunneling [30] and our Raman data in geometry. We can see in fig. 5a that all the measurements are consistent each other. We observe that exhibits the same doping evolution and the same order of magnitude. Typically increases from to between and . This makes us confident about our procedure to define . We have also plotted in fig.5-b versus and we find as it was observed from tunneling [31].
3 Two Distinct Structures for the Pseudo gap and the Supercoducting gap
We now discuss the implications of our findings on the pseudogap structure and its symmetry with respect to the superconducting gap.
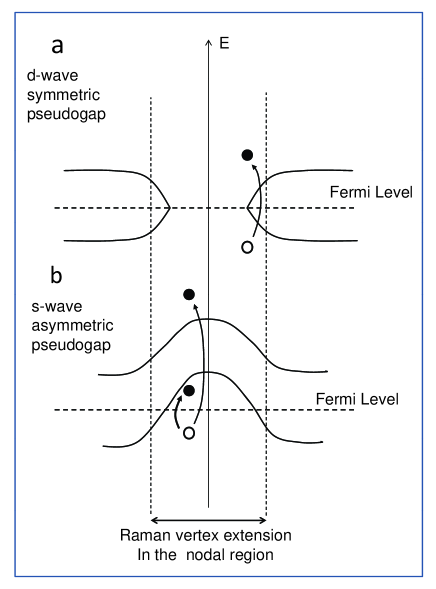
The starting point is the unusual depletion of the Raman response which sets in an intermediate energy range. This has recently suggested a new interpretation for the pseudogap structure [1] deduced from cellular dynamical mean field theory (CDMFT) [32]. The pseudogap would be distinct from the wave symmetry [1]. Indeed the opening of a wave pseudogap around the antinodes (as sketches in fig.6-a) should generate a continuous loss of electron-hole pair excitations in a large energy range from very low to high energy even in nodal region. Inside the k-window fixed by the angular extension of the Raman vertex, very low lying energy excitations are allowed but there is no simple way to get a depletion for intermediate energy range only. In contrast an s-wave anisotropic pseudogap which sets in away from the Fermi surface in the nodal region, like the one depicted in fig. 6-b, leads naturally to a depletion at finite energy. This is because low energy excitations are allowed in the nodal region while the intermediate energy ones are forbidden until the pseudogap energy is exceeded (see fig.4-b). Our view is consistent with recent ARPES data where particle-hole asymmetry has been found in the nodal region. It was obtained on states thermally occupied above the Fermi level [33]
The second crucial point that our data reveal is the presence of additional electronic states generated inside the pseudogap when we enter the superconducting state. In the geometry,(see fig. 2-a) the superconducting peak emerges inside the energy range where the depletion sets in. This is also observed in the geometry (see fig. 2-b). The low energy edge of the superconducting peak is located near inside the energy range of the depletion. Creation of new states within the pseudogap is in agreement with recent advances in dynamical mean field theory which propose a competition between the superconducting gap and the pseudogap[1, 34, 35].
These two experimental facts make very improbable a performed pairs scenario for the pseudogap phase. The first reason is that we should have the same symmetry for both the pseudogap and the superconducting gap. This is not the case here. The second reason is that we should expect an enhancement of the depletion in the superconducting state if this last one results from preformed pairs. This is clearly not the case since the pair breaking peak emerges inside the depletion. Consequently, our experimental findings show that the pseudogap and superconducting gap are distinct in origin. This answers a long standing question introduced by Norman in 2005[36]: ”The pseudogap: friend or foe of high Tc?”. It is a foe. Our findings bring additional experimental evidence to recent studies in ARPES [37, 38], STS [39],optics [40] and transport [41, 42] all showing that the pseudogap and superconducting phases are in competition.
4 Nodal versus Antinodal Low Energy Quasiparticle Dynamics
Here we focus on the very low energy side of the and Raman response functions in and out of the pseudogap phase.
The inverse of the low energy slope of the electronic Raman response function in the normal state is given by according to [43]. and are respectively the static scattering rate and the renormalized spectral weight of the quasiparticles. is defined as the density of states at the Fermi level above T* and the Raman vertex. The angle defines a direction in the Brillouin zone with respect to the principal axis. is equal to and for the AN and N directions respectively.
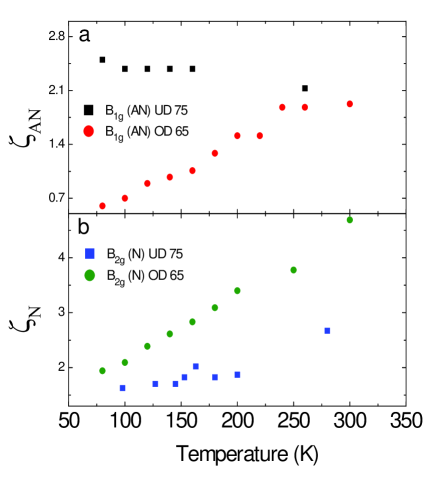
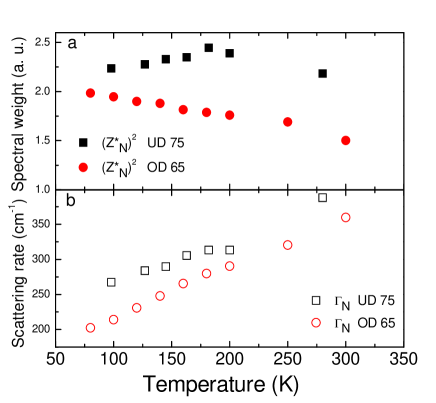
Fig. 7-a shows the temperature dependences of for the UD 65 and OD 65 crystals. exhibits different temperature dependences depending on the doping level. is almost temperature independent for UD 75 while it exhibits a quasi linear temperature dependence for OD 65.
In contrast, for both the OD 65 and UD 75 increases continuously upon heating (see Fig. 7-b). We can also note that the temperature dependence of is stronger for the OD 65 than for the UD 75 compound. Even above (), it subsists a factor of about between the values for the two doping levels (see fig.7-b). What does it means ? Does the nodal static scattering rate is larger for OD 65 than for UD 75 or/and the nodal quasiparticle spectral weight is smaller in the OD case than in the UD one ?
A decrease of with doping could be considered as paradoxical and unexpected since an increase of the doping level should a priori enhance the quasiparticle spectral weight. In fact, the quasiparticles dynamic at the nodes and antinodes have to be considered separately. This dichotomy is clearly seen at (above ) where the electronic continuum intensities in and exhibit opposite doping depedences [23]: the intensity of the low energy continuum decreases while the one increases with doping(see fig.8-a and 8-b).
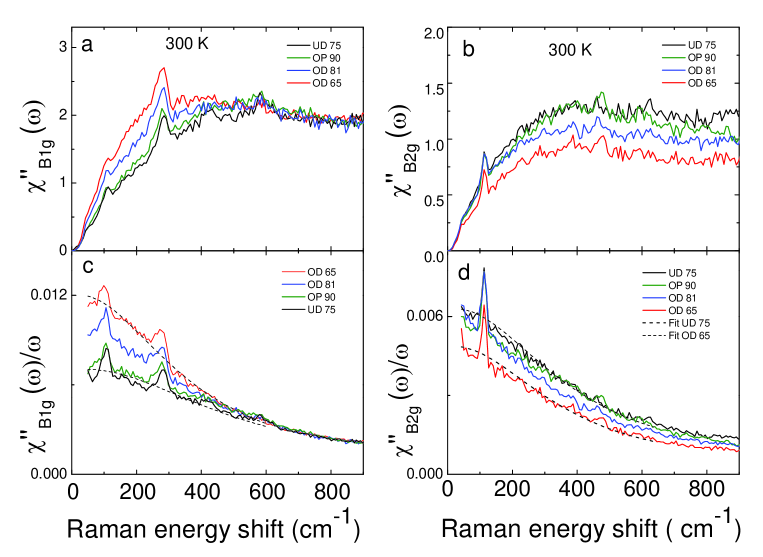
In order to emphasize this, we have reported in figs. 8-a and -b the Raman responses divided by the frequency, . According to the Shrastry-Shraiman relation [44] it is related to the real part of the optical conductivity =Re. We then observe (see Fig. 8-c and d) a ”Drude” peak which grows up in the Raman like conductivity spectra whereas it decreases in intensity as the doping level is increased in the geometry.
This behaviour is in contradiction with recent cluster dynamical mean field calculations where the Drude peak of the calculated Raman spectra is seen to grow up and sharpen as the doping level is increased [25]. We can notice that the ab plane optical conductivity measurements also exhibit an enhancement of the a Drude peak with doping but optical conductivity is not a k-selective probe [45]. We do not yet understand this discrepancy but we suspect that an ingredient is missing such as a possible reconstruction of the Fermi surface with doping [41, 46].
We have fitted the curves with a standard Drude expression assumed to hold at sufficiently low energy [43]: . is the static scattering rate. This hypothesis makes sense since the scattering rate measured from optical measurements on the same compounds is rougthly constant up to [45]. The Drude expression (just above) is particulary useful here because it allows us to disentangle between and .
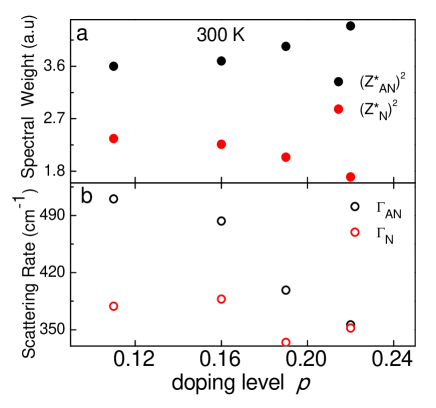
The doping dependence of and extracted from the Drude fits at in and geometries are reported in Fig. 9-a and b. In fig. 9-a, we observe a decrease of of roughtly 40% with doping while increases. This unexpected decrease of with doping is also detected from the Drude fits performed on the Raman like conductivity spectra measured at different temperatures for the UD 75 and OD 65 compounds (see fig. 10-a).
In Fig. 9-b, exhibits a clear decrease of about 45% upon doping: the antinodal quasiparticles are better defined at high doping level than at low one. On the contrary, the nodal scattering rate , is barely doping dependent and shows only a small decrease of 7%. Such variations of the static scattering rate are consistent with previous Raman investigations [15, 26].
From this analysis, it clearly appears that the main contribution responsible for the large difference between between OD 65 and UD 75 (at ) comes from a decrease of rather than a change in with doping. Notice here that the doping evolutions of the Raman vertex and the density of states are unable to explain the increase of with underdoping. The first one (which is proportional in a first approximation to , the second nearest-neighbor intraplane hopping integral, is expected to decrease with underdoping [47] while around the nodes is expected to be almost constant in this doping range () [47].
We would like to mention here that the increase with underdoping is perfectly consistent with our previous investigations in the superconducting state. We have shown that the nodal slope of the superconducting Raman response is almost constant [23, 48]. The most likely scenario for this is that , the nodal slope of the superconducting gap increases with underdoping [24, 49]. This implies that increases with underdoping.
Such a strange doping evolution of is not yet elucidated. However we believe that Fermi surface disturbances could induce this kind of behaviour.
By applying the Drude fit procedure on the Raman like conductivity spectra, we can also extract the temperature dependence of both and . This is shown in fig. 10. Surprisingly we find that exhibits a weak temperature dependence for UD 75 (7%) and a larger one of about 30% for OD 65. We do not have at present an explanation for this behaviour. We also observe as already mentioned that the values (in the temperature range considered) are larger for the UD 75 than for the OD 65 compounds. In fig. 10-b, the static scattering rate, , shows a quasi linear temperature dependence for both the UD 75 and OD 65 compounds. It is quite similar to the temperature dependence of the scattering rate obtained from earlier Raman experiments [15]. The temperature dependence of is quite robust in the doping range and . We have to investigate Raman measurements at higher doping level to detect the behaviour seen from quantum oscillations measurements on strongly overdoped compounds (OD 15K) [7].
5 Conclusion
The pseudogap manifests itself in different manners in the and Raman response functions of underdoped Bi-2212 single crystals. In the spectra, it corresponds to a strong depletion of the low energy electronic continuum as the temperature decreases. This has permitted us to identify both the pseudogap temperature and the pseudogap energy as a function of doping level. The effect of the pseudogap in the Raman spectra is more subtle. The depletion of the electronic continuum settles at a higer energy range than in the geometry. Moreover, superconductivity brings supplementary electronic states inside the energy range where the depletion develops. This is in contradiction with a preformed pairs scenario and lead us to suggest different structures for the pseudogap and the superconducting gap [1]: a d-wave superconducting gap and an s-wave anisotropic pseudogap. We show that the antinodal and nodal quasiparticle dynamics are distinct. The nodal scattering rate exhibits a quasi linear temperature dependence both inside and outside the pseudogap phase while the antinodal scattering rate is strongly altered and becomes non temperature dependent inside the pseudogap phase. This reveals the robutness of the nodal quasiparticles with doping range . Finally, we find that the nodal quasiparticles spectral weight increases with underdoping while the antinodal one decreases. We believe these observations deserve to be more deeply investigated.
5.1 Acknowledgments
We thanks S. Sakai, M. Civelli, A. Georges, A. Millis, G. Orso and R. Lobo for very fruitful discussions.
6 References
References
- [1] Sakai S et al. 2012 arXiv:1207.5070 submitted
- [2] Warren W W et al. 1989 Phys. Rev. Lett. 62 1193
- [3] Alloul H et al. 1989 Phys. Rev. Lett. 63 1700
- [4] Ando Y et al 2004 Phys. Rev. Lett. 93 267001
- [5] Loram J W et al 1994 J. Supercond. 7, 243
- [6] Tallon J L et al 2001 Physica C 349, 53
- [7] Hussey N E et al 2008 J. Phys. : Condens. Matter 20 123201
- [8] Taillefer L , 2010 Annual Review of Condensed Matter Physics 1 51
- [9] Damascelli A et al 2003 Rev. Modern. Phys. 75 473
- [10] Homes C C et al 1993 Phys. Rev. Lett. 71 1645
- [11] Timusk T and Statt B 1999 Rep. Prog. Phys. 62 122
- [12] Lobo R 2011 High-temperature superconductors ed. Qiu X G Woohead Publishing Oxford Cambridge, Philadelphia 103
- [13] Fischer O et al 2007 Rev. Modern. Phys. 79 0610672
- [14] Nemetschek R et al. 1997 Phys. Rev. Lett. 78, 4837
- [15] Opel M et al. 2000 Phys. Rev. B 61, 9752
- [16] Gallais Y et al. 2005 Phys. Rev. B 71, 012506
- [17] Blumberg G et al. Science 278 1427
- [18] Guyard W et al. 2008 Phys. Rev. B 77 024524
- [19] is equivalent to defined in ref. [48].
- [20] Wen J S et al. 2008 J. of Crystal Growth. 310 1401
- [21] Mihaly L et al. 1993 Rev. Sci. Instrum. 64 2397
- [22] Devereaux T P and Hackl R 2007 Rev. Mod. Phys. 79 175
- [23] Blanc S et al. 2009 Phys. Rev. B 80 140502R
- [24] Sacuto A et al 2011 C. R. de Physique 12 480
- [25] Lin N et al. 2010 Phys. Rev. B 82 045104 ; Lin N et al. arXiv: 1206.0023v1
- [26] Venturini F et al. 2002 Phys. Rev. Lett. 89 107003
- [27] Watanabe T et al 2007 Phys. Rev. Lett. 79 2113
- [28] Ding H et al 1996 Nature 382 51
- [29] Kanigel A et al. Nat. Phys. 2 447
- [30] Dipasupil I et al. 2002 J. Phys. Soc. Jpn 71 1535
- [31] Kugler M et al. 2001 Phys. Rev. Lett. 86 4911
- [32] Kotliar G et al. 2006 Rev. Mod. Phys. 78 865; Maier T et al. 2005 Rev. Mod. Phys. 78 1027; Tremblay A -M S et al. 2006 Low Temp. Phys. 32 424
- [33] Johnson P. (private communication); Yang H B et al. 2008, Nature 456 77
- [34] Gull E et al. arXiv:1207.2490v1
- [35] Sordi G et al. 2012 Sci. Rep. 2 547
- [36] Norman M R et al. 2005 Adv. Phys. 54 712
- [37] Kondo T et al. 2009 Nature 457 296
- [38] He R H et al. 2011 Science 331 1579
- [39] Kohsaka Y et al. 2007 Science 315 1380; Kohsaka Y et al. 2008 Nature 454 1072
- [40] Bernhard C et al. 2008 J. Phys. Chem. Solids 69, 3064
- [41] leBoeuf D et al. 2007 Nature 450 533
- [42] Rullier-Albenque F et al. 2012 EPJ Web of Conferences 23 00016
- [43] Devereaux T P 2003 Phys. Rev. B 68 094503
- [44] Shastry B S and Shraiman B I 1990 Phys. Rev. Lett. 65 1068; Shastry B S and Shraiman B I 1991 Int. Journ. Mod. Phys. B 5 365
- [45] Hwang J et al. 2007 J. Phys. Cond. Matter 19 125208
- [46] Norman M R 2010 Physics 3 86
- [47] Kordyuk A A et al. 2003 Phys. Rev. B 67 064504
- [48] Le Tacon M et al. 2006 Nature Phys. 2 537
- [49] Blanc S et al. 2010 Phys. Rev. B 82 144516