9-17
Environments of massive stars
and the upper mass limit
Abstract
The locations of massive stars () within their host galaxies is reviewed. These range from distributed OB associations to dense star clusters within giant H ii regions. A comparison between massive stars and the environments of core-collapse supernovae and long duration Gamma Ray Bursts is made, both at low and high redshift. We also address the question of the upper stellar mass limit, since very massive stars (VMS, ) may produce exceptionally bright core-collapse supernovae or pair instability supernovae.
keywords:
stars: early-type, stars: supernovae: general, stars: Wolf-Rayet, ISM: HII regions, galaxies: star clusters, galaxies: ISM1 Environments of Massive Stars
Massive star formation in the Milky Way spans a broad spectrum, from dispersed, low intensity OB associations to concentrated, high intensity starbursts. Within a few hundred parsec of the Sun, high mass stars () are rather distributed, typically located in loose, spatially extended OB associations (de Zeeuw et al. 1999). A notable exception is Orion OB1, which hosts the Orion Nebula Cluster (ONC), responsible for our closest H ii region. Further afield, large numbers of massive stars are associated with relatively intense bursts of star formation such as the high mass, compact clusters (Trumpler 14, 16) within the Carina Nebula giant H ii region.
1.1 Star clusters
It is generally accepted that the majority of stars form within star clusters (Lada & Lada 2003), although recent evidence suggests star formation occurs in a continuum of stellar densities (e.g. Evans et al. 2009). Nevertheless, given their short-lifetimes (3–50 Myr) only a few percent of massive stars appear genuinely ‘isolated’ (de Wit et al. 2005) such that they either tend to be associated with their natal cluster or are plausible runaways from it111Runaways may be ejected from their cluster either dynamically during the formation process or at a later stage after receiving a kick following a supernova explosion in a close binary system..
According to Weidner & Kroupa (2006), there is a tight relation between cluster mass, and the most massive star formed within the cluster, although this remains controversial (Calzetti et al. 2010, Eldridge 2012). Examples of well known star clusters spanning a range of masses are shown in Table 1, all of which are sufficiently young ( Myr) that the most massive stars have yet to end their lives. We include the most massive star in each cluster, which increases towards the highest mass clusters.
If there is a relation between a cluster and its most massive star, the galaxy-wide stellar initial mass function (IMF) will also depend upon the cluster mass function and the range of cluster masses, as set out by Pflamm-Altenburg et al. (2007). In normal star-forming galaxies the cluster mass distribution follows a power law with index 2, albeit this is truncated at high mass depending upon the rate of star formation (Gieles 2009). Consequently, similar absolute numbers of stars are formed in low mass (), intermediate mass () and high mass () clusters, while high mass stars should be rare in the former. This is not always the case, since star formation in some nearby dwarf irregular starbursts is strongly biased towards a few very high mass clusters (e.g. NGC 1569, Hunter et al. 2000).
| Cluster | Ref | Star | Ref | ||
|---|---|---|---|---|---|
| Oph | a | Oph Source 1 | 9 | a | |
| ONC | b | Ori C | 396 | c | |
| NGC 3603 (HD 97950) | d | NGC 3603-B | 16620 | e | |
| R136 (HD 38268) | e | R136a1 | 320 | e |
(a) Wilking et al. (1989); (b) Hillenbrand & Hartmann (1998); (c)
Simón-Díaz et al. (2006)
(d) Harayama et al. (2008); (e) Crowther et al. (2010)
1.2 H ii regions and star formation rates
Because of the (universal?) Salpeter IMF slope, the overall statistics of massive stars in galaxies will be heavily biased towards 8–20 (early B-type) stars. However, the most frequently used indicator of active star formation is nebular hydrogen emission (e.g. H) from gas associated with young, massive stars. The Lyman continuum ionizing output from hot, young stars is a very sensitive function of temperature (stellar mass), such that one O3 dwarf (75 ) will emit more ionizing photons than 25,000 B2 dwarfs (9 , Conti et al. 2008). Therefore, H ii regions are biased towards high mass (O-type) stars with 20 since B stars will produce extremely faint H ii regions.
Beyond several Mpc, current sensisitivies limit detections of H ii regions to relatively bright examples, involving several ionizing early O-type stars (Pflamm-Altenburg et al. 2007). Still, the H luminosity of bright H ii regions can be converted into the corresponding number of Lyman continuum ionizing photons, for which the number of equivalent O7 dwarf stars, N(O7V), serves as a useful reference (Vacca & Conti 1992), as indicated in Table 2. Kennicutt et al. (1989) have studied the behaviour of the H ii region luminosity function in nearby spirals and irregular galaxies. Early-type (Sa-Sb) spirals possess a steep luminosity function, with the bulk of massive star formation occuring in small regions ionized by one of a few O stars, plus a low cut-off to the luminosity function. Late-type spirals and irregulars possess a shallower luminosity function, in which most of the massive stars form within large H ii regions/OB complexes, for which 30 Doradus in the LMC serves as a useful template. For example, although the LMC contains considerably fewer H ii regions than M31 (SAb), it contains ten H ii regions more luminous than any counterpart in M31 (Kennicutt et al. 1989).
| Region | Type | galaxy | Distance | Diameter | L(H | N(O7V) |
|---|---|---|---|---|---|---|
| (kpc) | (pc) | (erg s-1 | ||||
| Orion (M42) | Classical | Milky Way | 0.5 | 5 | 1 | 1 |
| Rosette (NGC 2244) | Classical | Milky Way | 1.5 | 50 | 9 | 7 |
| N66 | Giant | SMC | 60 | 220: | 6 | 50 |
| Carina (NGC 3372) | Giant | Milky Way | 2.3 | 300: | 1.5 | 120 |
| NGC 604 | Giant | M33 | 800 | 400 | 4.5 | 320 |
| 30 Doradus | (Super)giant | LMC | 50 | 370 | 1.5 | 1100 |
| NGC 5461 | (Super)giant | M101 | 6400 | 1000: | 7 | 5000 |
The integrated nebular H luminosity of a galaxy is widely used as a proxy for the rate of (near-instantaneous) star formation (Kennicutt 1998), although conversions into total star formation rates (SFR) rely upon the adopted stellar mass function and evolutionary models for single and binary stars (e.g. Leitherer 2008). In addition, since the youngest star forming regions are deeply embedded, the combination of gas (H) and dust (24m continuum) provide a more complete SFR indicator (Calzetti et al. 2007), although the situation is more complicated for galaxies with low SFR (e.g. Pflamm-Altenburg et al. 2007). In addition, H-derived star formation rates differ from FUV continuum diagnostics for dwarf galaxies (Lee et al. 2009b), while FUV indicators closely match the local ccSNe rate (Botticella et al. 2012).
1.3 30 Doradus: Template extragalactic giant H ii region
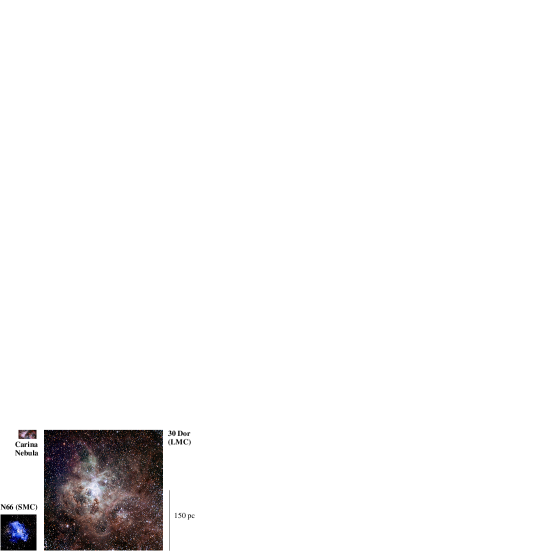
30 Doradus, the brightest star forming complex within the Local Group, provides a useful template for extragalactic ‘supergiant’ H ii regions (Kennicutt et al. 1995, Table 2). The 30 Dor nebula is shown in Fig. 1 and spans an angular size of , corresponding to a linear scale of 220 220 pc at the distance of the LMC. Consequently, individual stars may be studied in detail (e.g. Evans et al. 2011). Walborn & Blades (1997) identified five distinct spatial structures within 30 Dor, (i) the central 1–2 Myr cluster R136; (ii) a surrounding triggered generation embedded in dense knots ( 1 Myr); (iii) a OB supergiants spread throughout the region (4–6 Myr); (iv) an OB association to the southeast surrounding R143 (5 Myr); (v) an older cluster containing red supergiants to the northwest (10–20 Myr). 30 Dor would only subtend at a distance of 30 Mpc, so care should be taken for nebular-derived ages of stars within extra-galactic H ii regions (e.g. Leloudas et al. 2011).
2 Environments of supernovae and gamma-ray bursts
2.1 H ii regions and core-collapse SNe
Turning to studies of the environments of supernovae, locally neither type II nor type Ib/c supernovae are associated with ongoing star formation. Specifically, Smartt (2009) examined the host environment of a volume limited ( 2,000 km/s), statistically complete sample of ccSNe, of which 0 from 20 type II SN were located in bright H ii regions. A number of type II SN were located in loose associations, with two in older clusters (e.g. SN2004am, II-P, in M82), while only 1 of 10 type Ib/c SN from Smartt (2009) was in a large star forming region (SN2007gr, Ic, in NGC 1058), albeit spatially offset from regions of H ii emission.
Anderson & James (2008) took a different approach, studying the assocation between ccSNe and H ii regions within (mostly) bright spirals, whose recession velocities extended up to = 10,000 km/s. In common with Smartt (2009), Anderson & James (2008) did not find type II SNe associated with H ii regions, concluding that the “type II progenitor population does not trace the underlying star formation”. In contrast, Anderson & James (2008) found that type Ib, and especially Ic ccSNe were spatially coincident with (presumably bright) H ii regions.
Let us consider the typical duration of the H ii phase in young, isolated clusters. Walborn (2010) compared the properties of young star clusters, revealing an association with a H ii region only for the first 2–3 Myr, after which the gas has been dispersed (e.g. Westerlund 1, Clark et al. 2005). Therefore, one would not expect ccSNe to be spatially coincident with isolated H ii regions unless the mass of the progenitor was sufficiently short for its lifetime to be comparable to the gas dispersion timescale. This is illustrated in Figure 2(a) where we compare the lifetime of the most massive stars in clusters (masses according to Eqn. 10 from Pflamm-Altenberg et al. 2007), adopting stellar lifetimes from Ekström et al. (2012), with an estimate of the duration of isolated H ii regions (adapted from Walborn 2010). This naturally explains the lack of any association between type II ccSNe and H ii regions for both Smartt (2009) and Anderson & James (2008).
How, then, can one explain the empirical association between type Ib/c SNe and H ii regions in the Anderson & James (2008) study? These either arise from very massive stars, which would be inconsistent with Smartt (2009), or more likely we have to appreciate that not all massive star formation occurs within isolated, compact star clusters.
Late-type spirals and irregulars, which form the majority of Anderson & James’ host galaxy sample, host large star forming complexes, up to several hundred parsec in size, involving (super)giant H ii regions. These are ionized by successive generations of star clusters, separated by a few Myr (Table 2), with a total duty cycle of 10 Myr. Therefore, a massive star exploding within such an environment as a SN after 5–10+ Myr would still be associated with a bright H ii region, as illustrated in Fig. 2(b), even if its natal star cluster had cleared the gas from its immediate vicinity. Resolving the location of the ccSNe within the region would be especially difficult at larger distances. Recall that the average distance of galaxies within the Anderson & James (2008) sample was 32 Mpc, and that their study was based upon moderate resolution ground-based H imaging. Typically higher spatial resolution datasets were employed by Smartt (2009), which together with a lower host distance (27 Mpc maximum for an adopted = 75 km/s/Mpc) enabled a higher spatial inspection of the SN environment (recall Fig. 1).


2.2 Wolf-Rayet stars and ccSNe
Main-sequence O stars may preceed ccSNe by up to 3–10 Myr, whereas Wolf-Rayet stars, their evolved descendents, should preceed (type Ib/c) SNe by a timescale that is an order of magnitude shorter (Crowther 2007). Therefore, comparisons between the environment of Wolf-Rayet stars and ccSNe provide information upon whether the former are plausibly the parent population of the latter (e.g. Leloudas et al. 2010), since lower mass close binaries might dominate type Ib/c SNe statistics (Smith et al. 2011). In addition, we can also compare the environment of Wolf-Rayet stars in their host galaxies (e.g. associated H ii regions) with those of ccSNe.
Since the Wolf-Rayet content of the Milky Way is highly incomplete due to foreground interstellar dust, let us instead turn to local external galaxies. From the LMC Wolf-Rayet catalogue of Breysacher et al. (1999), 58% (78/134) lie within OB associations, while 83% (112/134) lie within catalogued H ii regions. Of course, the LMC is not particularly representative of the local star forming galaxy population, since star formation is largely confined to several giant H ii regions (Kennicutt et al. 1995) and faint H ii regions would not necessarily be identified in distant galaxies. Neugent & Massey (2011) have re-assessed the Wolf-Rayet content of M33 (Scd), revealing a total of 206 stars which they argue is complete to 5%. As for the LMC, the majority of WR stars (80%) reside in OB associations. Further afield, a comparison between the recent Wolf-Rayet photometric survey of the Scd spiral NGC 5068 (Bibby & Crowther 2012) with H images reveals that 50% of the Wolf-Rayet candidates lie in bright or giant H ii regions, while 25% are associated with faint H ii regions and 25% lie away from any nebulosity.
Recalling Sect. 2.1, type Ib/c SN are rarely associated with H ii regions. This suggests that most do not result from young, massive Wolf-Rayet stars, arising instead from lower mass close binaries in which the ccSNe arises from the H-deficient, mass-losing primary (Fryer et al. 2007). In contrast, the preference of type Ic SNe for H ii regions suggest that massive Wolf-Rayet stars are realistic progenitors in such instances. Close binaries in such a scenario ought to mimic the masses, and in turn, the lifetimes of type II ccSNe progenitors, which positively shy away from H ii regions.
| Host | SFR | Cluster range | Characteristic | SN-H ii | Example |
|---|---|---|---|---|---|
| () | H ii region | association? | |||
| Spiral (Sab) | Low | 102-4 | Isolated | No (all types) | M31 |
| Spiral (Scd) | High | 102-6 | Giant | Yes (Ib/c), No (II-P) | M101 |
| Irr | Low | 102-4 | Isolated | No (all types) | SMC |
| Irr | High | 102-6 | Giant | Yes (Ib/c, GRB), No (II-P) | NGC 1569 |
2.3 ccSNe, long GRBs and host galaxy types
Mindful of the spatial resolution issue, let us turn to the Kelly et al. (2008) study of SNe locations with respect to the continuum -band light from their low redshift () host galaxies. Kelly et al. revealed that Ic SNe are much more likely to be found in the brightest regions of their hosts than Ib or II SNe. An earlier analysis of high redshift galaxies by Fruchter et al. (2006) revealed that long GRBs ( = 1.25) were also strongly biased towards the brightest pixel of their hosts, in contrast to core-collapse SNe ( = 0.63, presumably mostly type II-P) which merely traced the light from their hosts. Kelly et al. (2008) concluded that if the brightest locations correspond to the largest star-forming regions, type Ic SNe (and long GRBs) are restricted to the most massive stars, while type Ib and especially type II-P SNe are drawn from stars with more moderate masses, results in common with Anderson & James (2008).
However, one significant difference between the low-redshift SN H study of Anderson & James (2008) and the high-redshift GRB study of Fruchter et al. (2006) is that hosts of the former are relatively high mass, metal-rich spirals, while those of the latter are low mass, metal-poor dwarfs. In normal disk galaxies the number of stars forming across the mass distribution of star clusters is relatively flat, albeit with a cut-off linked to the star formation intensity (Gieles 2009). The star cluster mass function is repeated in nearby dwarf galaxies (Cook et al. 2012), but galaxy-wide triggers may induce intense, concentrated bursts of star formation, leading to disproportionately numerous massive star clusters (Billett et al. 2002)222Of course, not all dwarf galaxies are starbursting. Within the local volume (11 Mpc) only a quarter of the star formation from dwarf galaxies is formed during starbursts (Lee et al. 2009a). We have attempted to set out the potential association between H ii regions, ccSNe and long GRBs in Table 3 for star forming spirals and irregulars, based upon the above arguments, although exceptions are anticipated (and subject to uncertainties regarding the main progenitors of type Ib/c SNe).
Relatively massive, metal-rich galaxies would represent the primary site of all star formation for the sample of Fruchter et al. (2006), resulting in (type II-P) ccSNe unassociated with the brightest regions in their hosts. Yet, when localised starburst activity does occur, it is very intense (Billett et al. 2002), leading to very massive clusters, and in turn large numbers of high mass, metal-poor stars, a subset of which would be progenitors of the long GRBs witnessed by Fruchter et al. (2006).
3 Upper Mass Limit
The lower limit to the mass of stars is relatively well known (e.g. Burrows et al. 1993), yet establishing whether there is a corresponding upper mass limit has proved elusive (Massey 2011). In part, this is because obtaining robust masses for VMS is extremely challenging, and in part because of the scarcity of star clusters that are sufficiently nearby, young and massive for their most massive stars to be studied in detail. Up until recently, a mass limit of has been commonly adopted, based upon a near-IR photometric study of the Arches cluster (Figer 2005). However, it is well known that the temperature of hot, massive stars is rather insensitive to optical/IR photometry. Spectroscopic analysis is required for robust temperatures and in turn luminosities, from which stellar masses are derived.
3.1 R136 stars
The situation is especially difficult for the brightest main-sequence members of the most massive young clusters, which possess unusual (emission line) spectral morphologies, reminiscent of Wolf-Rayet stars (e.g. Drissen et al. 1995). The mass-luminosity relationship for main-sequence VMS is relatively flat, (e.g. Crowther et al. 2012), so inferred masses are particularly sensitive to temperature, . Recent advances in atmospheric models for stars with dense stellar winds has led to an upward revision to the temperatures of such stars, by 25%, corresponding to as much as an 80% increase in the resulting mass. Fortunately, several very massive, double-lined eclipsing binaries have been identified within the past few years, including the Wolf-Rayet binary NGC 3603 A1 (Schnurr et al. 2008), permitting an independent check on spectroscopic results for similar systems.
R136, the central ionizing cluster of 30 Dor, has both a very high stellar mass (55,000 ) and a sufficiently young age (1–2 Myr) for its most massive stars not to have undergone core-collapse. Previous estimates of their stellar masses, based on conventional O star calibrations, implied 120 – 155 (Massey & Hunter 1998). Schnurr et al. (2009) searched for close binaries among the visually brightest members, but none revealed radial velocities, with the possible exception of R136c. Still, their near-IR integral field datasets provided spatially resolved spectroscopy of individual stars within R136, which, together with archival UV/optical spectroscopy and AO-assisted photometry permitted a reassessment of their stellar masses. Spectroscopic analyses together with new evolutionary models for VMS enabled Crowther et al. (2010) to revise their (current) stellar masses upward to 135–265 . Initial masses of 165–320 were inferred, adopting standard main-sequence mass-loss rates for VMS (Vink et al. 2001) which closely matched spectroscopically-derived values, and were reinforced by the close agreement between spectroscopic and dynamical masses obtained for NGC 3603-A1. Overall, R136 supports the trend that higher (initial) mass stars reside within the most massive star clusters set out by Weidner & Kroupa (2006). However, statistics of high mass clusters for which accurate stellar masses have been determined remain very poor.
3.2 Pair instability supernovae
Based upon their re-assessment of the most massive stars in R136 and other young, high mass clusters (Arches, NGC 3603), Crowther et al. (2010) concluded that their stellar content was consistent with a revised upper mass limit of . Regardless of the physical origin of this limit, such high initial masses raise the prospect of extremely luminous core-collapse SNe (Waldman 2008) or even pair-instability SNe (Heger & Woosley 2002). Models have recently been calculated for the post-main sequence evolution of VMS spanning a range of metallicities (N. Yusof, these proc.). From these, would appear that the VMS in R136 will end their lives as core-collapse SNe, with lower metallicity (SMC-like) required to reduce mass-loss rates sufficiently for pair-instability SNe, as has been proposed for SN 2007bi (Gal-Yam et al. 2009). However, details remain very sensitive to mass-loss prescriptions for the post-main sequence evolution (e.g. Crowther et al. 2012).
Acknowledgements.
I am grateful to financial support from the Royal Society, IAU and local organizers, enabling participation in the Symposium. Thanks also to Raphael Hirschi and Lisa Yusof for providing results of evolutionary models for VMS prior to publication, plus Mark Gieles for helpful discussions.References
- [Anderson & James (2008)] Anderson, J.P., James, P.A. 2008, MNRAS, 390, 1527
- [Bibby & Crowther (2012)] Bibby, J.L., Crowther, P.A. 2012, MNRAS, 420, 3091
- [Billett et al. (2002)] Billett, O.H., Hunter, D.A., Elmegreen B.G., 2002, AJ 123, 1454
- [Botticella et al. (2012)] Botticella, M.T., Smartt, S.J., Kennicutt, R.C.Jr. et al. 2012, A&A, 537, A132
- [Breysacher et al. (1999)] Breysacher, J., Azzopardi, M., Testor, G. 1999, A&AS, 137, 117
- [Burrows et al. (1993)] Burrows, A., Hubbard, W.B., Saumon, D., Lunine, J.I. 1993, ApJ, 406, 158
- [Calzetti et al. (2007)] Calzetti, D., Kennicutt, R.C., Engelbracht C.W. et al. 2007, ApJ, 666, 870
- [Calzetti et al. (2010)] Calzetti, D., Chandar, R., Lee, J.C. et al. 2010, ApJ, 719, L158
- [Clark et al. (2005)] Clark, J.S., Negueruela, I., Crowther, P.A., Goodwin, S.P. 2005, A&A, 434, 949
- [Conti et al. (2008] Conti, P.S., Crowther, P.A., Leitherer, C., 2008, From Luminous Hot Stars to Starburst Galaxies (Cambridge: CUP)
- [Cook et al. (2012)] Cook, D.O., Seth, A.C., Dale, D.A. et al. 2012, ApJ, in press (arXiv:1203.4826)
- [Crowther (2007)] Crowther, P.A., 2007, ARA&A, 45, 177
- [Crowther et al. (2010)] Crowther, P.A., Schnurr, O., Hirschi R. et al. 2010, MNRAS, 408, 731
- [Crowther et al. (2012)] Crowther, P.A., Hirschi, R., Walborn, N.R. 2012, in: L. Drissen (ed.), Four Decades of Research on Massive Stars (San Francisco: ASP), ASP Conf. Ser, in press
- [de Wit et al. (2005)] de Wit, W.J., Testi, L., Palla, F., Zinnecker, H. 2005, A&A, 437, 247
- [de Zeeuw et al. (1999)] de Zeeuw, P.T., Hoogerwerf, R., de Bruijne, J.H.J. et al. 1999, AJ, 117, 354
- [Drissen et al. (1995)] Drissen, L., Moffat, A.F.J., Walborn, N.R., Shara, M.M. 1995, AJ, 110, 2235
- [Ekström et al. (2012)] Ekström, S., Georgy, C., Eggenberger, P. et al. 2012, A&A, 537, A146
- [Eldridge (2012)] Eldridge, J.J., 2012, MNRAS, in press (arXiv:1106.4311)
- [Evans et al. (2009)] Evans, N.J. II, Dunham, M.M. Jørgensen, J.K., 2009, ApJS, 181, 321
- [Evans et al. (2011)] Evans C.J., Taylor, W.D., Henault-Brunet, V. et al. 2011, A&A, 530, A108
- [Figer (2005)] Figer D.F., 2005, Nat, 434, 192
- [Fruchter et al. (2006)] Fruchter, A.S., Levan, A.J., Strolger, L. et al. 2006, Nat, 441, 463
- [Fryer et al. (2007)] Fryer, C.L., Mazzali, P.A., Prochaska, J. et al. 2007, PASP, 119, 861
- [Gal-Yam et al. (2009)] Gal-Yam, A., Mazzali, P., Ofek, E.O. et al. 2009, Nat, 462, 624
- [Gieles (2009)] Gieles, M. 2009, MNRAS, 394, 2113
- [Harayama et al. (2008)] Harayama, Y., Eisenhauer, F., Martins, F., 2008, ApJ, 675, 1319
- [Heger & Woosley (2002)] Heger, A., Woosley, S. E., 2002, ApJ, 567, 532
- [Hillebrand & Hartmann (1998)] Hillebrand, L.A., Hartmann, L.W., 1998, ApJ, 492, 540
- [Hunter et al. (2000)] Hunter D.A., O’Connell, R.W., Gallagher, J.S., Smecker-Hane, T.A., 2000, AJ 120, 2383
- [Kelly et al. (2008)] Kelly P.L., Kirschner, R.P., Pahre M., 2008, ApJ, 687, 1201
- [Kennicutt (1984)] Kennicutt, R.C.Jr.,, 1984, ApJ, 287, 116
- [Kennicutt (1998)] Kennicutt, R.C. 1998, ARA&A, 36, 189
- [Kennicutt et al. (1989)] Kennicutt, R.C.,Jr., Edgar, B.K., Hodge, P.W., 1989, ApJ, 337, 761
- [Kennicutt et al. (1995)] Kennicutt R.C. Jr, Bresolin, F., Bomans, D.J., Bothun, G.D., Thompson, I.,B. 1995, AJ, 109, 594
- [Lada & Lada (2003)] Lada, C.J., Lada, E.A., 2003, ARA&A, 41, 57
- [Lee et al. (2009a)] Lee J.C., Kennicutt, R.C. Jr, Funes, J.G. et al. 2009a, ApJ, 692, 1305
- [Lee et al. (2009b)] Lee J.C., Gil de Paz, A., Tremonti, C. et al. 2009b, ApJ, 706, 599
- [Leitherer (2008)] Leitherer C.,. 2008, in: L.K. Hunt, S. Madden & R. Schneider (eds.), Low-Metallicity Star Formation: From the First Stars to Dwarf Galaxies, Proc. IAU Symp. 255 (Cambridge: CUP), p. 305
- [Leloudas et al. (2010)] Leloudas, G., Sollerman, J., Levan, A.J. et al., 2010, A&A, 518, A29
- [Leloudas et al. (2011)] Leloudas, G., Gallazzi, A., Sollerman, J., et al., 2011, A&A, 530, A95
- [Massey & Hunter (1998)] Massey, P., Hunter, D.A., 1998, ApJ, 493, 180
- [Massey (2011)] Massey P.,. 2010, in: M. Treyer, T.K. Wyder, J.D. Neill et al. (eds.), UP2010: Have Observations Revealed a Variable Upper End of the Initial Mass Function? (San Francisco: ASP), ASP Conf. Ser 440, p. 29
- [Neugent & Massey (2011)] Neugent, K.F., Massey, P., 2011, ApJ, 733, 123
- [Pflamm-Altenburg et al. (2007)] Pflamm-Altenburg, J., Weidner, C., Kroupa, P., 2007, ApJ, 671, 1550
- [Schnurr et al. (2008)] Schnurr O., Casoli, J., Chené, A.-N. et al. 2008, MNRAS, 389, L38
- [Schnurr et al. (2009)] Schnurr, O., Chené, A.-N., Casoli, J. et al. 2009, MNRAS, 397, 2049
- [Simón-Díaz et al. (2006)] Simón-Díaz, S. , Herrero, A., Esteban, C., Najarro, F., 2006, A&A, 448, 351
- [Smartt (2009)] Smartt, S.J. 2009, ARA&A, 47, 63
- [Smith et al. (2011)] Smith, N.,. Li, W., Filippenko, A.V., Chornock, R., 2011, MNRAS, 412, 1522
- [Vacca & Conti (1992)] Vacca, W.D., Conti, P.S.,, 1992, ApJ, 401, 543
- [Vink et al. (2001)] Vink, J.S., de Koter, A., Lamers, H.J.G.L.M. 2001, A&A, 369, 574
- [Walborn (2010)] Walborn N.R.,. 2010, in: C. Leitherer, P.D. Bennett, P.W. Morris & J. Th. van Loon (eds.), Hot and Cool: Bridging Gaps in Massive-Star Evolution (San Francisco: ASP), ASP Conf. Ser 425, p. 45
- [Walborn & Blades (1997)] Walborn N.R., Blades J.C., 1997, ApJS, 112, 457
- [Waldman (2008)] Waldman, R. 2008, ApJ, 685, 1103
- [Weidner & Kroupa (2006)] Weidner, C. Kroupa, P., 2006, MNRAS, 365, 1333
- [Wilking et al. (1989)] Wilking, B.A., Lada, C.J., Young, E.T., 1989, ApJ, 340, 823