The spin Hall effect as a probe of nonlinear spin fluctuations
Abstract
The spin Hall effect and its inverse play key roles in spintronic devices since they allow conversion of charge currents to and from spin currents. The conversion efficiency strongly depends on material details, such as the electronic band structure and the nature of impurities. Here we show an anomaly in the inverse spin Hall effect in weak ferromagnetic NiPd alloys near their Curie temperatures with a shape independent of material details, such as Ni concentrations. By extending Kondo’s model for the anomalous Hall effect, we explain the observed anomaly as originating from the second-order nonlinear spin fluctuation of Ni moments. This brings to light an essential symmetry difference between the spin Hall effect and the anomalous Hall effect which reflects the first order nonlinear fluctuations of local moments. Our finding opens up a new application of the spin Hall effect, by which a minuscule magnetic moment can be detected.
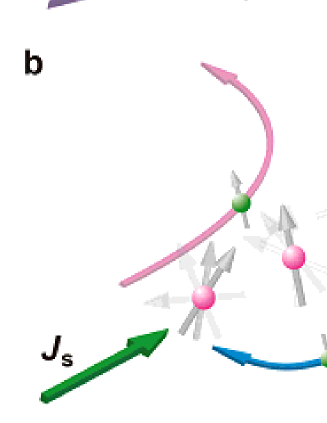
Spintronics has provided an impetus for the intensive development of techniques to generate or detect spin currents, such as nonlocal spin injection 1 , spin pumping 2 and spin light emission devices 3 . The spin Hall effect (SHE) 4 , which converts a charge current to a spin current, and its inverse have been widely explored in semiconductors 3 ; 4 ; 5 and nonmagnetic metals 2 ; 6 ; 7 by using such techniques. While most of the work has concentrated on the phenomenon and mechanism of the SHE itself, Uchida et al. have used the SHE as a detector of a spin dependent chemical potential arising from the spin Seebeck effect 8 ; 9 . Further applications of the SHE are, however, still lacking. Recently the doping of gold with individual iron impurities was considered as a mechanism to enhance the SHE through spin fluctuations of the iron moments 10 . This raises the question whether the SHE might be sensitive to collective fluctuations, in particular close to a magnetic phase transition where the fluctuations are strong. As for the anomalous Hall effect (AHE) in a pure ferromagnetic metal such as Fe 11 and Ni 11 ; 12 , a sharp peak of the Hall resistivity () appears only below the Curie temperature (). This can be understood as an effect of fluctuations of local magnetic moments 13 . In this report we shall demonstrate experimentally, and provide a theoretical argument, that the inverse SHE (ISHE) also shows an anomaly, but that it is substantially different from that of the AHE. Figure 1 shows schematic images of the AHE and the ISHE of a weak ferromagnetic material near . In the AHE, a charge current is injected into the ferromagnetic material, and the difference of the skew scattering probabilities for spin-up and spin-down electrons results in a Hall voltage. In the ISHE, on the other hand, a spin current is injected and both spin-up and spin-down electrons are deflected to the same side, which also results in a Hall voltage. Contrary to the AHE, however, we observe a dip and peak in the ISHE for weak ferromagnetic NiPd alloys below and above , respectively. Since the quantity of the involved Ni ions are very small, the present system could be used for sensitive magnetometry.
Results
AHE and ISHE of NiPd alloys.
We measured the SHE of a weakly ferromagnetic NiPd nanowire with 7%, 8%, and 9% Ni using the nonlocal spin injection technique 14 ; 15 ; 16 at K. Figures 2a and 2b show the schematic structure and scanning electron microscopy (SEM) image of the lateral spin valve with the NiPd middle wire. The NiPd alloy is a weak ferromagnet when the Ni concentration is larger than 2.3% 17 . Depending on the Ni concentration, its varies from a few K to hundreds of K. In order to characterize the magnetic property of NiPd wires in our devices, AHE measurements were performed for the reference NiPd Hall bars prepared at the same time as the SHE devices. A representative AHE resistance for Ni0.08Pd0.92, which is proportional to the magnetization, is shown in Fig. 3a. We note that in the AHE measurements, the external field was applied perpendicularly to the plane, which is different from the ISHE measurements (see Fig. 2b). At K a hysteresis loop of the magnetization can be clearly seen. With increasing temperature, the magnetization continually decreases to zero and simply shows the ordinary Hall resistance above 30 K. The Curie temperature for Ni0.08Pd0.92 can be determined to be about 21 K by plotting the remnant magnetization and coercive field versus temperature (Fig. 3b), which is lower than the value for the bulk alloy 18 . This is presumably due to the imperfect distribution of Ni in our alloy, prepared by the ion implantation technique, compared with bulk alloys (see Methods). We also performed the same measurements for the other two concentrations where for Ni0.07Pd0.93 and Ni0.09Pd0.91 are 16 and 32 K, respectively.
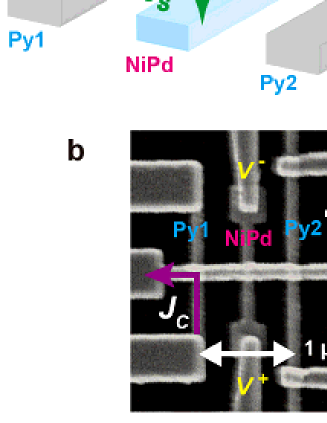
The ISHE is based on the spin to charge current conversion, which follows the vector product as below: where and are the charge and spin current density, is the spin orientation of the conduction electron. Our device configuration is depicted in Fig. 2a. The charge current flows from one of two Ni0.81Fe0.19 (hereafter Py) wires, i.e., Py1 to the left hand side of the Cu wire. Since the spin-orbit (SO) interaction of Cu is quite weak, it works as a transmitter of the generated spin current at the Cu/Py1 interface to the right hand side of the Cu wire. The spin current is preferentially absorbed into the NiPd middle wire below the Cu wire because of its strong SO interaction. This absorption is confirmed by a reduction of the nonlocal spin valve (NLSV) signal detected at the second Py electrode Py2, as detailed in refs. 15 and 16. In the case of Ni0.08Pd0.92, the NLSV signal is reduced to 0.25 compared to the value without the NiPd middle wire, and the spin diffusion length is estimated to be 10 nm. The absorbed spin-up and down electrons with the orientation parallel to the hard direction of the Py wires are scattered by Ni impurities in Pd, resulting in the Hall voltage . From the field variation, the overall change of ISHE resistance (equal to divided by the charge current) can be observed.
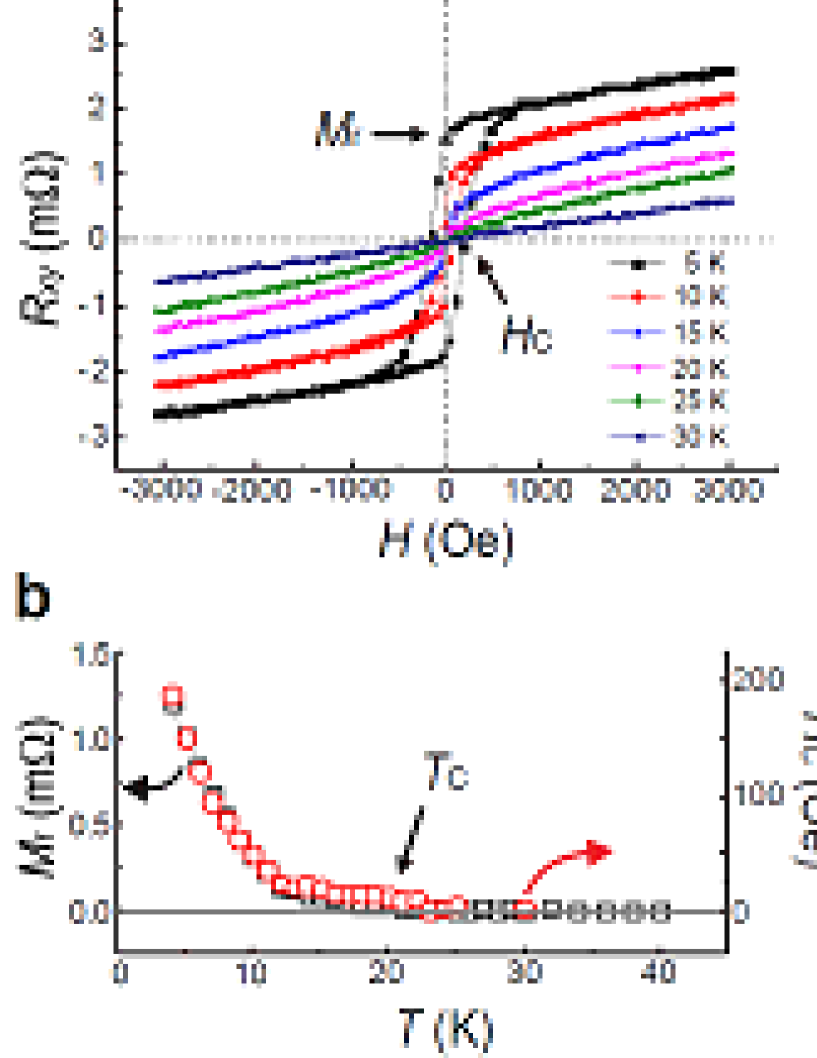
We show representative ISHE resistance curves for Ni0.08Pd0.92 as a function of the magnetic field at various temperatures in Fig. 3c, where all curves are shifted for clarity. Generally increases linearly with the magnetic field up to 2000 Oe and then becomes flat. This is consistent with the saturation of the magnetization of Py1, indicated by the anisotropic magnetoresistance (AMR) curve of Py1 shown in Fig. 3d. In the following we focus on with saturated magnetization of Py1 (i.e., Oe). For temperatures far below (10 K; black curve) and above (30 K; pink curve) , is completely flat at high enough fields, which is as expected in the ISHE for nonmagnetic systems. The values of are much larger than those for pure Pd, where an intrinsic mechanism should apply 16 ; 19 ; 20 and we will argue that this increase comes from the extrinsic effect of the Ni impurities.
For temperatures near , in contrast, anomalous behavior can be clearly seen. At 20 K just below ( K), decreases with increasing the magnetic field () up to 8000 Oe and then flattens out (see the red curve in Fig. 3c). Just above , at 22 K, on the other hand, has a positive slope versus magnetic field even above 2000 Oe and is not yet saturated at our maximum field. By making many similar scans for a full temperature range from 10 to 30 K, we can display this behavior more clearly seen in the 3D plot shown in Fig. 3e. The and axes are the magnetic field and temperature, respectively, while both the axis and color represent . When the temperature crosses , a reduction first appears at 20 K as a light blue peak at negative fields or a light yellow dip at positive fields (see red triangles in Fig. 3c); then an enhancement appears at 22 K as a dark blue dip at negative fields or a red peak at positive fields (see blue stars in Fig. 3c). Such a behavior of is observed below and above but only in the vicinity of . As already mentioned, for a nonmagnetic metal should be completely flat at any temperature. It is thus unambiguous that the observed change in of the NiPd alloys near is correlated to the magnetic phase transi-tion of the NiPd wire (see Fig. 3b). On the other hand, such an anomaly near is not observed in the temperature dependence of the spin absorption rate or the spin diffusion length of NiPd. This is because the spin diffusion length depends simply on the resistivity and the SO interaction of the NiPd wire while the ISHE signal is strongly affected by the type of scattering mechanisms, i.e. skew scattering, side-jump or band structure.
Anomaly in ISHE of NiPd alloys near Curie temperatures.
In order to better quantify the contribution to the ISHE intrinsic to the NiPd wire, we define the change in as , as shown in Fig. 3c. As a maximum field we chose 8800 Oe in this work. Certainly at 22 K is not fully saturated even at 8800 Oe, which is different from at 20 K. This is related to the fact that it is much more difficult to align the localized magnetic moments of Ni impurities above compared to those below even if high magnetic fields are applied. In Fig. 4a, we plot of Ni0.08Pd0.92 (shown by red dots) as a function of temperature. The anomaly of near is clearly seen. Below 18 K, is almost constant with temperature. Only in the vicinity of , however, it shows a dip and peak structure at 20 and 21.5 K, respectively. Since varies little with temperature except near , it can be separated into the temperature-independent background and the anomalous part , as . The results for NiPd with 7% and 9% of Ni are plotted with black squares and blue triangles, respectively. The increase of with the doping concentration suggests the extrinsic contribution induced by the Ni impurities. Thus comes from both the extrinsic SHE of Ni impurities and the intrinsic SHE of Pd 16 . Despite the fact that depends strongly on the Ni concentrations, does so primarily via a shift to be near the corresponding . We emphasize that such critical behavior was reproducible for each of at least three samples at each Ni concentration; thus our arguments are based on more than 10 complete data sets, of which only one is shown in Fig. 3e.
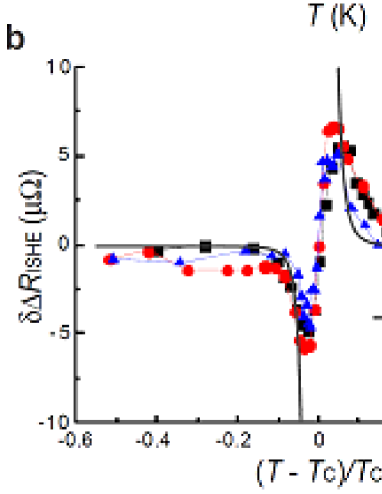
For the three concentrations, are plotted as a function of the reduced temperature in Fig. 4b. Note that each curve corresponds to one full data set: for example the red line represents a reduction of all of Fig. 3e. Although the three devices have different and , the anomalous behavior appears to be universal near : the three curves almost scale onto one. The amplitudes of the dip and peak are about 5 . The anomalous behavior disappears when the reduced temperature differs from by 10%. These results are obviously different from the case of the AHE 13 where the anomaly of the Hall resistivity appears only below .
Discussion
What is the origin of the anomaly of observed only in the vicinity of ? Resistive anomalies near magnetic critical points have been studied for a long time. The anomaly near in the longitudinal resistivity appears within the first Born approximation from quadratic fluctuations in the moments and of localized spins at sites and where contributions come only when and are within a certain cut-off distance 21 . The resistivity then depends on a linear local magnetic susceptibility which is a summation of short-range fluctuations up to this distance. To simplify notation we shall denote the sum of such short range correlations as , omitting the site subscripts, and we shall use similarly abbreviated notations for higher order moments. As mentioned in the introduction, the anomaly of in the AHE near was explained by Kondo 13 . Note that the quantities and in ref. 13 correspond to a first order nonlinear susceptibility and a second order nonlinear susceptibility , respectively. We change notation for simplicity, and also to emphasize that Kondo makes a strictly local approximation, whereas we extend the theory to include nearby correlations between atomic moments. The anomaly of in the AHE appears from the first order fluctuation of local moments . The second order spin fluctuation is also defined in ref. 13 but made no contribution to the AHE. This will be explained below; we first note that the and terms appear in the - Hamiltonian to the same order with respect to the spin-orbit coupling constant of the localized moment. The term in changes sign for spin-up or down electrons, while does not. Thus the scattering amplitudes for spin-up and down conduction electrons are different and proportional to and respectively 13 . As illustrated in Fig. 1, in the case of the AHE configuration, spin-up and down conduction electrons are scattered to opposite directions. As a result, is proportional to the difference of scattering amplitudes between spin-up and down electrons, i.e., . On the other hand, in the ISHE configuration, both spin-up and down electrons are scattered to the same side. Unlike the AHE, the obtained is proportional to the sum of scattering amplitudes between spin-up and down electrons, i.e., . The effect of such terms has been hidden for 50 years 13 . However, it is naturally expected that the contributions related to can survive if the incident current is the spin current, which is exactly the case for the ISHE.
To make a comparison between theory and experiment we should, in principle, calculate , which is integrated over the Fermi surface. This should be proportional to the experimental . However, the integration depends essentially on the Fermi wave vector, which acts as a cut-off to any divergence. To avoid including material dependent parameters, we compare to a quantity, the uniform second order nonlinear susceptibility which is independent of cut-off. is the response of the moments on all the sites to a uniform magnetic field, and is the sum of correlations over all distances without any cut-off (see Supplementary Discussion). In Fig. 4b we superimpose on the experimental data a mean field calculation of . It diverges with opposites signs above and below . We interpret the dip and peak observed in the experimental data as a smearing of such a divergence. In a full calculation the theoretical spin Hall resistance should also be smeared: the divergence is cut-off, just as for the longitudinal resistance 21 . To confirm the above scenario, we have performed Monte Carlo simulations for where the contribution of nearest-neighbor correlations is taken into account. As can be seen in Supplementary Figure S1, the smearing of the divergence of at is well-reproduced. Thus we argue that neither the full theory, nor the experiments should diverge at .
Finally we note that the anomaly of in the AHE in pure Fe 11 and Ni 11 ; 12 may alternatively be explained by Karplus and Luttinger’s theory which is based on band effects 22 . In this theory would be proportional to where is the longitudinal resistivity and is the averaged magnetization. Since is zero above , the sign change of below and above seems to preclude explanation by such band effects.
In conclusion, we have demonstrated a characteristic behavior of the spin Hall effect at the magnetic phase transition of the weak ferromagnetic NiPd near its Curie temperature . It can be explained by the fluctuation contributions to skew scattering via spin-orbit interactions, and appears as the second order nonlinear spin fluctuation . Considering the small volume of NiPd wire ( cm3) and the magnetic moment of NiPd, the total magnetic moment involved in the experiment is extremely small: less than emu. Such a tiny moment is far below the sensitivity of magnetometer (for instance, emu for SQUID). The successful extractions of the contribution of higher order spin fluctuations in our experiments prove the extremely high sensitivity of our method. This technique could be very useful to understand more complex spin textures such as spin-glasses and spin-ice. For those systems, the linear magnetic susceptibility has been well-studied so far but there have been almost no experimental studies of the higher order spin fluctuations where some important physics might be still hidden. The present method constitutes a novel approach to detect high order nonlinear fluctuations with an extremely high sensitivity, which is impossible to achieve by a direct measurement. This will broaden the application of the SHE from potential devices to a means of measuring higher order spin fluctuations, particularly in the critical region.
Method
Sample preparation.
The spin Hall devices were fabricated on a thermally oxidized silicon substrate using electron beam lithography on poly-methyl-methacrylate (PMMA) resist and a subsequent lift-off process. Here we used a lateral spin valve structure which consists of two Py wires (30 nm thick and 100 nm wide) with a separation distance of 1 m and a NiPd middle wire (20 nm thick and 100 nm wide) bridged by a Cu wire (100 nm thick and 100 nm wide) as is detailed in Fig. 2 in the main text. A Pd wire was first deposited by electron beam evaporation using a 99.999% purity source. In order to form the NiPd alloy wire with a Ni content of 7%, 8% and 9%, we implanted a suitable amount of Ni+ into the Pd wire using an Ion Implanter (NH-20SR) with an acceleration voltage of 30 kV. As is mentioned in the main text, the prepared NiPd alloy is not perfectly homogenous and nickel is distributed over nm below the Cu/NiPd interface in 20 nm thick Pd wires. This nickel distribution would lower the compared to bulk NiPd alloys. However, the spin diffusion length of NiPd of about 10 nm corresponds to the maximum distribution of Ni in Pd. That is why we could still observe the spin fluctuation of Ni moment. The two Py wires were deposited by electron beam evaporation, while the Cu bridge was fabricated by a Joule heating evaporator. Prior to the Cu evaporation, a careful Ar ion beam milling with a beam current of 12 mA and beam voltage of 600 V was performed for 30 seconds to clean the surfaces of Py and NiPd wires and to obtain highly transparent contacts.
References
- (1) Jedema, F. J., Heersche, H. B., Filip, A. T., Baselmans, J. J. A. & van Wees, B. J. Electrical detection of spin precession in a metallic mesoscopic spin valve. Nature 416, 713-716 (2002).
- (2) Saitoh, E., Ueda, M., Miyajima, H. & Tatara, G. Conversion of spin current into charge current at room temperature: Inverse spin-Hall effect. Appl. Phys. Lett. 88, 182509 (2006).
- (3) Wunderlich, J., Kaestner, B., Sinova, J. & Jungwirth, T. Experimental observation of the spin Hall effect in a two-dimensional spin-orbit coupled semiconductor system. Phys. Rev. Lett. 94, 047204 (2005).
- (4) Dyakonov, M. I. & Perel, V. I. Current-induced spin orientation of electrons in semiconductors. Phys. Lett. A 35, 459-460 (1971).
- (5) Kato, Y. K., Myers, R. C., Gossard, A. C. & Awschalom, D. D. Observation of the spin Hall effect in semiconductors. Science 306, 1910-1913 (2004).
- (6) Valenzuela, S. O. & Tinkham, M. Direct electronic measurement of the spin Hall effect. Nature 442,176-179 (2006).
- (7) Kimura, T., Otani, Y., Sato, T., Takahashi, S. & Maekawa, S. Room-temperature reversible spin Hall effect. Phys. Rev. Lett. 98, 156601 (2007).
- (8) Uchida, K., Takahashi, S., Harii, K., Ieda, J., Koshibae, W., Ando, K., Maekawa, S. & Saitoh, E. Observation of the spin Seebeck effect. Nature 455, 778-781 (2008).
- (9) Uchida, K., Xiao, J., Adachi, H., Ohe, J., Takahashi, S., Ieda, J., Ota, T., Kajiwara, Y., Umezawa, H. Kawai, H., Bauer, G. E. W., Maekawa, S. & Saitoh, E. Spin Seebeck insulator. Nat. Mater. 9, 894-897 (2010).
- (10) Gu, B., Gan, J. Y., Bulut, N., Ziman, T., Guo, G. Y., Nagaosa, N. & Maekawa, S. Quantum renormalization of the spin Hall effect. Phys. Rev. Lett. 105, 086401 (2010).
- (11) Jan, J.-P. Effet Hall et température dans les conducteurs ferromagnétiques. Helv. Phys. Acta. 25, 677-700 (1952).
- (12) Lavine, J. M. Extraordinary Hall-effect measurements on Ni, some Ni alloys, and ferrites. Phys. Rev. 123, 1273-1277 (1961).
- (13) Kondo, J. Anomalous Hall effect and magnetoresistance of ferromagnetic metals. Prog. Theor. Phys. 27, 772-792 (1962).
- (14) Vila, L., Kimura, T. & Otani, Y. Evolution of the spin Hall effect in Pt nanowires: size and temperature effects. Phys. Rev. Lett. 99, 226604 (2007).
- (15) Niimi, Y., Morota, M., Wei, D. H., Deranlot, C., Basletic, M., Hamzic, A., Fert, A. & Otani, Y. Extrinsic spin Hall effect induced by iridium impurities in copper. Phys. Rev. Lett. 106, 126601 (2011).
- (16) Morota, M., Niimi, Y., Ohnishi, K., Wei, D. H., Tanaka, T., Kontani, H., Kimura, T. & Otani, Y. Indication of intrinsic spin Hall effect in 4d and 5d transition metals. Phys. Rev. B 83, 174405 (2011).
- (17) Murani, A. P., Tari, A. & Coles, B. R. Critical concentration for the onset of fer-romagnetism in Pd-Ni alloys. J. Phys. F: Metal Phys. 4, 1769-1781 (1974).
- (18) Liechtenstein, A. I., Katsnelson, M. I., Antropov, V. P. & Gubanov, V. A. Local spin density functional approach to the theory of exchange interactions in ferromagnetic metals and alloys. J. Magn. Magn. Mater. 67, 65-74 (1987).
- (19) Guo, G. Y., Murakami, S., Chen, T.-W. & Nagaosa, N. Intrinsic spin Hall effect in platinum: first-principles calculations. Phys. Rev. Lett. 100, 096401 (2008).
- (20) Tanaka, T., Kontani, H., Naito, M., Naito, T., Hirashima, D. S., Yamada, K. & Inoue, J. Intrinsic spin Hall effect and orbital Hall effect in 4d and 5d transition metals. Phys. Rev. B 77, 165117 (2008).
- (21) Fisher, M. E. & Langer, J. S. Resistive anomalies at magnetic critical points. Phys. Rev. Lett. 20, 665-668 (1968).
- (22) Karplus, R. & Luttinger, J. M. Hall effect in ferromagnetics. Phys. Rev. 95, 1154-1160 (1954).
Acknowledgements
We would like to thank Y. Iye and S. Katsumoto for the use of the lithography facili-ties. T.Z. also thanks the Advanced Science Research Center of the JAEA for support via the REIMEI program. This work was supported by KAKENHI and a Grant-in-Aid for Scientific Research in Priority Area from MEXT.
Author Contributions
D. W. and Y. N. designed the experiments and fabricated devices. D. W. collected the data and carried out the analysis. B. G., T. Z., and S. M. developed the theoretical analysis. B. G. developed the detailed equations in Supplementary Information. Y. O. planned and supervised the project. All authors discussed the results and commented on the manuscript.