Fractal transit networks: self-avoiding walks and Lévy flights
Abstract
Using data on the Berlin public transport network, the present study extends previous observations of fractality within public transport routes by showing that also the distribution of inter-station distances along routes displays non-trivial power law behaviour. This indicates that the routes may in part also be described as Lévy-flights. The latter property may result from the fact that the routes are planned to adapt to fluctuating demand densities throughout the served area. We also relate this to optimization properties of Lévy flights.
1 Introduction
Transit networks are fascinating objects to study. While each network and every element in the network needs to be adapted to a specific situation in the urban agglomeration, it turns out that nonetheless general construction principles prevail. The latter fact has been evidenced by numerous studies using in particular methods of statistical physics, random graph theory, and other approaches. One of the main fields contributing to this analysis is complex network science small_world ; complex (see Berche12 ; Holovatch11 for a review). Applying the tools of complex network theory it was shown, that transit networks (in this paper we consider urban public transportation networks, PTN) share common features of other natural and man-made complex networks. In particular, they are strongly correlated compact structures (so-called small worlds) small_world , that often possess power law scale-free behaviour vonFerber . It has been shown, that they are resilient against random failures while being vulnerable to targeted attacks Holovatch11 ; Berche09 . The study of fractal properties of PTN has a long history Thibault87 ; Frankhauser90 ; Benguigui91 ; Benguigui92 ; Kim03 . The prevailing part of these former studies concern the density of stations or the total length of track as function of the distance from the center of the network. In this way PTNs and rail networks of various cities and regions were analyzed. Thibault and Marchand Thibault87 studied the fractal properties of different subnetworks within Lyon (regions I,II, III). The fractal dimensions found were for the suburban rail I: 1.64, II: 1.66, III: 1.88; for the public bus service: 1.00, 1.09, 1.45; the authors also analyse the drainage utility with results: 1.21, 1.30, and 1.79. Frankhauser Frankhauser90 obtained for Stuttgart’s rail system. Benguigui and Daoud Benguigui91 obtained the fractal dimension for the Paris railway transportation network as 1.47. In relation to this result they also discuss DLA and star polymers as known models that lead to fractal structure. Further results for fractal dimensions were given by Benguigui Benguigui92 for several Rhine towns and Moscow railways: , Paris metro: . The fractal dimension of Seul PTN has been estimated as 1.50 for stations and 1.35 for tracks Kim03 . In a complementary approach, the present authors measured the mean distance as a function of number of stations traveled vonFerber . For different Berlin subnetworks a fractal dimension in the range of 1.04 – 1.22 was found. The Paris metro data leads to a fractal dimension 1.22 when excluding short distance contributions.
Some of the results cited above appear to be compatible with the interpretation of the routes as two dimensional self-avoiding walks (SAWs) with a fractal dimension of Nienhuis82 . However, the results appear to vary considerably. Here, in addition to the fractal dimension of the transit routes we intend to analyse the distributions of inter-station distances of consecutive stations. We will show that these distributions appear to have heavy (power-law) tails compatible with a Lévy-flight model for the transit routes. The latter approach further presents a possible explanation for the deviations from the SAW behaviour observed.
A Lévy-flight model is characterised by the distribution function of the step lengths of the otherwise random successive steps. For a specific Lévy-flight the complementary (the ’tail’) of the cumulative distribution function of the step lengths follows a power law decay
| (1) |
where the exponent characterises the distribution. Note that that exponents greater than 2 belong to the Gaussian Central Limit Theorem (CLT) domain of attraction due to the fact that for an exponent the probability density function (PDF) has finite variance. Exponents , however, belong to the Lévy CLT domain of attraction. The critical exponent is more delicate and requires the analysis of the growth of the associated truncated variance function.
In the following, we first describe the empirical data as they were drawn from the Berlin PTN. Then, we analyze the distribution of the inter-station distances along the routes and propose a description of PTN routes and journeys in terms of self-avoiding Lévy flights. This is supported by the fact that the scaling of distance traveled as function of the number of stations deviates from SAWs but is in line with Lévy flight-like behaviour.
2 Data analysis
PTNs are often discussed without reference to their geographical embedding. The fact that this subject is left aside by most studies of PTNs with respect to their complex network behaviour, is due mainly to the lack of easily accessible data on the locations of stations and routes. For the present work we have analyzed such data for stations of the Berlin PTN. Our database consists of 2992 stations that belong to 211 routes. Furthermore, we have taken into account different means of public transit, that include subway (U-bahn), tram, bus, and surface high speed transport (S-bahn). The data was collected in the frames of a larger project Berche12 ; vonFerber including a comparative analysis of PTN vulnerability of fourteen large cities Holovatch11 ; Berche09 . Here, we complement available information about the Berlin PTN topology by the information about the geographical location of each single station. To this end, Cartesian coordinates for each station were extracted from an on-line map provided by the Berlin public transport operator. We note that using this procedure slight deviations between distances calculated on the spherical surface and those derived from the projection to a flat surface with Cartesian coordinates occur. These will be neglected below. With the data on the topological and geographical properties of the PTN at hand we are in the position to analyze how these properties are related.
A short glance at the map of a public transport network immediately reveals that transport lines do in general not follow the shortest ”straight ahead” route between their two end points. Thus the question arises if there is any other underlying structure or principle characterizing the observed behaviour of geographically embedded transport routes. Let us analyse transport routes with respect to their fractal properties in terms of random walks, self-avoiding walks and Lévy flights. In former studies vonFerber we have analyzed the dependence of the mean square distance between stations as function of the number of stations traveled. The following power law scaling was found:
| (2) |
with the exponent ranging from for bus routes to and for subway and tram routes. The S-bahn data is distorted due to a ring structure within this sub-network. The obtained values of the exponent lie in the region . These results are to be compared with the behaviour of self-avoiding walks (SAW) in two dimensions characterised by an exponent which corresponds to the exact result for the fractal dimension of Nienhuis82 . This observation leads to the hypothesis that the PTN routes may follow SAW statistics.
a. b.
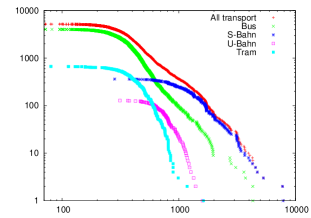
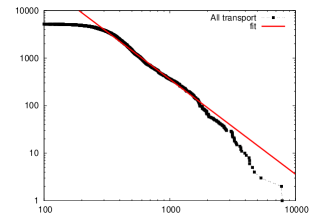
To further analyze the situation, let us explore in addition the statistics of the inter-station distances. In Fig. 1 we plot the cumulative distribution of the distances between consecutive stations along the routes showing individual curves for each mode of transport as well as an integral curve including all modes (Fig. 1a). As follows from the linear regions of the corresponding log-log plots, the region of power law behaviour does not extend much more than one order of magnitude for each single mode of transport. In the combined curve, this power law regime is expanded. The slopes and thus the corresponding exponents are very similar for the bus and S-bahn routes. As one can deduce from the plot, the contribution of tram and U-bahn to the combined curve is rather weak. In Fig. 1b we show the fit of the combined curve to the power law
| (3) |
with an appropriate exponent value . Our finding is that at least in part the distribution displays scale-free properties. In the following, we want to connect these scale-free properties observed for large scales with the behaviour of the distribution for smaller distances . To this end we project the distance vectors to the and axes and analyze the probability density functions (PDF) , . Under the hypothesis that the tails of the distributions are governed by a power law we may expect that the distributions , may be described by a Lévy -stable distribution. To fix notation we here specify the characteristic function of the -stable Lévy distribution
| (4) |
with shape, skewness, location, and scale parameters , , , and . The asymptotic behaviour of the Lévy -stable distribution function for is then given by Meyers10 :
| (5) |
This relates the exponents, . Let us emphasize that the above fit concerns the entire distribution function, and therefore it takes into account the behaviour at smaller values of . This is complementary to fitting , where only the asymptotic (complementary) behaviour is taken into account.
In Fig. 2 we fit the empirically determined PDFs , by an -stable distribution Veillette12 . The best fits are obtained for values for the -projection and for the -projection. These values are to be compared with the value of derived above. Recall that for a perfect -stable distribution the relation should hold. The latter holds in our case only approximately. While one may not expect high precision from the given data, the obtained values of and support the conjecture that the inter-station distances are governed by a non-trivial -stable distribution.


a. b.


c. d.
In further support of the fit to a Lévy-stable distribution as described above, we show in Fig. 3 the so-called percentile plots for the cumulative probability density functions (CDF) defined as:
| (6) |


a. b.


c. d.
In the light of these results, let us now re-examine the data on the end-to-end mean square inter-station distance behaviour, cf. Eq. (2). As mentioned above, the power law scaling with the exponent has originally been interpreted in terms of SAW behaviour in 2d. Note as well, that the most reliable fit was achieved for the bus subnetwork which also provides the largest data set and resulted in an exponent . Let us re-examine this value assuming as a working hypothesis a Lévy flight like behaviour for the inter-station distances. Analytical and numerical results available for self-avoiding Lévy flights show that their scaling exponents differ from the usual SAW exponents Grassberger85 . In particular, for the node-avoiding Lévy flight the exponent is known in the form of an -expansion Fisher72 ; Halley85 :
| (7) |
Flory-type arguments on the other hand lead to Grassberger85 :
| (8) |
Substituting the values , into Eq. (7) we get , , whereas following Eq. (8) we arrive at , , both compatible with the observed behaviour of the bus-subnetwork.
3 Conclusions and outlook
The present study extends previous observations of fractality within public transport routes vonFerber ; Thibault87 ; Frankhauser90 ; Benguigui91 ; Benguigui92 ; Kim03 by showing that also the distribution of inter-station distances along routes displays non-trivial power law behaviour. This indicates that the routes may in part also be described as Lévy-flights. The latter property may result from the fact that the routes are planned to adapt to fluctuating demand densities throughout the served area but also possibly related to optimisation properties Humphries10 .
One may object, that the distribution derived above mixes different means of transport with different mean inter-station distances. However, rather observing journeys of individual passengers one may acknowledge that they will in general use two or more means of transport to complete their journeys. The given combined distribution of inter-station distances allows them to perform this journey such that it resembles a Lévy flight. This may allow for travel optimization.
Self-avoiding Lévy flights, apart from observing the constraint of non self-intersection, evolve randomly. The fact that PT routes at least within the present sample appear to display the same scaling symmetry is quite unexpected. In particular, this behavior seems to be at odds with the requirement of minimizing passengers traveling time between origin and destination. The latter argument, however, ignores the time passengers spend walking to the initial and from the final stations. Including these, one understands the need for the routes to cover larger areas by meandering through neighbourhoods. Given the requirements for a PTN to cover a metropolitan area with a limited number of routes while simultaneously offering fast transport across the city one may speculate that routes scaling like self-avoiding Lévy flights may present an optimal solution Holovatch11 ; vonFerber_un .
Acknowledgments
This work was supported in part by the 7th FP, IRSES project N269139 “Dynamics and Cooperative phenomena in complex physical and biological environments”.
References
- (1) V. Latora, M. Marchiori, Physica A 314, (2002) 109; K. A. Seaton, L. M. Hackett, Physica A 339, (2004) 635.
- (2) J. Sienkiewicz, J. A. Holyst, Phys. Rev. E 72, (2005) 046127; C. von Ferber, Yu. Holovatch, V. Palchykov, Condens. Matter Phys. 8, (2005) 225; P. Angeloudis, D. Fisk, Physica A 367 (2006) 553; H. Chang, B.-B. Su, Y.-P. Zhou, D.-R. He, Physica A 383 (2007) 687; S. Derrible, C. Kennedy, Physica A 389 (2010) 3678.
- (3) B. Berche, C. von Ferber, T. Holovatch, Yu. Holovatch, Adv. Compl. Syst. 15, (2012) 1250063.
- (4) T. Holovatch, Complex Transportation Networks: Resilience, Modelling and Optimisation (Ph.D. thesis, Nancy University, France & University of Coventry, GB 2011); http://tel.archives-ouvertes.fr/tel-00652784/fr/
- (5) C. von Ferber, T. Holovatch, Yu. Holovatch, V. Palchykov, Physica A 380, (2007) 585; C. von Ferber, T. Holovatch, Yu. Holovatch, V. Palchykov, Eur. Phys. J. B 68, (2009) 261.
- (6) B. Berche, C. von Ferber, T. Holovatch, Yu. Holovatch, Eur. Phys. J. B 71, (2009) 125.
- (7) S. Thibault, A. Marchand, Re seaux et Topologie [Networks and topologies] (Institut National des Sciences Applique es de Lyon, Villeurbanne 1987). The results of this work are cited from: Y. Lu, J. Tang, Environment and Planning B 31, (2004) 895.
- (8) P. Frankhauser, L’Espace Géographique 19 (1990) 45.
- (9) L. Benguigui, M. Daoud: Geogr. Analysis 23, (1991) 362.
- (10) L. Benguigui, J. Phys. I 2, (1992) 385.
- (11) K. S. Kim, S. K. Kwan, L. Benguigui, M. Marinov, Cities, 20, (2003) 31.
- (12) B. Nienhuis, Phys. Rev. Lett. 49, (1982) 1062.
- (13) R.A. Meyers, Finance, Econometrics and System Dynamics (Springer, Berlin 2010)
- (14) M. Veillette, STBL: Alpha stable distributions for MATLAB (MATLAB Central File Exchange, 2012)
- (15) P. Grassberger, J. Phys. A 18, (1985) L463.
- (16) M.E. Fisher, S.-k. Ma, B.G. Nickel, Phys. Rev. Lett. 29, (1972) 917.
- (17) J.W. Halley, H. Nakanishi, Phys. Rev. Lett. 55, (1985) 551.
- (18) N.E. Humphries et al., Nature 465, (2010) 1066.
- (19) C. von Ferber, unpublished.