The three-dimensional geometry and merger history of the massive galaxy cluster MACS J0358.8–2955
Abstract
We present results of a combined X-ray/optical analysis of the dynamics of the massive cluster MACS J0358.8–2955 () based on observations with the Chandra X-ray Observatory, the Hubble Space Telescope, and the Keck-I telescope on Mauna Kea. MACS J0358.8–2955 is found to be one of the most X-ray luminous clusters known at , featuring erg s-1, kT = keV, , and . The system’s high velocity dispersion of (890 km s-1 when the correct relativistic equation is used), however, is inflated by infall along the line of sight, as the result of a complex merger of at least three sub-clusters. One collision proceeds close to head-on, while the second features a significant impact parameter. The temperature variations in the intra-cluster gas, two tentative cold fronts, the radial velocities measured for cluster galaxies, and the small offsets between collisional and non-collisional cluster components all suggest that both merger events are observed close to core passage and along axes that are greatly inclined with respect to the plane of the sky. A strong-lensing analysis of the system anchored upon three triple-image systems (two of which have spectroscopic redshifts) yields independent constraints on the mass distribution. For a gas fraction of 8.2%, the resulting strong-lensing mass profile is in good agreement with our X-ray estimates, and the details of the mass distribution are fully consistent with our interpretation of the three-dimensional merger history of this complex system.
Underlining yet again the power of X-ray selection, our analysis also resolves earlier confusion about the contribution of the partly superimposed foreground cluster A 3192 (). Based on very faint X-ray emission detected by our Chandra observation and 16 concordant redshifts we identify A 3192 as two groups of galaxies, separated by 700 kpc in the plane of the sky. The X-ray luminosity and mass of the two components of A 3192 combined are less than 0.5% and less than 8% of that of MACS J0358.8–2955.
keywords:
galaxy clusters: individual: MACS J0358.8–29551 Introduction
Residing and evolving at the nodes of the Cosmic Web (Bond et al., 1996), galaxy clusters represent the latest stage in the gravity-driven hierarchical growth of structure in the Universe. The assembly of clusters proceeds both continuously through the steady accretion of matter from their surroundings as well as through discrete merger events involving galaxy groups or clusters. The latter are among the most energetic events in the Universe and provide us with rare opportunities to exploit the different collisional behaviour of the cluster components (galaxies, gas, and dark matter) to study the dynamics and three-dimensional geometry of the merger. Specifically, head-on collisions of clusters result in a pronounced segregation of collisional (gas) and non-collisional matter (galaxies and dark matter) that has been used to constrain the collisional self-interaction cross section of dark matter (Markevitch et al., 2004; Bradač et al., 2008). In addition, the offset between the bulk of the gravitational mass and the bulk of the viscous mass allows us to differentiate between ram-pressure stripping and tidal effects on the evolution of galaxies in clusters (e.g., Ma et al., 2008; Ma & Ebeling, 2011). Finally, cluster mergers often constitute extremely powerful gravitational telescopes with very large Einstein radii that permit the study of distant and otherwise unobservable background galaxies (e.g., Limousin, 2007; Smith, 2009; Richard et al., 2011).
In order to identify the most dramatic mergers among truly massive clusters, a recent study by Mann & Ebeling (2012; hereafter ME12) inspected the optical and X-ray morphology of a statistical sample of over 100 highly X-ray luminous clusters at . Among the selected extreme mergers are complex and well studied systems like A 520 (Proust et al., 2000; Markevitch et al., 2005; Mahdavi et al., 2007; Girardi et al., 2008; Jee et al., 2012), A 2744 (Kempner & David, 2004; Boschin et al., 2006; Merten, 2011; Owers et al., 2011, 2012), and MACSJ0717.5+3745 (Edge et al., 2003; Ebeling et al., 2004, 2007; Ma et al., 2009; Ma & Ebeling, 2011; Bonafede, 2009; van Weeren et al., 2009; Limousin, 2012; Jauzac, 2012). While of great interest for a variety of reasons, these systems do, however, not match the simple Binary, Head-On Merger (BHOM, ME12) morphology that is most likely to permit a reconstruction of the merger history and cluster trajectories. Focusing on BHOM candidates, ME12 lists 17 clusters that meet their X-ray/optical selection criteria. Of the 11 primary candidates, several are again well known111Among them MACSJ0025.4–1222 (Ebeling et al., 2007; Bradač et al., 2008; Ma et al., 2010), as well as A 1758 (Okabe & Umetsu, 2008; Durret et al., 2011; Ragozzine et al., 2012) and A 2146 (Russell et al., 2010; Russell, 2011, 2012)., while the merger dynamics of others have only recently been unraveled (MACSJ0140.0–0555; Ho, Ebeling, & Richard 2012). We focus here on MACS J0358.8–2955, a system from ME12’s list of seven secondary BHOM candidates.
Our paper is structured as follows. Section 2 introduces MACS J0358.8–2955, the target of this study. Section 3 summarises our observations and data reduction procedures at X-ray and optical wavelengths. Section 4 describes our analysis in detail and presents results. In Section 5 we discuss the results and their implications for the physics of the merger, and a summary is given in Section 6. Finally, we derive and discuss, in an appendix, the properties of the superimposed foreground cluster A 3192. Throughout this paper, we assume the concordance CDM cosmology with , , and , for which 1″ corresponds to 5.65 kpc at the cluster redshift of (additional galaxy redshifts obtained by us for this work – see Section 4.6 – led to a slight revision of the cluster redshift published by us before).
2 MACS J0358.8–2955
Based on an X-ray detection in the ROSAT All Sky Survey (RASS, Voges 1999) MACS J0358.8–2955 was discovered in the course of the Massive Cluster Survey (MACS, Ebeling et al. 2001) and classified as an optically disturbed system at based on 13 spectroscopic redshifts (Ebeling et al., 2010). The same RASS X-ray source was previously erroneously identified as A 3192 (a nearby foreground cluster at ) by the REFLEX cluster survey (Böhringer, 2004). Owing to the same misidentification, this presumed nearby cluster was also included in the LoCuSS (e.g., Smith & Taylor 2008) sample of clusters at . Consistent with our assessment, a recent weak-lensing study based on an HST snapshot image, combined with groundbased observations, found MACS J0358.8–2955 to dominate the mass distribution within 250 kpc of the RASS X-ray position (Hamilton-Morris et al., 2012).
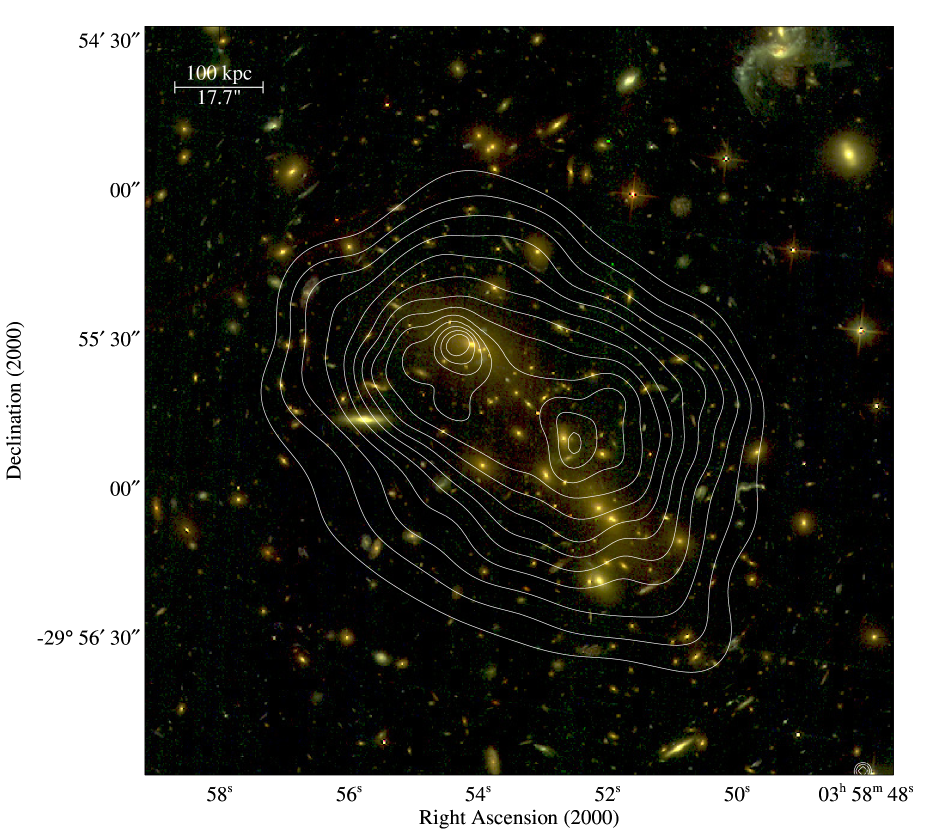
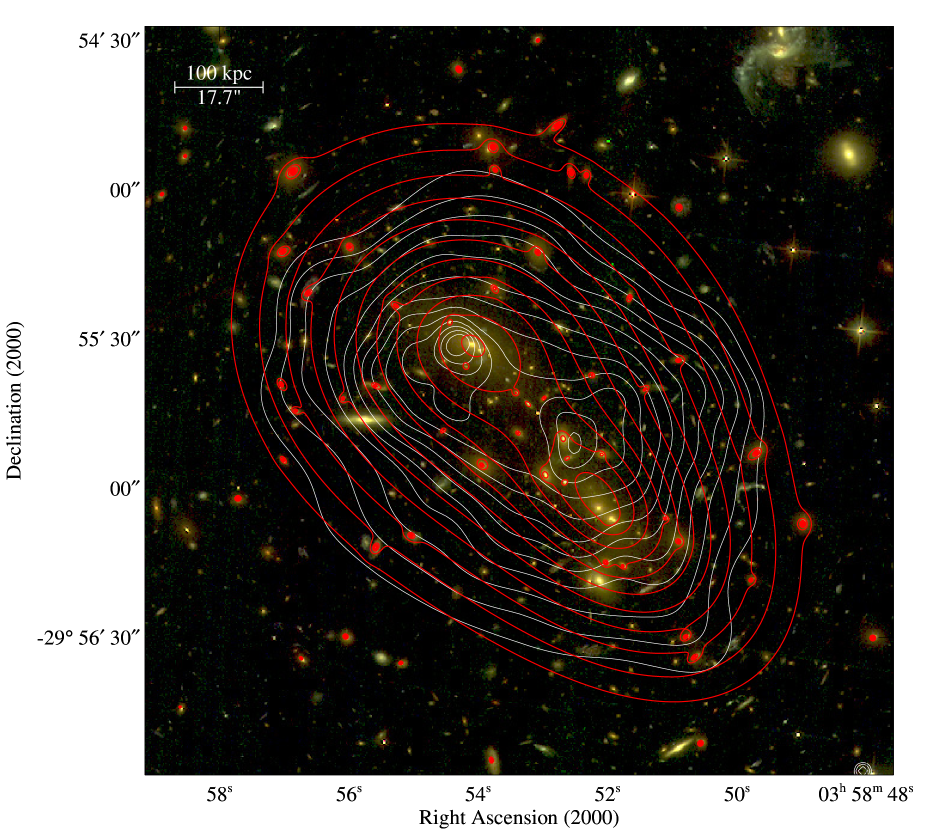
Figure 1 shows an overlay of the X-ray emission observed with Chandra onto the optical image of the system obtained by us with HST (see Section 3 for observational details). The foreground system A 3192 is clearly discernible in the form of several bright galaxies, mainly north-west of MACS J0358.8–2955; its contribution to the observed X-ray emission is negligible. We here use the optical and X-ray data shown in Fig. 1 to characterise the dynamical state, three-dimensional morphology, and merger history of all three components of this complex merger (gas, galaxies, and dark matter).
3 observation and data reduction
3.1 X-ray data
MACS J0358.8–2955 was observed three times with the Advanced CCD Imaging Spectrometer (ACIS, Garmire et al. 2003) aboard the Chandra X-ray Observatory: in October 2009 (9.7 ks; ObsID 11719) and November 2010 (29.7 ks; ObsID 12300, and 20.0 ks; ObsID 13194). All observations were performed in VFAINT mode. We reduced the data following standard Chandra data reduction procedures222http://cxc.harvard.edu/ciao/index.html using CIAO 4.4 and CALDB 4.4.8. For the spatial analysis, we merged the three events files after proper alignment. The spectral fitting, on the other hand, was performed separately but simultaneously on the three event files. Point sources were excluded in both spatial and spectral fits.
In order to avoid instrumental artefacts due to position-dependent charge transfer inefficiency, we did not measure the background from an off-source region of our observed datasets, but instead used appropriately scaled ”blank-sky” backgrounds drawn from the calibration database CALDB. The background datasets were then merged for the spatial analysis, but dealt with separately during the spectral fitting.
3.2 Optical data
3.2.1 Hubble Space Telescope imaging
MACS J0358.8–2955 was observed on February 19, 2011 in the F435W, F606W and F814W filters with the Advanced Camera for Surveys (ACS, Giavalisco 2004) aboard the Hubble Space Telescope for 4500, 2120, and 4620 seconds respectively (GO-12313, PI: Ebeling). At the field of view of ACS’ Wide Field Channel (3.5 3.5 arcmin2) corresponds to approximately 1.2 1.2 Mpc2. Charge Transfer Efficiency (CTE) corrections were applied to the data using the pixel-based CTE correction code developed by Anderson & Bedin (2010) before further reduction. Bad-pixel masking, geometric distortion correction, cosmic ray rejection, image stacking, and resampling were performed on the flat-fielded images using the MultiDrizzle program (Koekemoer et al., 2002). An optimised resampling scale of 0.03”, a Gaussian drizzle kernel, and pixfrac = 0.8 were used to avoid aliasing in the point spread function (Rhodes, 2007).
Essentially the same field had been observed with ACS already in December 2006 in the F606W filter as part of GO-10881 (PI: Smith), a snapshot programme targeting clusters at . MACS J0358.8–2955 was erroneously included in this programme due to confusion with the foreground cluster A 3192 (). The relative locations, X-ray luminosities, and masses of MACS J0358.8–2955 and A 3192 are discussed in more detail in an Appendix to this paper.
3.2.2 Groundbased spectroscopy
Likely cluster members as well as potential strong-lensing features in MACS J0358.8–2955 were targeted with the Low Resolution Imaging Spectrograph (LRIS, Oke 1995; Rockosi 2010) on the Keck-I telescope on Mauna Kea in January 2010, November 2011, and December 2011. With the 600 line/mm grating blazed at 7500 Å on the red side of the spectrograph, the 6800 Å dichroic as a beam splitter, and the 300/5000 grism on the blue side, a total of six multi-object spectroscopy masks targeting 84 unique objects were observed for exposure times ranging from 3600 s for galaxies to 31800 s for strong-lensing features. Standard data reduction procedures including bias subtraction, flat-fielding, sky subtraction and wavelength calibration were performed before the extraction of one-dimensional spectra for each object.
4 Data analysis and results
4.1 X-ray spatial modeling
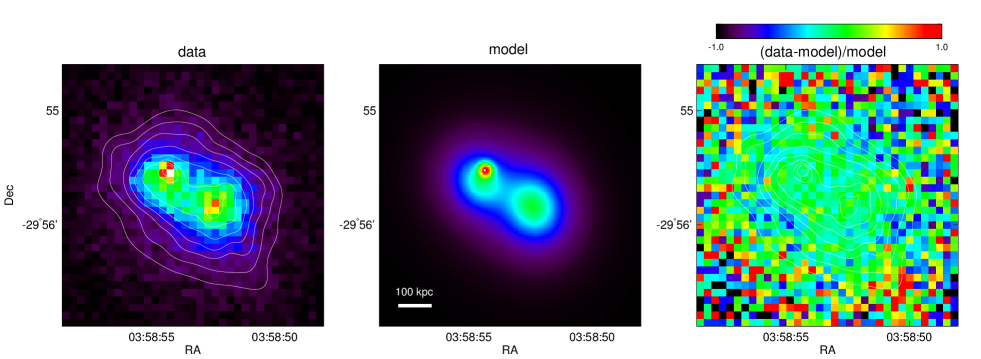
The X-ray surface brightness distribution of MACS J0358.8–2955 (Fig. 1) shows two distinct and well separated peaks, embedded in a common halo, as well as an extremely compact core in the north-eastern (NE) component. We therefore attempt to parametrize the observed emission with a three-component model comprised of two elliptical -models for the two sub-clusters and one spherical 2-D Gaussian model for the compact core. A constant, given by the average value of the exposure-corrected, merged blank-sky image, is added to account for background emission. The surface brightness profile of each -model is described by
| (1) | |||||
where x and y are aligned with the major and minor axes of the ellipse, is the ellipticity, is the projected radius on the sky, is the core radius, is the central surface brightness, and is the power index.
Acknowledging the small number of X-ray photons detected at larger cluster-centric radii, we use the Cash statistic during the fit; unlike for , the goodness of fit can not be quantified. Fig. 2 shows the data, our model, and the fit residuals, and demonstrates that our model provides an adequate description of the observed emission. The best-fit parameters are given in Table 1.
| 11ellipticity , where a and b are the major and minor axis, respectively. | ||||
|---|---|---|---|---|
| kpc | photon cm-2 s-1 arcsec-2 | |||
| 99.7 | 4.48 10-7 | 0.11 | 126.9∘ | 0.73 |
| kpc | photon cm-2 s-1 arcsec-2 | |||
| 128.2 | 5.11 10-7 | 0.13 | 109.3∘ | 0.84 |
| FWHM | ||||
| kpc | photon cm-2 s-1 arcsec-2 | |||
| 35.3 | 6.25 10-7 | |||
4.2 X-ray spectral modeling
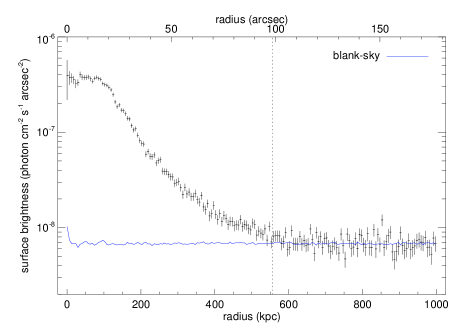
In order to determine a suitable region for the extraction of photons for X-ray spectroscopy, we perform a second spatial fit to the surface-brightness distribution, this time using a single 2-D -model. A radial surface-brightness profile is then extracted using the best-fit centre of this model as the centre position, as shown in Fig. 3.
From this profile, we determine the radius at which the surface-brightness profile becomes statistically indistinguishable from the blank-sky background. At Mpc (98.4′′), the signal-to-noise ratio (S/N) of the global cluster emission is maximised, such that extending any measurement to larger radii would predominantly add background.
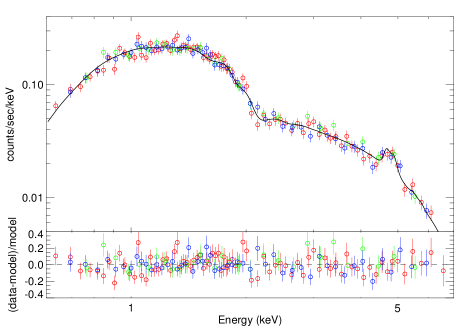
Within this radius, we measure a total of 17200 net photons and 1990 background photons in the 0.5–7.0 keV band. All spectral fits are performed in Sherpa (Freeman et al., 2001), using the plasma model of Mewe et al. (1985) combined with the photoelectric absorption model of Morrison & McCammon (1983). Fits are performed simultaneously on the three datasets, using statistics. Of the five fit parameters, we freeze two, namely the cluster redshift (set to ), and the absorption which we fix at the Galactic value of cm-2 (Dickey & Lockman, 1990). Fitting for the remaining three model parameters, we find a global temperature of keV, a metal abundance of , and an unabsorbed X-ray flux of erg s-1 cm-2 in the quoted energy band. The data, best-fitting model, and residuals are shown in Fig. 4; the goodness of fit as quantified by per degree of freedom is 0.80. Thawing the absorption leads to a best-fit value of cm-2 which is fully consistent with the Galactic value; all other best-fit values are also unchanged within their 1 errors. In order to explore whether multi-phase gas is present, we also perform a fit with a two-component plasma model. The resulting best-fit results are indistinguishable from the ones obtained with a single-phase model, as the best-fit amplitude of the second component is negligible. Finally, we also fit for the cluster redshift and measure from the redshifted 7 keV Fe line clearly visible in Fig. 4, in excellent agreement with the value derived from optical galaxy spectroscopy.
The rest-frame X-ray luminosity of the cluster within the region selected for X-ray spectroscopy is measured to be erg s-1, erg s-1, erg s-1, and erg s-1 in the 0.5–7.0 keV, 0.1–2.4 keV, 2–10 keV, and bolometric passbands, respectively. The quoted uncertainties are the nominal 1 errors propagated from the errors of the temperature and normalisation of the spectral fit. We can extrapolate these luminosities to larger radii using the best-fit spatial model. From the X-ray temperature333We here use the “core-excised” temperature of keV, determined within a radius of 98.4” but excluding regions 1, D, and E defined in Section 4.4., we estimate , , and using the formula in Arnaud et al. (2002),
Here = 1.05 is the normalisation of the virial relation, i.e., , and with being the desired overdensity. Setting to 500, 1000, and 2500 yields Mpc (239′′), Mpc (169′′), and Mpc (107′′). Our measurement aperture of Mpc (98′′) corresponds to .
Using the best model from our two-dimensional fit to the spatial data we thus find of erg s-1, erg s-1, erg s-1, and erg s-1 for the for 0.5–7.0 keV, 0.1–2.4 keV, 2–10 keV and bolometric passbands, respectively.
4.3 Gas mass and total mass
The normalisation factor of the spectral fit and the best-fit spatial model allow us to estimate the total X-ray gas mass within a given region. The normalisation of the mekal model is given by
| (3) |
where the emission measure, , can be written as
| (4) |
and the gas mass is given by
| (5) |
Here is the proton mass, = 1.347, and = 0.852 for an ionized plasma with a metallicity of 0.3 of the solar value (Arnaud et al., 2002).
We deproject the surface-brightness distribution determined by the spatial model in Section 4.1 to a three-dimensional gas density profile
| (6) | |||||
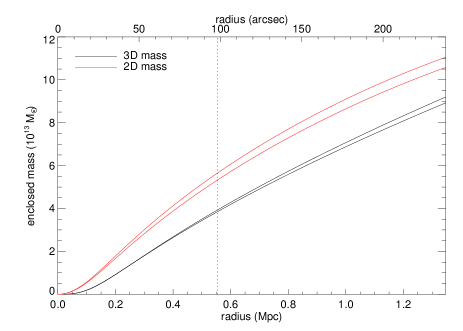
where x and y are aligned with the major and minor axes of the ellipse projected on the plane of the sky, z is along our line of sight, and , are the corresponding ellipticities. We can then numerically integrate the right-hand side of Eqn. 3 to obtain the central density (and ) of each of the three spatial components. For the deprojection, however, we need to assume a geometry for the gas distribution along the line of sight. We assume that the two elliptical gaseous halos of our best-fit 2D spatial model are projections of 3D spheroids which have two of their three axes of symmetry lying in the plane of the sky. Fig. 5 shows the resulting gas mass for the two extreme cases of oblate and prolate geometries (corresponding to and , respectively) as a function of radius444We adopt a density cutoff at , the approximate virial radius.. The total 3D gas mass derived within is for oblate and for prolate geometries, respectively. For the 2D masses, these values increase to and . The quoted uncertainties are the nominal 1 errors propagated from the spatial and spectral fit results. Combining the mass ranges for the two geometries, we find .
An estimate of the total gravitational mass can be derived from the gas mass by assuming a value for the gas mass fraction. The latter depends, however, on the radius from the cluster centre as well as on the total cluster mass (or via proxy its gas temperature), and is also known to vary considerably between clusters. Average values of are found for groups of galaxies (Sun, 2012), rising to 0.13 for the most massive clusters (Vikhlinin, 2009), with a scatter of typically for individual clusters of comparable mass (Sun, 2012). A detailed analysis of a disturbed, optically selected cluster of intermediate mass by David et al. (2012), for instance, yields relatively low values of and , respectively, possibly due to the ongoing merger.
We here use an estimate of for MACS J0358.8–2955 to convert gas mass to total gravitational mass, a value that is derived from a comparison of the radial profile of the gas mass with that of the total mass derived from our strong-lensing analysis of the system (see Section 4.7). We thus find . The corresponding 2D masses are , and . All errors include only statistical and modeling uncertainties.
4.4 X-ray temperature map
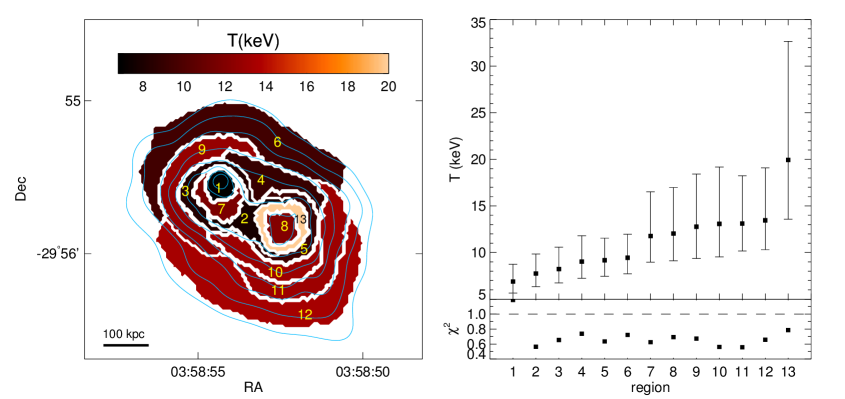
In order to explore temperature variations across the emission region, we first define sub-regions using the “contour binning” algorithm (contbin, Sanders 2006) for a given S/N, and then perform spectral fits for each region. These fits follow the prescription provided in Section 4.2 except that the metal abundance is fixed at a value of 0.3, a typical value of clusters, leaving only the gas temperature and the normalisation as free parameters. Requiring a S/N of at least 30, corresponding to typically at least 940 net photons in each region, yields the temperature map shown in the upper left panel of Fig. 6. We then follow the approach described in Ma et al. (2009) and merge adjacent regions that exhibit similar temperatures. A new set of spectral fits is performed on these larger regions with improved photon statistics to obtain new maps with lower resolution but higher fidelity.
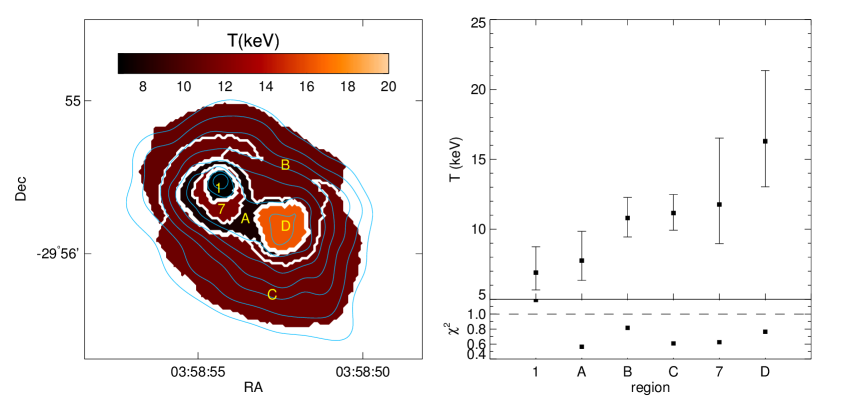
The middle panels of Fig. 6 show the results of the third iteration in which adjacent regions of similar temperature have been merged twice. Region D in the middle panel deserves a special note. It results from the merging of regions 8 and 13 in the top panels which were combined because their temperatures are in fact consistent within the large errors. However, the large uncertainty of the temperature measured for the merged region strongly suggests the presence of multi-phase gas. A large uncertainty in the best-fit temperature is also seen for region 7 (both top and middle panels) which is not merged with any other adjacent region. The photon statistics in both region 7 and region D are, however, insufficient to constrain a two-temperature model.
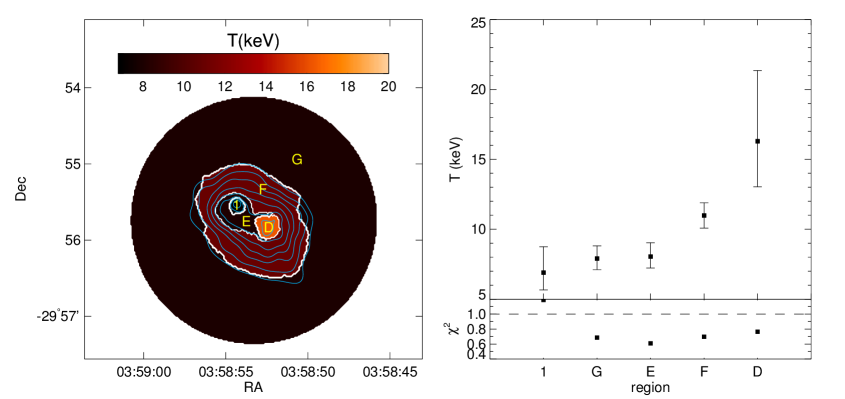
The bottom panels of Fig. 6, finally, show the temperature distribution obtained when this procedure of merging adjacent regions of similar temperature is applied further. Here we combine the two ambient regions labeled B and C, as well as the regions labeled 7 and A. In addition, we also show in these panels a region inside our large-scale spectral aperture (see Section 4.2), but outside the regions labelled in the remainder of this figure. The right-hand panels show that the differences between the best-fit gas temperatures of the NE sub-cluster (1), the SW sub-cluster (D), and the ambient region (F) are statistically significant.
4.5 Putative cold fronts
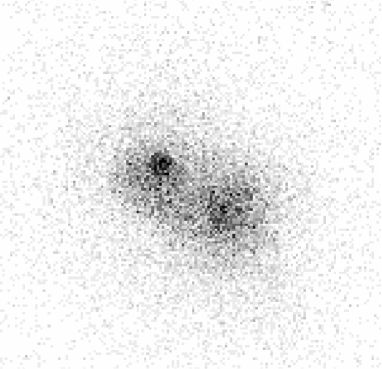
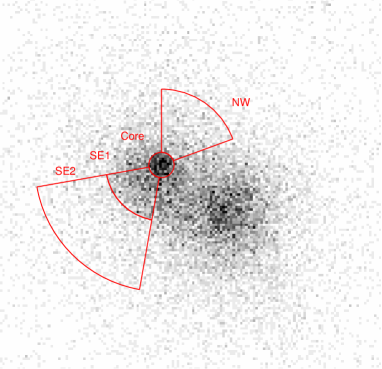
Visual inspection of our X-ray image of MACS J0358.8–2955 suggests the presence of two surface-brightness discontinuities in the NE region of the cluster. One is at the north-western side of the compact core in the NE cluster; the other one is at the south-eastern side of the same sub-cluster. The clear excess of the X-ray emission in this core region over the -model describing the NE cluster on larger scales (Section 4.1 and Fig. 2) in conjunction with the low ICM temperature of about 7 keV measured there (Fig. 6) identify this feature as a likely cool core. To allow our readers to convince themselves of the plausibility of the proposed discontinuities on either side of the potential cool core, we show in Fig. 7, side by side, the raw data and the raw data with four regions (Core, NW, SE1 and SE2) marked that we define to measure the temperature changes across the surface brightness edges.
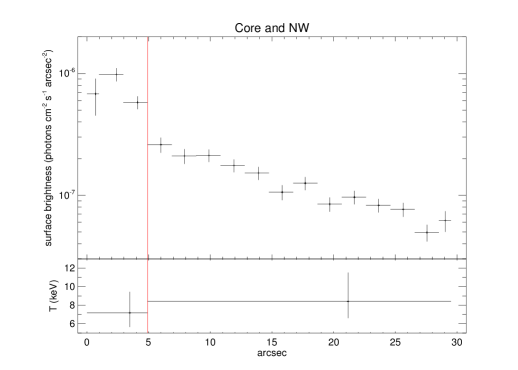
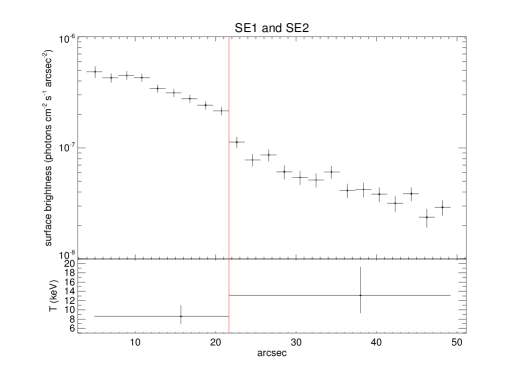
The measured surface-brightness and temperature distributions across the two putative fronts are shown in Fig. 8. We find a surface-brightness discontinuity that is significant at the 3.0 and 3.3 confidence level, respectively. The photon statistics are, however, not good enough to tightly constrain the gas temperature locally on either side of these discontinuities. Given that, for both fronts, the best-fit temperature is slightly lower on the denser side, consistent with pressure equilibrium across the feature, we propose that these two fronts are cold fronts.
| R.A. | Dec. | z | R.A. | Dec. | z | ||||||||
| 03 | 58 | 45.424 | -29 | 55 | 24.03 | 0.3375 | 03 | 58 | 53.783 | -29 | 55 | 20.08 | 0.5113 |
| 03 | 58 | 46.140 | -29 | 55 | 32.77 | 0.4245 | 03 | 58 | 53.783 | -29 | 54 | 56.30 | 0.4201 |
| 03 | 58 | 47.693 | -29 | 57 | 8.90 | 0.4362 | 03 | 58 | 53.966 | -29 | 55 | 55.64 | 0.4749 |
| 03 | 58 | 47.886 | -29 | 56 | 29.94 | 0.4210 | 03 | 58 | 54.029 | -29 | 54 | 49.50 | 0.5150 |
| 03 | 58 | 49.004 | -29 | 56 | 7.22 | 0.4273 | 03 | 58 | 54.127 | -29 | 55 | 31.41 | 0.4340aaThe north-eastern BCG |
| 03 | 58 | 49.685 | -29 | 55 | 59.58 | 0.4423 | 03 | 58 | 54.206 | -29 | 54 | 51.43 | 0.2380 |
| 03 | 58 | 49.890 | -29 | 26 | 43.43 | 0.2178 | 03 | 58 | 54.630 | -29 | 57 | 57.17 | 0.3948 |
| 03 | 58 | 50.541 | -29 | 56 | 51.34 | 0.4209 | 03 | 58 | 54.856 | -29 | 55 | 55.37 | 1.262 bbThe triple system A |
| 03 | 58 | 50.673 | -29 | 56 | 34.12 | 0.4220 | 03 | 58 | 52.400 | -29 | 55 | 23.77 | multiplebbThe triple system A |
| 03 | 58 | 50.774 | -29 | 56 | 29.92 | 0.4207 | 03 | 58 | 53.553 | -29 | 55 | 38.36 | multiplebbThe triple system A |
| 03 | 58 | 50.902 | -29 | 55 | 34.28 | 0.4288 | 03 | 58 | 55.172 | -29 | 56 | 35.38 | 0.4308 |
| 03 | 58 | 50.991 | -29 | 55 | 42.03 | 0.2171 | 03 | 58 | 55.589 | -29 | 55 | 39.67 | 0.4346 |
| 03 | 58 | 51.350 | -29 | 56 | 20.18 | 1.537ddThe gravitational arc D | 03 | 58 | 55.995 | -29 | 55 | 11.71 | 0.4400 |
| 03 | 58 | 51.744 | -29 | 57 | 16.82 | 0.4287 | 03 | 58 | 56.092 | -29 | 57 | 26.17 | 0.4329 |
| 03 | 58 | 51.751 | -29 | 54 | 19.27 | 0.4241 | 03 | 58 | 56.630 | -29 | 55 | 21.08 | 0.2704 |
| 03 | 58 | 51.814 | -29 | 57 | 35.58 | 0.4331 | 03 | 58 | 56.681 | -29 | 55 | 30.63 | 0.4384 |
| 03 | 58 | 51.827 | -29 | 53 | 28.99 | 0.3380 | 03 | 58 | 56.904 | -29 | 54 | 56.83 | 0.4237 |
| 03 | 58 | 52.017 | -29 | 56 | 15.04 | 0.4230 | 03 | 58 | 56.947 | -29 | 55 | 31.43 | 0.4332 |
| 03 | 58 | 52.138 | -29 | 54 | 21.98 | 0.3383 | 03 | 58 | 57.024 | -29 | 55 | 12.73 | 0.4354 |
| 03 | 58 | 52.170 | -29 | 56 | 4.27 | 0.4233 | 03 | 58 | 57.127 | -29 | 55 | 18.88 | 0.3947 |
| 03 | 58 | 52.316 | -29 | 56 | 19.04 | 0.4210 | 03 | 58 | 57.158 | -29 | 54 | 47.47 | 0.4382 |
| 03 | 58 | 52.359 | -29 | 56 | 58.60 | 0.4312 | 03 | 58 | 57.181 | -29 | 54 | 2.58 | 0.4176 |
| 03 | 58 | 52.575 | -29 | 54 | 56.63 | 0.4341 | 03 | 58 | 57.298 | -29 | 55 | 10.10 | 0.4319 |
| 03 | 58 | 52.687 | -29 | 56 | 11.13 | 3.07ccThe triple system B | 03 | 58 | 57.479 | -29 | 54 | 12.71 | 0.4338 |
| 03 | 58 | 52.959 | -29 | 56 | 11.56 | multipleccThe triple system B | 03 | 58 | 57.975 | -29 | 54 | 30.55 | 0.4342 |
| 03 | 58 | 50.097 | -29 | 55 | 22.94 | multipleccThe triple system B | 03 | 58 | 58.179 | -29 | 53 | 49.26 | 0.1886 |
| 03 | 58 | 52.691 | -29 | 55 | 50.11 | 0.4186 | 03 | 58 | 58.366 | -29 | 55 | 38.04 | 0.4233 |
| 03 | 58 | 52.785 | -29 | 55 | 27.98 | 0.4172 | 03 | 58 | 58.539 | -29 | 54 | 48.05 | 0.4198 |
| 03 | 58 | 52.977 | -29 | 55 | 41.94 | 0.4292 | 03 | 58 | 58.538 | -29 | 54 | 53.66 | 0.4342 |
| 03 | 58 | 52.989 | -29 | 55 | 57.62 | 0.4306 | 03 | 58 | 58.887 | -29 | 54 | 7.84 | 0.5542 |
| 03 | 58 | 53.605 | -29 | 57 | 4.52 | 0.4204 | 03 | 58 | 59.447 | -29 | 54 | 46.63 | 0.4616 |
| 03 | 58 | 53.780 | -29 | 54 | 51.59 | 0.5127 | 03 | 58 | 59.726 | -29 | 56 | 21.95 | 0.4320 |
| R.A. | Dec. | z | R.A. | Dec. | z | ||||||||
|---|---|---|---|---|---|---|---|---|---|---|---|---|---|
| 03 | 58 | 44.513 | -29 | 55 | 46.02 | 0.1750 | 03 | 58 | 51.463 | -29 | 57 | 5.51 | 0.1670 |
| 03 | 58 | 46.572 | -29 | 57 | 2.05 | 0.1724 | 03 | 58 | 51.819 | -29 | 53 | 46.38 | 0.1657 |
| 03 | 58 | 47.183 | -29 | 56 | 59.43 | 0.1690 | 03 | 58 | 53.788 | -29 | 57 | 46.49 | 0.1666 |
| 03 | 58 | 50.901 | -29 | 56 | 52.17 | 0.1634 | 03 | 58 | 57.644 | -29 | 54 | 4.27 | 0.1610 |
| 03 | 58 | 51.165 | -29 | 54 | 13.56 | 0.1730 | 03 | 58 | 58.092 | -29 | 54 | 26.61 | 0.1697 |
4.6 Spectroscopic redshifts
Spectroscopic redshifts of galaxies are determined by cross-correlation between reduced 1-D spectra and spectral templates provided in the IDL routine SpecPro developed by Masters & Capak (2011). The exception are three lensed background galaxies and two emission-line galaxies for which we determine redshifts by identifying emission lines. Based on the measured redshifts we identify 41 cluster members with redshifts between 0.4172 and 0.4423, 20 foreground objects, and 9 background objects, three of which are the gravitational arc and multiple systems discussed in more detail in Section 4.7. Ten of the foreground galaxies have redshifts that identify them as members of the foreground cluster A 3192 at . The redshifts of these ten galaxies in A 3192 are listed in Table 3; all others are tabulated in Table 2.
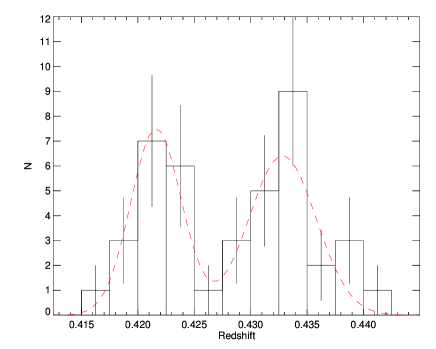
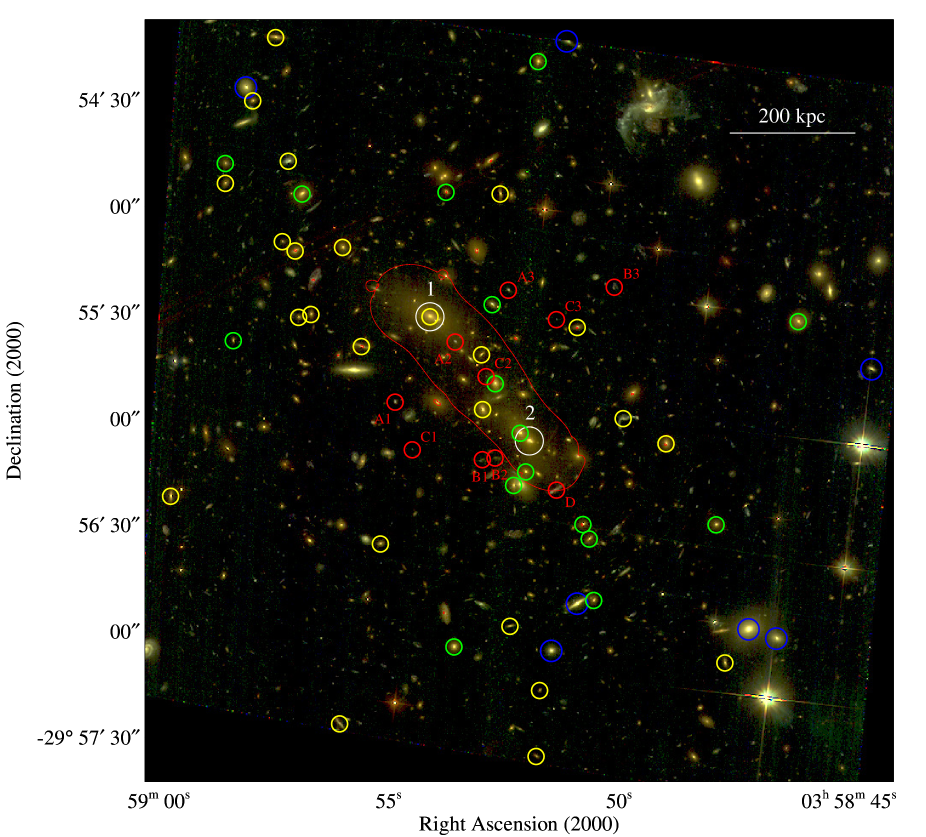
We calculate a mean cluster redshift of and a large radial velocity dispersion of . A histogram of the cluster galaxies is shown in Fig. 9. The distribution is clearly bimodal and well described by a double-Gaussian with velocity dispersions555In keeping with results presented in the literature all velocity dispersions quoted in this Section lack relativistic corrections. The latter become, however, highly significant already at . Applying the correct relativistic conversion between redshift and radial velocity leads to greatly reduced values of 892 km s-1 for the overall velocity dispersion, and 295 and 383 km s-1 for the two components, respectively. of () km s-1 and () km s-1 centred on systemic redshifts of and , respectively. To investigate the spatial distribution of the galaxies from the two components, we split the sample at . Fig. 10 illustrates the correlation between the spectroscopic redshifts of galaxies and their positions on the sky, in which yellow and green circles are the cluster galaxies at and , respectively, red circles are the multiple systems, and blue circles are the members of A 3192. Galaxies in the NE of MACS J0358.8–2955 tend to have higher redshifts than those in the SW region.
4.7 Strong gravitational lensing
4.7.1 Strong-lensing features
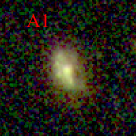
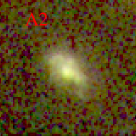
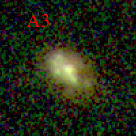
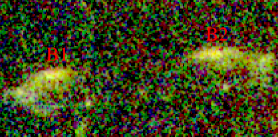
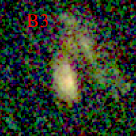
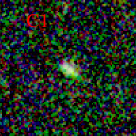
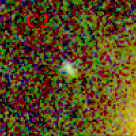
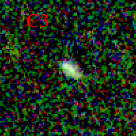
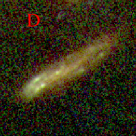
From the HST/ACS image shown in Fig. 10 we identify three multiple-image systems (A, B, C) from their matching colours and morphologies, as well as one extended arc-shaped source (D). Close-ups of all images are shown in Fig. 11. Spectroscopic redshifts were obtained for A1 and B1 with Keck-I/LRIS as detailed in Section 4.6. System B was independently proposed as a multiple-image set (but not spectroscopically confirmed) by Hamilton-Morris et al. (2012, their system A1).
System A () has an irregular morphology, the features of which are readily recognisable in all three images (Fig. 11). System B is a clear symmetric pair with a spectroscopic redshift of , for which our best lensing model (described in detail below) predicts a third, fainter, counter-image B3 at , (J2000). This position is quite different from the one predicted by Hamilton-Morris et al. (2012), which is rejected at more than confidence by our improved model. System C is a faint, blue, and compact system of three images for which we could not secure a spectroscopic redshift. However, it is fully compatible with our best lensing model. Finally, we measured a spectroscopic redshift of for the bright arc D; from our model, we expect no counter-images and none are observed.
4.7.2 Mass model
We use the strong-lensing features described in the previous section to constrain a parametric mass model for the cluster using the Lenstool666Publicly available at http://projets.oamp.fr/projects/lenstool software (Jullo et al., 2007). Both very extended (cluster-scale) and compact (galaxy-scale) mass components are included and parameterised as pseudo-isothermal elliptical mass distributions (PIEMD), similarly to the approach taken by, e.g., Limousin (2007) and Richard et al. (2009). The parameters of all galaxy-scale mass distributions are fixed based on their properties as compiled in our photometric catalog of cluster members, i.e., we use the geometric parameters of their light profiles and assume that light traces mass.
We start the modeling process with a single cluster-scale component, allowed to move freely across the ACS field of view. This model fails to reproduce the geometry of system A whose three images are almost perfectly aligned. Since such a configuration is typical of a “saddle” between two massive large-scale components, we next attempt to satisfy the lensing constraints with a model comprised of two cluster-scale halos whose positions are allowed to vary within 15″of each of the two main light peaks (1 and 2, Fig. 10). This model reproduces all three multiple-image systems A, B, and C with a root-mean-square (rms) positional uncertainty of less than . Image D is predicted to be a single arc. The model also predicts a counter-image of the image pair B1/B2 within a small region which is indeed found to contain a plausible candidate (B3 in Fig. 11). Whether or not this third image is included as an additional constraint does, however, not change the best-fit model. The best-fit parameters of our strong-lensing mass model of MACS J0358.8–2955 are summarised in Table 4. Although the strong-lensing features in MACS J0358.8–2955 primarily constrain the mass distribution on the whole, our model strongly prefers an inequitable mass distribution between the two cluster-sized halos, with the NE component being the more massive one.
For completeness’ sake we note that Hamilton-Morris et al. (2012) propose an additional pair of images, located between our multiple-image sets B and C, as another strong-lensing system. Lacking spectroscopic redshifts, these two images do not add any additional constraints to the model. Moreover, their morphologies and colours do not fully agree, and we are unable to identify a plausible candidate for the required counter-image. For these reasons we consider this identification questionable and choose not to include this system in our model.
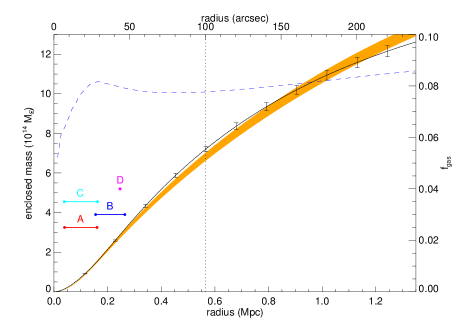
Fig. 12 shows the lensing-mass profile for the entire system, centred at the same location as the X-ray gas mass profile presented in Fig. 5. Dividing the gas mass profile by the profile of the total lensing mass yields the gas mass fraction as a function of radius, shown as the dashed blue line in Fig. 12. At small radii the resulting gas mass fractions have little physical meaning since both profiles are centred on a location that falls between the two cluster components. At larger radii, the gas mass fraction is approximately constant, rising only slightly from 8 to 8.5%. This value implies a baryon fraction of about 9% which is at the low end of the observed range and possibly an effect of the ongoing merger activity in MACS J0358.8–2955 (David et al., 2012).
Fig. 13 shows contours of the total mass as determined from our strong-lensing analysis overlaid on the data shown before in Fig. 1. The offset between the X-ray and mass contours seen in Fig. 13 for the SW sub-cluster will be discussed in Section 5.2.
| Potential | X | Y | rcore | rcut | |||
|---|---|---|---|---|---|---|---|
| [″] | [″] | [deg] | [kpc] | km s-1 | [kpc] | ||
| NE | 2.11.1 | 0.651.0 | 0.140.06 | 1575 | 111032 | [1000] | |
| SW | 26.00.5 | 30.90.6 | 0.470.04 | 1262 | 81330 | [1000] |
5 Discussion
5.1 Cluster scaling relations
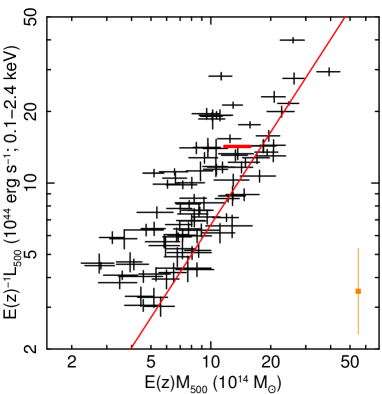
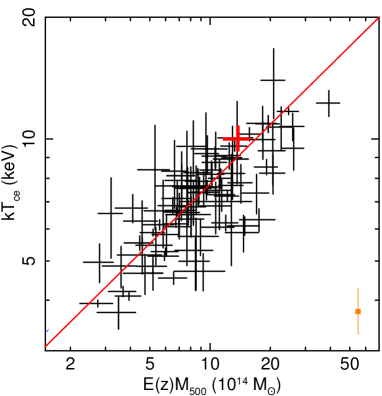
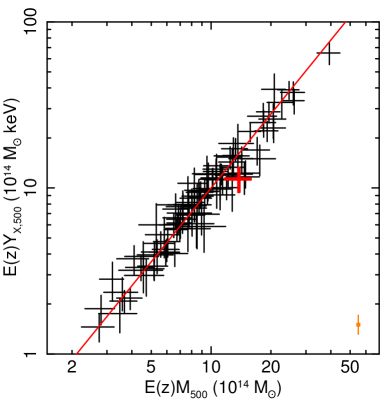
To further assess the effects of merger activity within MACS J0358.8–2955 we compare the system’s global X-ray properties to the averages provided by the , k, and scaling relations of Mantz et al. (2010). Our estimate of the total mass of , the global 0.1–2.4 keV luminosity of erg s-1, and the core-excised temperature of 10.0 keV fall within the scatter of all three scaling relations. Fig. 14 shows both the X-ray luminosity and the global gas temperature of MACS J0358.8–2955 to be slightly high compared to the best-fit predictions based on the cluster’s mass. This is consistent with a mild boost in both quantities as a result of the ongoing merger. A more pronounced increase in temperature and luminosity as seen in numerical simulations of head-on cluster collisions (e.g. Randall et al., 2002) is not expected for a merger proceeding at non-zero impact parameter like MACS J0358.8–2955.
5.2 Three-dimensional merger dynamics and geometry
Cold fronts originate when regions of cool, dense gas move subsonically through a less-dense and hotter medium. We refer to Markevitch & Vikhlinin (2007) for an excellent review of the related physical and observational phenomena. In brief, depending on the impact parameter of the encounter and the viewing geometry, we may observe a single, or two cold fronts. Dual cold fronts, one much more compact and pronounced than the other, are observed when “sloshing” is induced in the cool core of a cluster as the result of the passage of a massive perturber, which is in general another cluster (see Ma et al. 2012 for a study of one such case).
The presence of two likely cold fronts in MACS J0358.8–2955, discussed in Section 4.5, strongly suggests that we are observing a massive cluster merger after its first core passage. This insight has important implications for our interpretation of the three-dimensional merger trajectory and history, as detailed in the following.
Our imaging and spectroscopic analysis at both optical and X-ray wavelengths confirms the primary hypothesis of ME12 that MACS J0358.8–2955 is an active merger of (at least) two sub-clusters. Spectroscopic galaxy redshifts within the area shown in Fig. 1 show a bimodal distribution centred at and (Fig. 9), and a small population of foreground galaxies at (Fig. 10 and Tables 2,3). In conjunction with our Chandra data, which establish conclusively that next to all of the detected X-ray emission originates from MACS J0358.8–2955, this firmly rules out the possibility that the superposition of A 3192 () constitutes a significant source of contamination or confusion.
As for the bimodal distribution of galaxy redshifts in MACS J0358.8–2955, we note a pronounced correlation between radial velocity and position on the sky (Fig. 10), such that galaxies in the NE sub-cluster feature systematically higher redshifts than those in the SW system. This difference in redshift could be attributed either to Hubble expansion (i.e., the NE sub-cluster is more distant) or to peculiar velocities due to infall. We can rule out the first scenario since it implies a distance between the two sub-clusters of more than 10 Mpc along the line of sight, which is in conflict with clear signs of physical interaction (cold fronts) detected in our X-ray analysis of the system (Section 4.5). Adopting the alternative explanation that the bimodal distribution shown in Fig. 9 is due to peculiar velocities, we conclude that the two sub-clusters are near their first passage, and are moving past each other with a relative speed of roughly 1500 km s-1 along the line of sight. Applying Occam’s razor, this scenario is also favoured as an explanation for the small projected separation of the cluster cores (200 kpc at ). We conclude that the merger axis is significantly, but not fully, aligned with our line of sight.
In order to further constrain the three-dimensional merger geometry we consider the location and alignment of the two cold fronts and the relative locations of gas and galaxies in the vicinity of the core of the NE sub-cluster. As shown in Fig. 15, both the alignment of the two cold fronts and the offset of the NE sub-cluster’s BCG from the associated X-ray peak imply a projected direction of motion along a SE-NW axis. Such a motion is fully consistent with gas sloshing induced by the passage of a second cluster to the north-west of the cool core (the side of the more pronounced cold front), proceeding almost along our line of sight. The passage cannot have occurred exactly along our line of sight because the cold fronts are not aligned with the line connecting the two sub-clusters of MACS J0358.8–2955. This proposed trajectory of the SW sub-cluster is supported also by the results of our strong-lensing analysis: the offset between the centre of the gravitational mass of the SW cluster and the associated X-ray peak (Fig. 13), most likely induced by the interaction of the two cluster components during their close passage, points to an origin of the SW component that lies just north of the dominant, NE cluster.
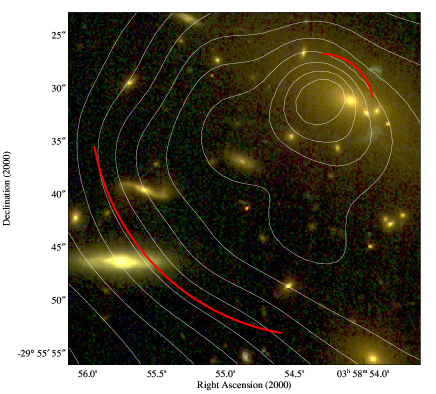
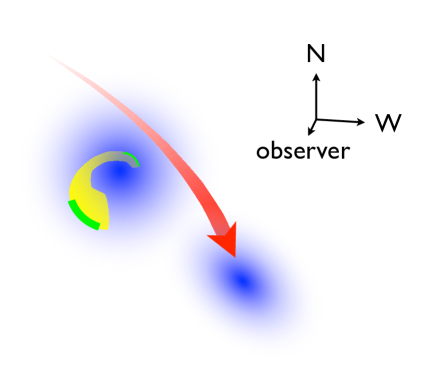
We thus conclude that MACS J0358.8–2955 is observed after the first core passage of a merger at non-zero impact parameter along an axis that is almost aligned with our line of sight, and that the trajectory of the incoming sub-cluster has changed from a south-westerly to a more southern direction (in projection), such that the secondary sub-cluster is now observed to the SW of the dominant NE cluster. As a result, the line connecting the two sub-clusters as observed is neither the merger axis nor does it indicate the current direction of motion. A sketch illustrating the proposed merger geometry and dynamics is shown in Fig 16.
Although MACS J0358.8–2955 is primarily a merger of just the two sub-clusters discussed so far, we find evidence at both X-ray and optical wavelengths that adds further complexity to this scenario. As is apparent from Fig. 1, the SW sub-cluster lacks an obvious BCG. Instead, several bright ellipticals are observed near the cluster core, and the location of none of them coincides with the peak of the X-ray emission. In addition, our spectroscopic analysis of the X-ray emission in this region (Fig. 6) finds compelling evidence of a mix of cool and very hot gas (16 keV). Although the gas dynamics and temperature cannot be more accurately constrained with the photon statistics of the data in hand, we propose that the SW sub-cluster is itself highly disturbed, most likely as the result of an ongoing merger at high inclination angle.
We conclude that MACS J0358.8–2955 is in fact not a BHOM but most likely a double merger, one of which proceeds almost head-on but along our line of sight, while the other features a significant impact parameter and again a significant inclination angle with respect to the plane of the sky.
6 Summary
We present an X-ray/optical analysis of MACS J0358.8–2955 based on observations with Chandra, HST, and Keck/LRIS. We measure the system’s global properties (velocity dispersion, bolometric X-ray luminosity, gas temperature, total gas mass, and total gravitational mass) as from 41 galaxies (890 km s-1 when the relativistic equation is used), erg s-1, kT = keV, , and (assuming a gas mass fraction of 8.2%).
Based on the systems’s X-ray/optical morphology, we propose that MACS J0358.8–2955 is an ongoing double merger. The primary merger of the SW and NE components features a significant impact parameter and a high inclination angle with respect to the plane of the sky. From an analysis of the offsets between collisional and collisionless matter in MACS J0358.8–2955 as well as from the presence, location, and orientation of two cold fronts near the core of the NE cluster, we conclude that the SW sub-cluster passed behind and north of the NE sub-cluster, inducing gas sloshing in the cool core of the latter. The lack of an obvious BCG and the evidence of a mix of cool and very hot gas in the core region of the SW component suggests that the passing cluster is itself highly disturbed, most likely due to an ongoing merger at high inclination angle. This scenario of a massive cluster passing and merging with an even more massive one along the trajectory indicated in Fig. 16 is supported by the results of a strong-lensing analysis of the system which also allows us to determine the gas mass fraction of MACS J0358.8–2955 (8.2%).
Finally, we show that the foreground galaxy group A 3192 is negligible compared to MACS J0358.8–2955 both in terms of total X-ray luminosity and mass.
Our study thus confirms that MACS J0358.8–2955 is a highly disturbed ongoing merger of two massive galaxy clusters. The three-dimensional geometry of the encounter, however, does not support the hypothesis of ME12 that MACS J0358.8–2955 is a head-on, binary merger. Nonetheless, our study establishes MACS J0358.8–2955 as a dynamically active, massive, post-collision merger that could provide important insights into the impact of cluster collisions on galaxy evolution in a high-density environment.
Acknowledgements
LYH and HE gratefully acknowledge financial support from SAO grants GO0-11140X and GO1-12172X, as well as from STScI grant GO-12313. JR is supported by the Marie Curie Career Integration Grant 294074. This work made use of the data analysis packages CIAO, Chips, and, Sherpa provided by the Chandra X-ray Center (CXC). We thank Chao-Ling Hung and Matthew Zagursky for contributions to the HST and Keck/LRIS data reduction, and the UH Time Allocation Committee for their support of the groundbased follow-up observations for this study.
Appendix A A 3192
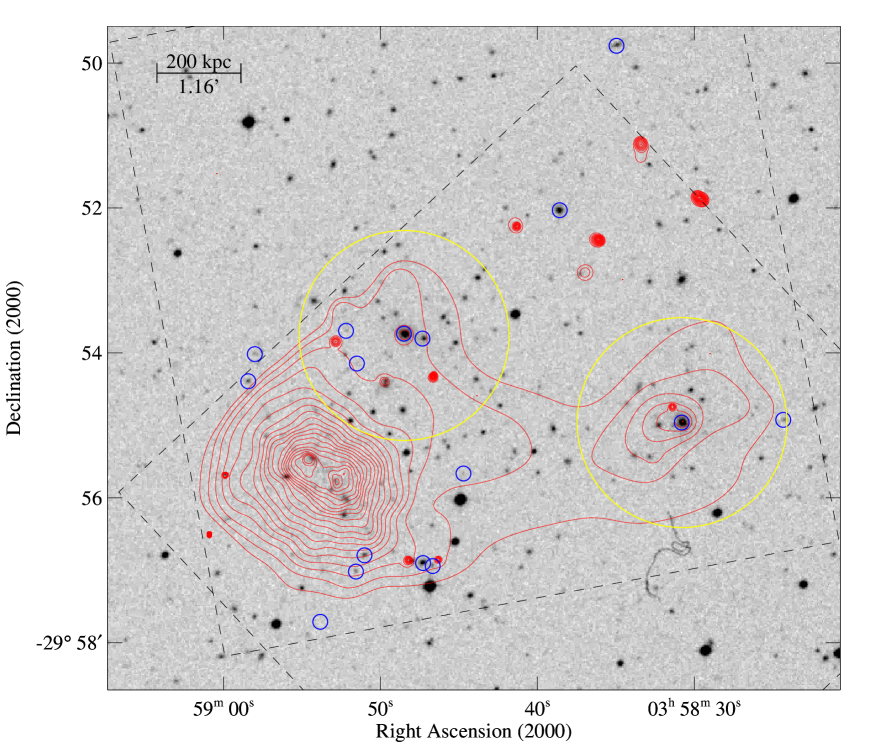
Our measurements of spectroscopic redshifts in the field of MACS J0358.8–2955 identify ten galaxies with , i.e., members of the foreground system A 3192. X-ray emission from A 3192 is detected with Chandra (ACIS-I) to the north-west and west of MACS J0358.8–2955. Fig. 17 shows an overlay of the X-ray emission on the POSS2/UKST red image from the STScI Digitized Sky Survey, with blue circles marking members of A 3192 identified by this work, Way et al. (2005), and Guzzo (2009). The X-ray surface brightness distribution of A 3192 shows two peaks that coincide with two bright galaxies, and a very weak feature connecting the two. We place two apertures centred on the two bright galaxies to estimate the fluxes within r = 250 kpc at z = 0.168 (87′′) for the western and the north-eastern X-ray peaks. The two apertures are shown as yellow circles in Fig. 17.
Since the photon statistics within the two apertures are insufficient for spectral fitting, we convert the measured count rates to X-ray fluxes and luminosities using in CIAO 4.4 and the spectral model described in Section 4.2. We freeze the redshift at 0.168, the metal abundance at 0.3, and the absorption at the Galactic value, and obtain an estimated plasma temperature iteratively from the observed counts in the 0.1–2.4 keV band and the relation of Eckmiller et al. (2011). The unabsorbed bolometric fluxes determined by this process for the two apertures are erg cm-2 s-1 and erg cm-2 s-1 for the western and the north-eastern apertures, respectively. The corresponding bolometric luminosities in the A 3192 rest frame are erg s-1 and erg s-1, and the estimated temperatures are 1.14 keV and 1.16 keV. The quoted uncertainties correspond to 1 confidence and assume that the photon counts follow Poisson statistics. Since the north-eastern aperture is contaminated by emission from the outskirt of MACS J0358.8–2955, the flux and luminosity of the NE component of A 3192 should be considered an upper limit. For the quoted X-ray luminosities, the relation of Eckmiller et al. (2011) predicts the masses of the two components of A 3192 to be essentially identical, at and .
Hamilton-Morris et al. (2012) perform a weak-lensing analysis within the field of their HST snapshot observation of MACS J0358.8–2955 and measure masses in two apertures. The first aperture is centred on the BCG of MACS J0358.8–2955’s NW sub-cluster, while the other is centred on the peak of the luminosity-density map of likely members of A 3192 selected by colour from images obtained by supplementary groundbased observations. This second position falls outside the ACS field of view and is very close to the centre of our X-ray aperture for the NE component of A 3192. Hamilton-Morris et al. (2012) choose radii of kpc for both apertures which, at and , corresponds to 45′′ and 87′′, respectively. Their weak-lensing mass estimate for A 3192 is 250 kpc, in perfect agreement with our X-ray-based mass estimate of .
In order to compare the properties of A 3192 with those of MACS J0358.8–2955 it is useful to do so at roughly the same overdensity . For a galaxy group like the two components of A 3192, a radius of 250 kpc corresponds to an overdensity of about 2200 (see Eqn. 4.2), a value that is reached by MACS J0358.8–2955 at a radius of 640 kpc (see Section 4.2). The total mass of MACS J0358.8–2955 at this radius can be obtained from Fig. 12; we find 640 kpc. It follows that, taken together, the components of A 3192 comprise at most one-thirteenth of the mass of MACS J0358.8–2955, where both masses are measured within .
References
- Anderson & Bedin (2010) Anderson J., Bedin L. R., 2010, PASP, 122, 1035
- Arnaud et al. (2002) Arnaud M., Aghanim N., Neumann D. M., 2002, A&A, 389, 1
- Böhringer (2004) Böhringer H. et al., 2004, A&A, 425, 367
- Bonafede (2009) Bonafede A. et al., 2009, A&A, 503, 707
- Bond et al. (1996) Bond J. R., Kofman L., Pogosyan D., 1996, Nature, 380, 603
- Boschin et al. (2006) Boschin W., Girardi M., Spolaor M., Barrena R., 2006, A&A, 449, 461
- Bradač et al. (2008) Bradač M., Allen S. W., Treu T., Ebeling H., Massey R., Morris R. G., von der Linden A., Applegate D., 2008, ApJ, 687, 959
- David et al. (2012) David L. P., Jones C., Forman W., 2012, ApJ, 748, 120
- Dickey & Lockman (1990) Dickey J. M., Lockman F. J., 1990, ARAA, 28, 215
- Durret et al. (2011) Durret F., Laganá T. F., Haider M., 2011, A&A, 529, A38
- Ebeling et al. (2004) Ebeling H., Barrett E., Donovan D., 2004, ApJL, 609, L49
- Ebeling et al. (2007) Ebeling H., Barrett E., Donovan D., Ma C.-J., Edge A. C., van Speybroeck L., 2007, ApJL, 661, L33
- Ebeling et al. (2001) Ebeling H., Edge A. C., Henry J. P., 2001, ApJ, 553, 668
- Ebeling et al. (2010) Ebeling H., Edge A. C., Mantz A., Barrett E., Henry J. P., Ma C. J., van Speybroeck L., 2010, MNRAS, 407, 83
- Ebeling et al. (2006) Ebeling H., White D. A., Rangarajan F. V. N., 2006, MNRAS, 368, 65
- Eckmiller et al. (2011) Eckmiller H. J., Hudson D. S., Reiprich T. H., 2011, A&A, 535, A105
- Edge et al. (2003) Edge A. C., Ebeling H., Bremer M., Röttgering H., van Haarlem M. P., Rengelink R., Courtney N. J. D., 2003, MNRAS, 339, 913
- Freeman et al. (2001) Freeman P., Doe S., Siemiginowska A., 2001, Society of Photo-Optical Instrumentation Engineers Conference Series, 4477, 76
- Garmire et al. (2003) Garmire G. P., Bautz M. W., Ford P. G., Nousek J. A., Ricker Jr. G. R., 2003, Society of Photo-Optical Instrumentation Engineers Conference Series, 4851, 28
- Giavalisco (2004) Giavalisco M. et al., 2004, ApJ, 600, L93
- Girardi et al. (2008) Girardi M., Barrena R., Boschin W., Ellingson E., 2008, A&A, 491, 379
- Guzzo (2009) Guzzo L. et al., 2009, A&A, 499, 357
- Hamilton-Morris et al. (2012) Hamilton-Morris V., Smith G. P., Edge A. C., Egami E., Haines C. P., Marshall P. J., Sanderson A. J. R., Targett T. A., 2012, ApJL, 748, L23
- Ho et al. (2012) Ho I., Ebeling H., Richard J., 2012, ArXiv e-prints
- Jauzac (2012) Jauzac M. et al., 2012, ArXiv e-prints
- Jee et al. (2012) Jee M. J., Mahdavi A., Hoekstra H., Babul A., Dalcanton J. J., Carroll P., Capak P., 2012, ApJ, 747, 96
- Jullo et al. (2007) Jullo E., Kneib J.-P., Limousin M., Elíasdóttir Á., Marshall P. J., Verdugo T., 2007, New Journal of Physics, 9, 447
- Kempner & David (2004) Kempner J. C., David L. P., 2004, MNRAS, 349, 385
- Koekemoer et al. (2002) Koekemoer A. M., Fruchter A. S., Hook R. N., Hack W., 2002, 2002 HST Calibration Workshop, p. 337
- Limousin (2007) Limousin M. et al., 2007, ApJ, 668, 643
- Limousin (2012) Limousin M. et al., 2012, A&A, 544, A71
- Ma & Ebeling (2011) Ma C.-J., Ebeling H., 2011, MNRAS, 410, 2593
- Ma et al. (2009) Ma C.-J., Ebeling H., Barrett E., 2009, ApJL, 693, L56
- Ma et al. (2008) Ma C.-J., Ebeling H., Donovan D., Barrett E., 2008, ApJ, 684, 160
- Ma et al. (2010) Ma C.-J., Ebeling H., Marshall P., Schrabback T., 2010, MNRAS, 406, 121
- Ma et al. (2012) Ma C.-J., Owers M., Nulsen P. E. J., McNamara B. R., Murray S. S., Couch W. J., 2012, ApJ, 752, 139
- Mahdavi et al. (2007) Mahdavi A., Hoekstra H., Babul A., Balam D. D., Capak P. L., 2007, ApJ, 668, 806
- Mann & Ebeling (2012) Mann A. W., Ebeling H., 2012, MNRAS, 420, 2120
- Mantz et al. (2010) Mantz A., Allen S. W., Ebeling H., Rapetti D., Drlica-Wagner A., 2010, MNRAS, 406, 1773
- Markevitch et al. (2004) Markevitch M., Gonzalez A. H., Clowe D., Vikhlinin A., Forman W., Jones C., Murray S., Tucker W., 2004, ApJ, 606, 819
- Markevitch et al. (2005) Markevitch M., Govoni F., Brunetti G., Jerius D., 2005, ApJ, 627, 733
- Markevitch & Vikhlinin (2007) Markevitch M., Vikhlinin A., 2007, Phys. Rep., 443, 1
- Masters & Capak (2011) Masters D., Capak P., 2011, PASP, 123, 638
- Merten (2011) Merten J. et al., 2011, MNRAS, 417, 333
- Mewe et al. (1985) Mewe R., Gronenschild E. H. B. M., van den Oord G. H. J., 1985, A&AS, 62, 197
- Morrison & McCammon (1983) Morrison R., McCammon D., 1983, ApJ, 270, 119
- Okabe & Umetsu (2008) Okabe N., Umetsu K., 2008, PASJ, 60, 345
- Oke (1995) Oke J. B. et al., 1995, PASP, 107, 375
- Owers et al. (2012) Owers M. S., Couch W. J., Nulsen P. E. J., Randall S. W., 2012, ApJL, 750, L23
- Owers et al. (2011) Owers M. S., Randall S. W., Nulsen P. E. J., Couch W. J., David L. P., Kempner J. C., 2011, ApJ, 728, 27
- Proust et al. (2000) Proust D., Cuevas H., Capelato H. V., Sodré Jr. L., Tomé Lehodey B., Le Fèvre O., Mazure A., 2000, A&A, 355, 443
- Ragozzine et al. (2012) Ragozzine B., Clowe D., Markevitch M., Gonzalez A. H., Bradač M., 2012, ApJ, 744, 94
- Randall et al. (2002) Randall S. W., Sarazin C. L., Ricker P. M., 2002, ApJ, 577, 579
- Rhodes (2007) Rhodes J. D. et al., 2007, ApJS, 172, 203
- Richard et al. (2011) Richard J., Kneib J.-P., Ebeling H., Stark D. P., Egami E., Fiedler A. K., 2011, MNRAS, 414, L31
- Richard et al. (2009) Richard J., Pei L., Limousin M., Jullo E., Kneib J. P., 2009, A&A, 498, 37
- Rockosi (2010) Rockosi C. et al., 2010, Society of Photo-Optical Instrumentation Engineers Conference Series, 7735, 26
- Russell et al. (2010) Russell H. R., Sanders J. S., Fabian A. C., Baum S. A., Donahue M., Edge A. C., McNamara B. R., O’Dea C. P., 2010, MNRAS, 406, 1721
- Russell (2011) Russell H. R. et al., 2011, MNRAS, 417, L1
- Russell (2012) Russell H. R. et al., 2012, MNRAS, 423, 236
- Sanders (2006) Sanders J. S., 2006, MNRAS, 371, 829
- Smith & Taylor (2008) Smith G. P., Taylor J. E., 2008, ApJL, 682, L73
- Smith (2009) Smith G. P. et al., 2009, ApJL, 707, L163
- Sun (2012) Sun M., 2012, New Journal of Physics, 14, 045004
- van Weeren et al. (2009) van Weeren R. J., Röttgering H. J. A., Brüggen M., Cohen A., 2009, A&A, 505, 991
- Vikhlinin (2009) Vikhlinin A. et al., 2009, ApJ, 692, 1033
- Voges (1999) Voges W. et al., 1999, A&A, 349, 389
- Way et al. (2005) Way M. J., Quintana H., Infante L., Lambas D. G., Muriel H., 2005, AJ, 130, 2012