Escape Fraction of Ionizing Radiation from Starburst Galaxies at High Redshifts
Abstract
Recent data indicates that the cosmic UV emissivity decreased with decreasing redshift near the end of reionization. Lacking evidence for very massive early stars, this could signal a decline with time in the mass-averaged escape fraction of ionizing radiation from galaxies at . We calculate the evolution of ionization fronts in dark matter halos which host gas in hydrostatic equilibrium at its cooling temperature floor ( K for atomic hydrogen). We find a high escape fraction only for the lowest mass halos (with at ) provided their star formation efficiency . Since the low-mass galaxy population is depleted by radiative feedback, we find that indeed decreases with time during reionization.
keywords:
Reionization, Galaxies, Star Formation1 Introduction
The first generation of galaxies is expected to have reionized cosmic hydrogen by a redshift (Loeb & Furlanetto, 2013). One of the most important unknown parameters regulating the way in which reionization proceeds is the fraction of ionizing photons, , that escape outside the virial radius of the galaxies in which they were produced and into the surrounding intergalactic medium (IGM). The growth of ionized regions with cosmic time depends on the average value of this parameter over viewing angle per galaxy and over the galaxy population (Wyithe & Loeb, 2003; Trac & Cen, 2007; Bouwens et al., 2012; Finkelstein et al., 2012).
Observations of galaxies at indicate a broad set of escape fraction values ranging from a few percent to tens of percent (Steidel et al., 2001; Fernández-Soto et al., 2003; Shapley et al., 2006; Inoue et al., 2006; Siana et al., 2007; Giallongo et al., 2008; Iwata et al., 2009; Boutsia et al., 2011; Grazian et al., 2011; Vanzella et al., 2012a, b). This potentially reflects strong variations of the escape fraction with viewing angle and evolutionary time.
A calculation of the escape fraction of ionizing radiation from first principles is difficult, as it depends on the spatial distribution of ionizing sources relative to the neutral hydrogen in galaxies and is therefore sensitive to the small scale clustering of young stars and the interstellar medium. Due to their higher density, high-redshift galactic disks are expected to have small escape fractions during reionization (Wood & Loeb, 2000; Gnedin et al., 2008; Razoumov & Sommer-Larsen, 2006; Wise & Cen, 2009). Even for local disk galaxies, Dove et al. (2000) concluded that should not exceed a few percent in most cases, as a result of efficient radiation trapping by the shells of the expanding superbubbles around OB star associations.
Since the mean density of the Universe (and hence galaxies) scales as , theoretical calculations tend to conclude that should decrease with increasing redshift. This expectation appears to be in conflict with recent reionization models and data (Bolton & Haehnelt, 2007; Salvaterra et al., 2011; Mitra et al., 2012a, b; Kuhlen & Faucher-Giguère, 2012; Finkelstein et al., 2012) that point towards the need for an increasing UV emissivity towards high redshifts. This can be achieved in two ways. The first is to postulate an increasingly top-heavy initial mass function (IMF) of stars that would increase the number of photons emitted per baryon incorporated in stars. Although possible, this explanation seems to be disfavored by the lack of observational evidence for an early population of substantially more massive stars (Cayrel et al., 2004; Caffau et al., 2011) and by recent numerical simulations (Greif et al., 2012). A more appealing solution is represented by a possible increase in the average escape fraction during reionization, recently suggested by Mitra et al. (2012b). Here we explore a novel physical explanation for this unexpected trend.
We show that the lowest-mass galaxies near or below (so-called mini-halos) the hydrogen cooling threshold have high escape fractions but their contribution to the UV production rate decreases with cosmic time due to large-scale radiative feedback processes during reionization that either photo-heat or sterilize them by dissociating their H2. However, internal feedback is of foremost importance as well: as these small systems achieved large by rapidly (within yr) ionizing their entire interstellar medium, this gas will become loosely bound to the host galaxy. Under these conditions it is difficult to sustain a continuous mode of star formation (SF), particularly because following the death of massive stars powerful supernova explosions will clear the gas out of the potential well before a stable disk structure is established. More massive galaxies will form a disk with the net result of trapping most of their ionizing photons.
If high-redshift dwarf galaxies form stars predominantly in episodic bursts, as suggested by the high incidence of galaxy mergers at increasing redshift (Muñoz & Loeb, 2011), the conventional argument that their star formation efficiency is suppressed by supernova (SN) feedback may not be valid. In particular, SN feedback is inhibited if the duration of the starburst is shorter than , the lifetime of SN progenitors. In this regime, the global radiative feedback sets the amount of gas initially available for making stars and hence the overall efficiency of star formation, . In our calculations, we will calibrate the value of based on recent measurements of the cosmic stellar mass density at high redshifts (González et al., 2011).
For an instanteneous starburst, can be large only if an escape route for ionizing photons is opened within a few Myr, prior to the death of the massive stars that produce these photons. This process cannot be mediated by supernova explosions, which occur after the emission of ionizing photons has already started to decline. The key question is therefore whether the surrounding blanket of absorbing hydrogen atoms can be ionized before the massive stars in the starburst end their life. We address this question within the context of a simple model in which we populate dark matter halos with primordial gas that cooled to the temperature floor of atomic hydrogen, K.
Our basic point is simple: massive galaxies exist at all redshifts and the escape fraction of ionizing radiation from them is calculated and observed to be small; however, the lowest-mass galaxies ( K) exist only before and during reionization and have a high . Our assumption of a short-lived star formation phase without SN feedback is self-consistent, as we will show that photoionization heating of the gas suppresses star formation in dwarf galaxies after a period of time much shorter than the lifetime of massive stars.
In §2 we describe the details of our calculation and in §3 we present our numerical results. Finally, we discuss our main conclusions in §4. Throughout the paper, we adopt the WMAP7 set of cosmological parameters with , , , , , , and (Larson et al., 2011).
2 Method of Calculation
We derive the escape faction of the ionizing photons, , based on a set of simplifying assumptions. We consider a spherical dark matter halo of mass, , virializing at redshift and characterized by an internal density (spherically averaged) profile following the Navarro-Frenk-White (Navarro et al. (1997), NFW) form,
| (1) |
where , is the virial radius of the system, is the halo concentration parameter, is a characteristic overdensity, and
| (2) |
For the concentration parameter we use the results of Prada et al. (2012), extrapolating them towards lower masses and higher redshift when necessary. The circular velocity, , can be expressed as
| (3) |
with . Baryons fall into the dark matter halo potential well are shock-heated to the virial temperature , and then relax to a hydrostatic configuration (Makino et al., 1998),
| (4) |
| [K] | 4.31 | 4.98 | 5.65 | 6.32 |
|---|---|---|---|---|
| [] | ||||
| 20.6 | 23.9 | 36.0 | 167.8 | |
| K | 24.3 | — |
Here, is the halo escape velocity from the halo,
| (5) |
is the mean molecular weight of a neutral primordial H-He gas; is the Boltzmann constant and the proton mass. We have also inserted in equation (4) the extra factor , where is the effective sound speed at a generic temperature . The standard case in which is obtained by setting . By manipulating equation (4) we then get the final expression for the gas density profile as a function of radius,
| (6) |
where we have defined , and the ancillary function . The central density, , is obtained by requiring that the total gas mass in the halo is equal to the cosmological value, i.e. . This procedure yields
| (7) |
Table 1 provides the values of the central number density, , for different halo masses and values at a fixed redshift, . As expected, increases in larger masses even in the case in which the gas is at the virial temperature of the halo. This reflects the strong dependence of on the concentration parameter, which increases from for to for . This increasing trend is amplified if the gas is cooler than the virial temperature () or if it is thermostated at a fixed temperature (such as K in Table 1), leading to unrealistic densities for the most massive halos with (which represent rare fluctuations of the density field at ). For massive halos we obtain artificially high densities because we ignore angular momentum. Once the gas condenses to a sufficiently small scale, its rotation will halt contraction and it will settle to a disk. Disks were considered by Wood & Loeb (2000) and Dove et al. (2000) who independently concluded that the escape fraction was negligible for a smooth gas distribution in high-redshift disks and also local spirals. We therefore argue that once the gas contracts enough to make a disk, its density will not increase by as much as our spherical model predicts but UV photons will not be able to escape from it anyway, based on earlier studies.
2.1 Ionization front evolution
Having specified the gas density distribution inside halos, we may now derive the evolution of an ionization front (IF) driven by the emission of photons with energy eV from a burst of star formation at the halo center. We assume that a fraction of the available gas, , of a given halo is instantaneously converted into stars distributed in mass according to a Salpeter IMF in the range () = () and with absolute metallicity . The ionizing photon production rate, , by the stellar cluster can be computed exactly from population synthesis models: we use here Starburst99111http://www.stsci.edu/science/starburst99/ Leitherer et al. (1999). The time dependence of the production rate of ionizing photons rate under these conditions is,
| (8) |
with () = ( yr). Equation (8) illustrates the important point that after Myr, the production rate of ionizing photons rapidly drops as a result of the death of short-lived massive stars. This has important implications for as discussed hereafter. Note that equation (8) implies that the number of ionizing photons emitted per baryon incorporated into stars is .
The time evolution of the IF radius, , is described by an ordinary differential equation that expresses a detailed balance between the ionization and recombination rates within the volume enclosed by the IF,
| (9) |
where is the hydrogen density for a primordial gas and is the Case B recombination rate of hydrogen (Maselli et al., 2003). Normalizing by an effective recombination rate in the halo, , and adopting a dimensionless time variable , equation (9) can be written in a dimensionless form,
| (10) |
Equation (10) describes the expansion of the H region into the stratified gas distribution within the halo. As the density decreases outwards, the IF accelerates and eventually exits the virial radius at a time . Until all the ionizing photons are absorbed inside the halo222Here we ignore the possibility of a highly inhomogeneous medium in which low density channels for escape exist.; hence, . However, for , ionizing photons will be only used to keep the halo ionized by balancing recombinations within it, but a large fraction of them will be able to escape into the IGM, thus making . We then express the net escape fraction as follows:
| (11) |
As we will see shortly, though, either the IF is efficiently confined by the density, , or the blow out will occur on a very short time scale thus making . We will refer to these two different situations as a “confined” or “unconfined” IF in the rest of the paper.
3 Results
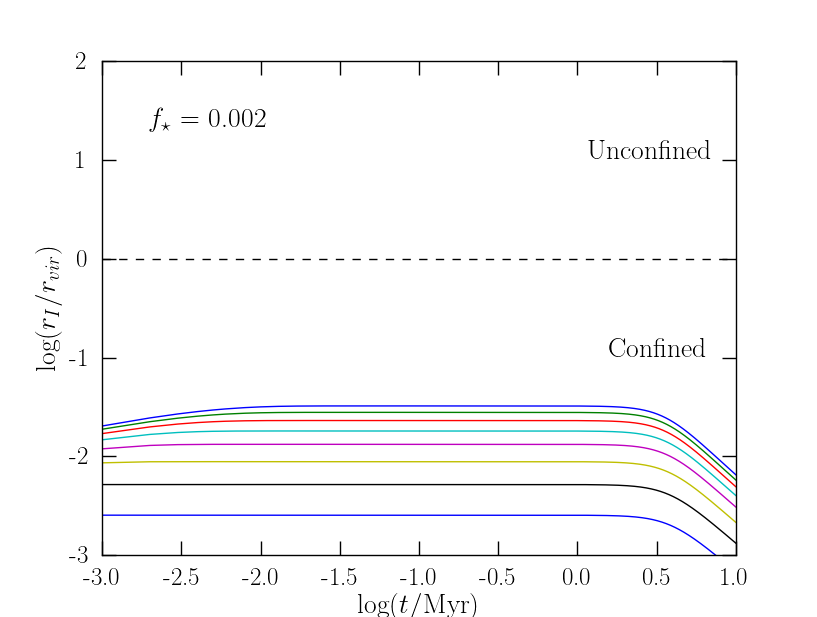
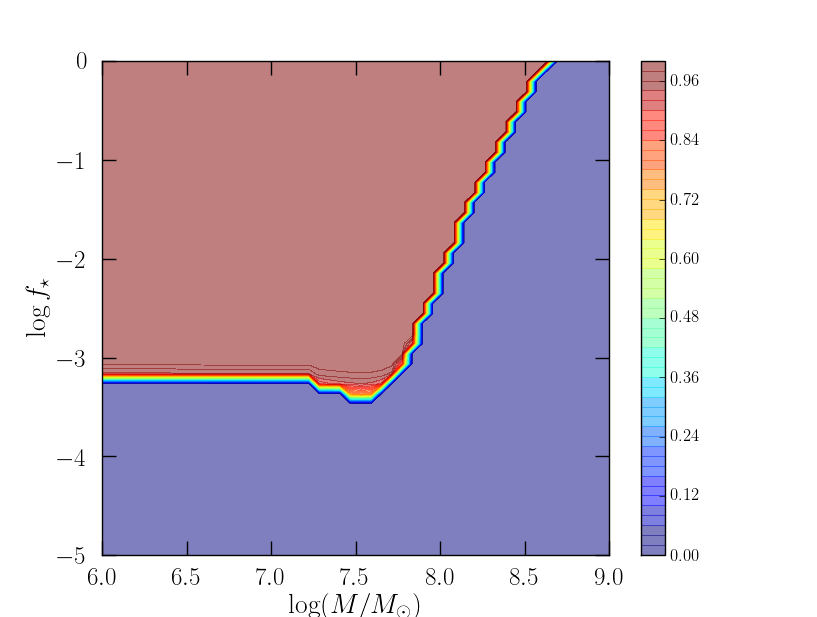
We solved numerically equation (10) for a number of halo masses with in the range – at two selected redshifts, and . Figures 1 and 2 show the results for %, a reasonable value for for nearly primordial star-forming halos (Barkana & Loeb, 2001; Ciardi & Ferrara, 2005; Pawlik et al., 2012); note that Wise & Cen (2009) found that averaged over all atomic cooling ( K) galaxies assuming a Salpeter IMF.
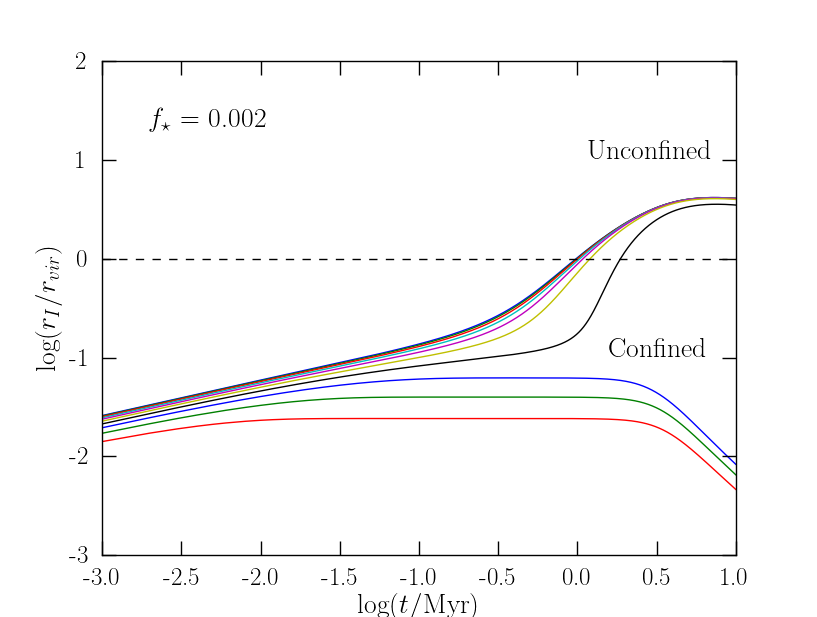
IFs in these early halos evolve rapidly to the strong radiative input by the stars and reach a radius within Myr, yielding for halo masses up to , beyond which the IF is confined within the halo, and hence . It requires fine tuning for a single object to achieve intermediate values; rather, the process favors on-off states implying that the escape fraction of photons from galaxies can be intermittent: depending on variations of in different bursts (say, due to the increasing gas metallicity or decreasing gas fraction due to mass loss from supernova-driven winds) the same halo might switch from being dark to bright above the Lyman limit. This is consistent with the results of Shapley et al. (2006) who showed that the PDF of the escape fraction from star-forming galaxies is bimodal (see their Fig. 5). Note also that for the largest IF-confined halos, the H region starts to shrink at Myr as a result of recombinations and the decline in the supply rate of ionizing photons.
The situation is dramatically different at (for the same ): at that epoch all halos confine their IF and have . This is due to the increase in the gas density and the larger concentration factor at a fixed mass. A more global view of the dependence of on halo mass and star formation efficiency at is given by Fig. 3. The abrupt transition from to zero is very weakly dependent on halo mass, except for the narrow range of in which larger halos tend to be more opaque to ionizing photons. Above this range, independently of halo mass and star formation efficiency, and below this range, .
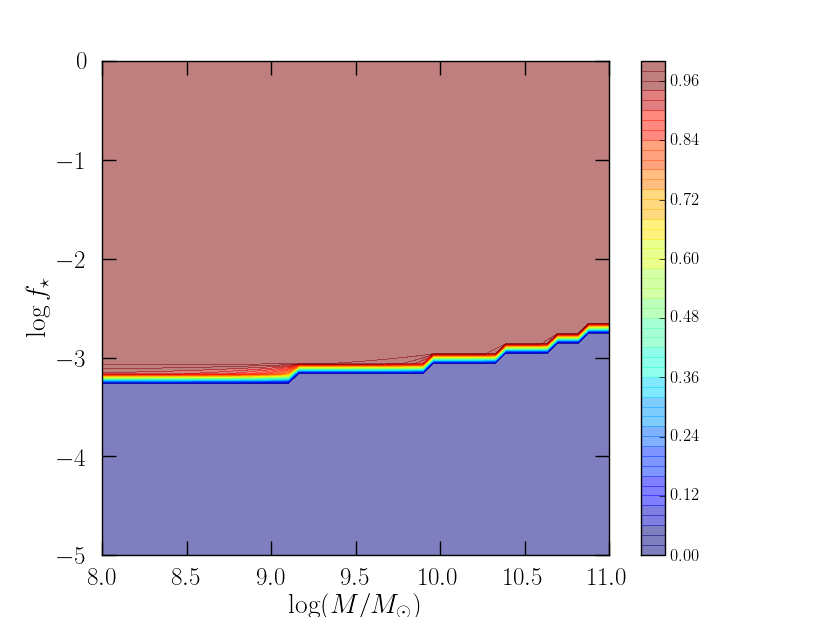
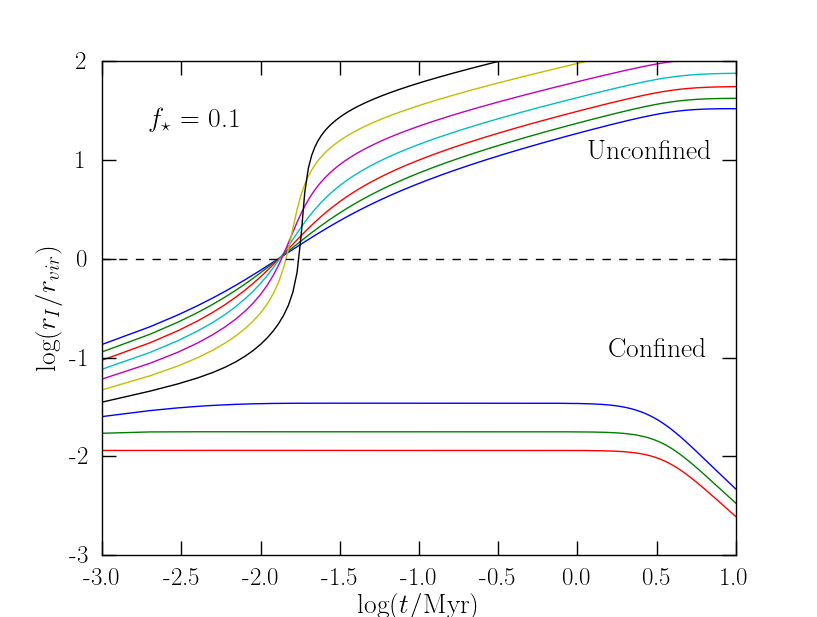
Figure 4 shows the examples with introduced in Table 1, for which K, corresponding to for halos of mass and hence resulting in considerably denser and more compact gas configurations. The IF front is now largely confined within all halos with even if the star formation efficiency has been increased by a factor of 50 with respect to the case with shown in Fig. 1. In addition, the IF escapes the virial radius in a very short time333We have checked that the IF speed is subluminal, , yr.
The different behavior relative to the case of is caused by the associated high gas density (see Table 1). The small scale height of the gas distribution, correspondingly reduced by a analogous factor , forces the steep acceleration seen just prior to blow out. In analogy with the case, we show the dependence of on halo mass and star formation efficiency at (Fig. 5). In this case the area is much narrower and limited to small halos with and . Thus, according to our model, it is only the smallest halos that are truly able to inject ionizing photons in the IGM and therefore substantially contribute to reionization. Larger halos are instead able to confine their H regions very effectively. At the region is qualitatively the same, but its area shrinks because of the larger background density and the increased concentration parameter at a fixed halo mass.
To check the effects of the central density we have performed two additional experiments: (a) we have introduced a central density core of size such that the value the density in the core is equal to ; (b) in a more extreme case, we have completely removed the gas, i.e. within the core. The two cases lead to similar conclusions: appreciable deviations from the solutions presented in Fig 4 of the paper are seen only for values of . Stated differently, it would be necessary to completely remove all the gas within 10% of the virial radius to produce appreciable deviations from what we have obtained with our density profile.
The existence of a minimum value of to allow the escape of photons can be understood based on a simple argument. This minimum number of ionizing photons provided to each hydrogen atom in the halo must balance the number of recombinations it undergoes during the lifetime of the starburst, approximately equal to yr (see equation 8). This can be expressed by the following inequality:
| (12) | |||||
| (13) |
where is the clumping factor accounting for the gas density structure inside a NFW halo.
The results for halos with in which K at need some extra attention. In fact, by fixing the gas temperature to K, the gas might have never been accreted in the first place; this is the case if for example the halo is located within an already ionized region. To correct this problem, we have set in these mini-halos; of course, this requires that some cooling agent, such as , HD or LiH, would cool the gas in these systems to make stars.
| Mass-averaged – Constant | |||||||
| [] | [] | [] | |||||
| 2.977e+08 | 2.977e+08 | 4.852e+08 | 1.379e-01 | 1.262e-01 | 8.478e-02 | 3.000e-02 | |
| 1.169e+07 | 1.169e+07 | 2.190e+08 | 1.130e-01 | 5.936e-02 | 4.747e-01 | 3.000e-02 | |
| 1.169e+07 | 1.169e+07 | 1.253e+08 | 1.130e-01 | 6.897e-02 | 3.897e-01 | 3.000e-03 | |
| 1.169e+07 | 1.169e+07 | 5.818e+08 | 1.130e-01 | 4.374e-02 | 6.130e-01 | 1.000e+00 | |
| 1.169e+07 | 1.169e+07 | 1.169e+07 | 1.130e-01 | 1.130e-01 | 0.000e+00 | 1.000e-04 | |
| 1.634e+06 | 1.634e+06 | 8.131e+07 | 5.373e-02 | 1.471e-02 | 7.263e-01 | 3.000e-02 | |
| Mass-averaged – Variable | |||||||
| [] | [] | [] | |||||
| 5.361e+07 | 5.361e+07 | 2.019e+08 | 1.098e-01 | 8.315e-02 | 2.426e-01 | 8.119e-03 | |
| 3.664e+06 | 3.664e+06 | 1.119e+08 | 1.102e-01 | 5.217e-02 | 5.267e-01 | 4.799e-03 | |
| 2.030e+06 | 2.030e+06 | 7.128e+07 | 8.003e-02 | 3.148e-02 | 6.066e-01 | 4.281e-03 | |
3.1 Global redshift evolution
Next we would like to constrain the redshift evolution of when averaged over the entire galaxy population.
The dark matter halo mass function, , is well described by the Sheth & Tormen (2002) form:
| (14) |
with , , , , , with , being the linear growth factor and being the r.m.s. amplitude of density fluctuations on a mass scale .
We define the mass-averaged escape fraction, at a given and redshift as follows:
| (15) |
where is the collapse fraction of all matter in haloes with mass exceeding at redshift .
Equation (15) contains two important characteristic masses. The first, , is defined as the halo mass above which, for a given redshift and star formation efficiency , no ionizing photons can escape, i.e. . The results presented above allow us to precisely determine .
The second mass scale, , denotes the redshift-dependent minimum mass of star-forming haloes which is set by radiative feedback. The evolution of is determined by two distinct radiative feedback processes. The first one is related to the increase of the cosmological Jeans mass in progressively ionized cosmic regions; as a result, the infall of gas in haloes below a given virial temperature is quenched. The evolution of depends on the details of the reionization history (Gnedin, 2000; Okamoto et al., 2008; Schneider et al., 2008). Guided by these findings, we adopt the the value with K after the end of reionization, here assumed to occur at .
Before reionization (at least in the mostly neutral regions) a second type of feedback, involving the photodissociation of molecules by the Lyman-Werner (LW) background photons, becomes important. As H2 is the primary coolant for minihalos ( K), fragmentation of the gas to stars could be suppressed in these objects through H2 dissociation by the UV background (Haiman et al., 1996; Ciardi et al., 2000; Kitayama et al., 2000; Machacek et al., 2001). According to Dijkstra et al. (2004), mini-halos with K can self-shield H2 and cool, hence we use this value as the lower threshold for star formation. During reionization the interplay between the photo-ionization heating and LW-feedback is complicated (see the discussion in Mesinger & Dijkstra (2008) and Fig. 25 of Ciardi & Ferrara (2005)) and and the evolution of during this epochs is uncertain. To circumvent this uncertainty, we follow the phenomenological approach of Salvadori & Ferrara (2009) and Salvadori & Ferrara (2012) who suggested that the metallicity distribution and iron-luminosity relation of the Ultra Faint dSphs in the Milky Way halo can be explained if these objects are relic mini-halos that formed their stars prior to reionization. With this perspective, one can reconstruct by fitting local data. This approach yields the functional form,
| (16) |
with , which we adopt here.
In general . However, for sufficiently low values of , and . To illustrate this point (see Table 2), we examine the results at in Figure 5. For , stars are formed only in halos more massive than . Ionizing photons can only escape from halos less massive than . As a result, there is a narrow range of objects that contribute to the ionizing photons budget in the IGM. Below that range stars cannot form and above it the gas is sufficiently dense to confine the H region. When weighted with the halo mass function, though, the collapsed mass fraction above is , yielding the large value . Since H regions in abundant low mass halos are unbound, the average escape fraction is high. The width of the range progressively shrinks as star formation becomes less efficient. This is evident from Table 2, where for and , and the escape fraction drops to zero. These results underline the importance of the possible evolution in the star formation efficiency, which we address below.
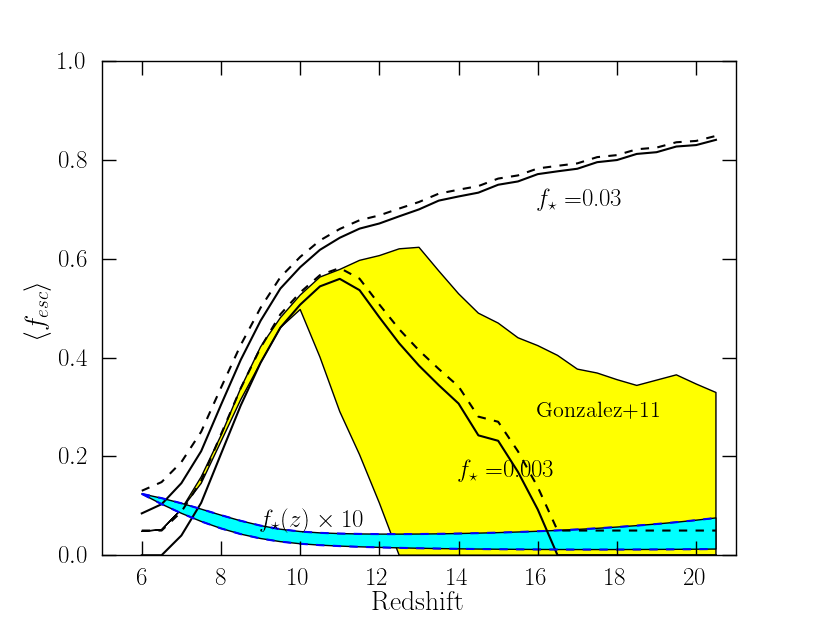
The redshift evolution of the results can be understood in terms of a balance between two opposite trends. On the one hand, the halo central densities tend to become larger with increasing redshift, providing a more efficient confinement of the IF and acting to decrease . On the other hand, more dwarf galaxies and mini-halos are able to produce ionizing photons as the critical mass decreases with increasing . The overall evolution for the two specific values can be seen in Figure 6 (solid curves). For the high case, the escape fraction continues to increase with redshift, reaching at . If instead , the escape fraction reaches a peak value of at where it starts to decrease until it reaches zero at when the density effect dominates over the enhanced photon production rate. Interestingly, a nearly redshift-independent above a threshold of % (see Fig. 5) always leads to during the final phase of reionization.
Although a rather weak mass dependence of for galaxies of stellar mass is inferred from local SDSS data (Dekel & Woo, 2003), there are indications of a decreasing star formation efficiency for high- galaxies. This is in line also with the conclusion (based on numerical simulations) by Munshi et al. (2012) that low mass () halos have generally lower (0.1%) values of . Recently, different groups (Stark et al., 2009; Labbé et al., 2010; González et al., 2011) have obtained stellar masses of galaxies in the redshift range from spectral energy distribution fitting to rest-frame optical and UV fluxes from Hubble-WFC3/IR camera observations of the Early Release Science field combined with the deep GOODS-S Spitzer/IRAC data. From this data it has been possible to reconstruct (see Fig. 4 of González et al. (2011)) the evolution of the comoving Stellar Mass Density (SMD), which we define here as . The main result is that Mpc-3; in addition, the SMD grows with decreasing redshift as . We can exploit this observational result to obtain a robust estimate for based on the relation,
| (17) |
In other words, we tune the star formation efficiency so that baryons in collapsed halos account for the abundance of stars observed at . Note that the González et al. (2011) SMD has also been corrected for incompleteness at low masses. The range of allowed values of implied by the data and obtained through equation (17) are plotted as a shaded area in Fig. 6. The data suggest at (for display reasons we have multiplied the values by a factor 100 in the Figure) decreasing thereafter by a factor of about three above .
The main consequence of a suppressed star formation efficiency in low mass objects is to introduce a new intermediate mass scale . Because of their lower star formation efficiency, halos above might not produce enough stars to ensure . IFs become unconfined only for somewhat larger halos of characteristic mass , such that . Thus only in the interval []. Stated differently, even objects that are above and can form stars, are now more efficient at confining their IFs; therefore their escape fraction becomes zero. Table 2 shows how gradually approaches towards high redshifts, closing the non-vanishing escape fraction window.
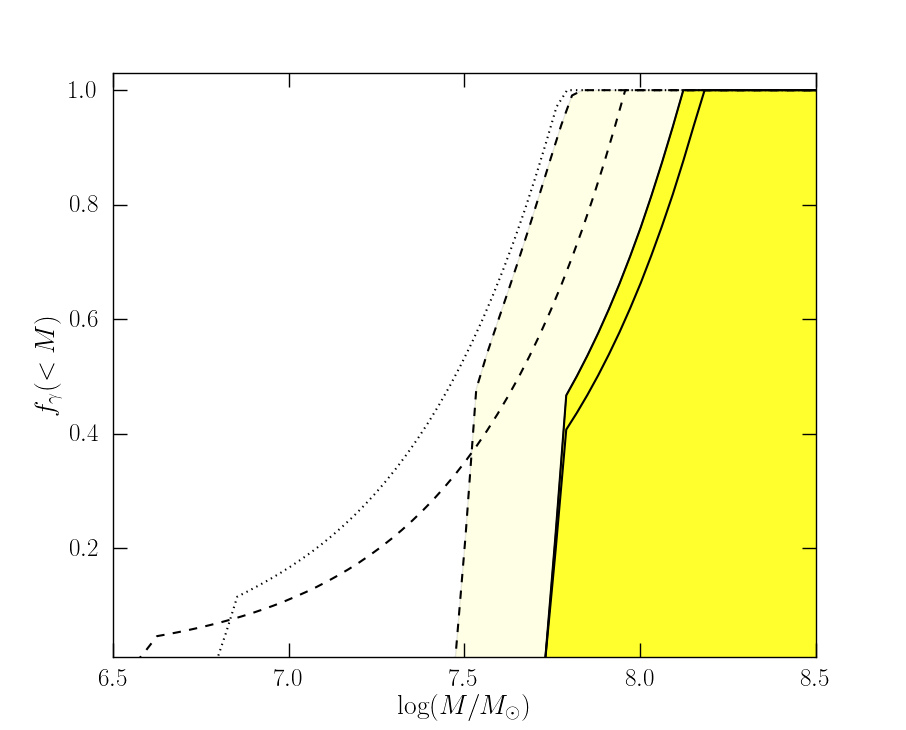
Another interesting question is how the global production of ionizing photons is distributed among halos of different masses. We quantify this through the cumulative fraction of ionizing photons produced by halos below a given mass,
| (18) |
as shown in Figure 7. Due to their large escape fraction, halos with masses are the dominant contributors to the cosmic ionizing photon budget. This holds for the more realistic redshift-dependent , but also for the constant case. Thus, the low-mass galaxies and mini-halos might have dominated reionization. In particular, at the mass corresponding to K limiting the mini-halo mass range from above, is . Figure 7 shows that independently of the star formation efficiency prescription, we predict that mini-halos contribute of the total emissivity.
Reionization models suggest an increasing emissivity towards high redshifts (Bolton & Haehnelt, 2007; Mitra et al., 2012a, b; Kuhlen & Faucher-Giguère, 2012), whose most natural explanation is in terms of a increasing with redshift as we find here. For example, Mitra et al. (2012b) find that: (i) the escape fraction increases from at z=6 to at ; and (ii) at .
4 Discussion
We have calculated the escape fraction of ionizing photons from starburst galaxies during reionization, assuming that galactic gas cools down to a temperature floor (K for atomic hydrogen and K for self-shielded molecular hydrogen). We have found that most of the escaping ionizing photons originates in the lowest mass galaxies with . Due to the shallowness of the gravitational-potential well in these galactic halos, the gas maintains a low density and its recombination rate is low. This allows the ionization front to break through the virial radius rapidly, resulting in a high escape fraction of the emitted ionizing radiation. As reionization progresses, the intergalactic medium is photo-heated and the abundance of galaxies with K declines, leading to a decrease in . This physical mechanism may account for the increase of with redshift inferred by Mitra et al. (2012b).
Our study is consistent with previous studies of low mass galaxies by Wise & Cen (2009), who found a high escape fraction (). Low mass galaxies do not form a disk (Pawlik et al., 2011), which could trap effectively ionizing photons. The relative importance of minihalos for the global production rate of ionizing photons is determined by the product . Here we have used a phenomenological calibration of . In order to produce the observed stellar density at – by minihalos, has to be . This value lies in the middle range resulting from Wise & Cen (2009) idealized halo simulations, but they find the star formation efficiency in halos with to be smaller. We find that the required increase of with redshift cannot be achieved if minihalos are sterile or form stars inefficiently.
Our simplified calculation ignored angular momentum which drives cold gas to a rotating disk configuration. Our model allowed cold gas to condense to arbitrarily small scales without making a disk, and so one might worry that it underestimates . However, previous calculations have demonstrated that on the scale of galactic disks the escape fraction is very small (Wood & Loeb, 2000; Gnedin et al., 2008; Razoumov & Sommer-Larsen, 2006; Wise & Cen, 2009), and so our inclusion of angular momentum could not increase significantly. In particular, the conclusion that is high in low-mass halos must be robust. Although our simplified model predicts zero escape fractions from brief starbursts in massive halos, the actual value of would be finite in reality due to persistent star formation histories and winds driven by supernova feedback or Ly radiation pressure (Dijkstra & Loeb, 2008). Our results are in qualitative agreement with Gnedin et al. (2008) and Razoumov & Sommer-Larsen (2006) who simulated more massive galaxies () and inferred an extremely small escape fraction values %), even in situations where the star formation rate is high ( yr-1). This results from the high gas densities in massive galaxies due the presence of a rotationally-supported, geometrically-thin disk.
To get a simple estimate of the impact of these larger galaxies, we have also run cases allowing a certain ionizing photon fraction (here assumed to be 5%, guided by local observations) to escape from halos of mass . The results are shown for two cases in Fig. 6 (dotted lines). The reported trend of an increasing for remains clearly visible.
Finally, we note that the trend we find for the increase of the escape fraction with redshift should be enhanced if the initial mass function of stars was tilted towards more massive stars. This is because a higher production rate of ionizing photons would allow the ionization front to ionize the surrounding hydrogen blanket even faster than we calculated.
Acknowledgments
Our computations were based on the Scipy open source scientific tools for Python http://www.scipy.org/. This work was supported in part by NSF grant AST-0907890 and NASA grants NNX08AL43G and NNA09DB30A.
References
- Barkana & Loeb (2001) Barkana, R., & Loeb, A. 2001, Phys. Rep., 349, 125
- Bolton & Haehnelt (2007) Bolton, J. S., & Haehnelt, M. G. 2007, MNRAS, 382, 325
- Boutsia et al. (2011) Boutsia, K., et al. 2011, ApJ, 736, 41
- Bouwens et al. (2012) Bouwens, R. J., et al. 2012, ApJ, 752, L5
- Caffau et al. (2011) Caffau, E., et al. 2011, Nature, 477, 67
- Cayrel et al. (2004) Cayrel, R., et al. 2004, A&A, 416, 1117
- Ciardi & Ferrara (2005) Ciardi, B., & Ferrara, A. 2005, Space Sci. Rev., 116, 625
- Ciardi et al. (2000) Ciardi, B., Ferrara, A., & Abel, T. 2000, ApJ, 533, 594
- Dekel & Woo (2003) Dekel, A., & Woo, J. 2003, MNRAS, 344, 1131
- Dijkstra et al. (2004) Dijkstra, M., Haiman, Z., Rees, M. J., & Weinberg, D. H. 2004, ApJ, 601, 666
- Dijkstra & Loeb (2008) Dijkstra, M., & Loeb, A. 2008, MNRAS, 391, 457
- Dove et al. (2000) Dove, J. B., Shull, J. M., & Ferrara, A. 2000, ApJ, 531, 846
- Fernández-Soto et al. (2003) Fernández-Soto, A., Lanzetta, K. M., & Chen, H.-W. 2003, MNRAS, 342, 1215
- Finkelstein et al. (2012) Finkelstein, S. L., et al. 2012, ArXiv e-prints
- Giallongo et al. (2008) Giallongo, E., et al. 2008, A&A, 482, 349
- Gnedin (2000) Gnedin, N. Y. 2000, ApJ, 542, 535
- Gnedin et al. (2008) Gnedin, N. Y., Kravtsov, A. V., & Chen, H.-W. 2008, ApJ, 672, 765
- González et al. (2011) González, V., Labbé, I., Bouwens, R. J., Illingworth, G., Franx, M., & Kriek, M. 2011, ApJ, 735, L34
- Grazian et al. (2011) Grazian, A., et al. 2011, A&A, 532, A33
- Greif et al. (2012) Greif, T. H., Bromm, V., Clark, P. C., Glover, S. C. O., Smith, R. J., Klessen, R. S., Yoshida, N., & Springel, V. 2012, MNRAS, 424, 399
- Haiman et al. (1996) Haiman, Z., Rees, M. J., & Loeb, A. 1996, ApJ, 467, 522
- Inoue et al. (2006) Inoue, A. K., Iwata, I., & Deharveng, J.-M. 2006, MNRAS, 371, L1
- Iwata et al. (2009) Iwata, I., et al. 2009, ApJ, 692, 1287
- Kitayama et al. (2000) Kitayama, T., Tajiri, Y., Umemura, M., Susa, H., & Ikeuchi, S. 2000, MNRAS, 315, L1
- Kuhlen & Faucher-Giguère (2012) Kuhlen, M., & Faucher-Giguère, C.-A. 2012, MNRAS, 423, 862
- Labbé et al. (2010) Labbé, I., et al. 2010, ApJ, 708, L26
- Larson et al. (2011) Larson, D., et al. 2011, ApJS, 192, 16
- Leitherer et al. (1999) Leitherer, C., et al. 1999, ApJS, 123, 3
- Loeb & Furlanetto (2013) Loeb, A., & Furlanetto, S. 2013, The First Galaxies in the Universe (Princeton University Press, in press)
- Machacek et al. (2001) Machacek, M. E., Bryan, G. L., & Abel, T. 2001, ApJ, 548, 509
- Makino et al. (1998) Makino, N., Sasaki, S., & Suto, Y. 1998, ApJ, 497, 555
- Maselli et al. (2003) Maselli, A., Ferrara, A., & Ciardi, B. 2003, MNRAS, 345, 379
- Mesinger & Dijkstra (2008) Mesinger, A., & Dijkstra, M. 2008, MNRAS, 390, 1071
- Mitra et al. (2012a) Mitra, S., Choudhury, T. R., & Ferrara, A. 2012a, MNRAS, 419, 1480
- Mitra et al. (2012b) Mitra, S., Ferrara, A., & Choudhury, T. R. 2012b, ArXiv e-prints
- Muñoz & Loeb (2011) Muñoz, J. A., & Loeb, A. 2011, ApJ, 729, 99
- Munshi et al. (2012) Munshi, F., et al. 2012, ArXiv e-prints
- Navarro et al. (1997) Navarro, J. F., Frenk, C. S., & White, S. D. M. 1997, ApJ, 490, 493
- Okamoto et al. (2008) Okamoto, T., Gao, L., & Theuns, T. 2008, MNRAS, 390, 920
- Pawlik et al. (2011) Pawlik, A. H., Milosavljević, M., & Bromm, V. 2011, ApJ, 731, 54
- Pawlik et al. (2012) Pawlik, A. H., Milosavljevic, M., & Bromm, V. 2012, ArXiv e-prints
- Prada et al. (2012) Prada, F., Klypin, A. A., Cuesta, A. J., Betancort-Rijo, J. E., & Primack, J. 2012, MNRAS, 423, 3018
- Razoumov & Sommer-Larsen (2006) Razoumov, A. O., & Sommer-Larsen, J. 2006, ApJ, 651, L89
- Salvadori & Ferrara (2009) Salvadori, S., & Ferrara, A. 2009, MNRAS, 395, L6
- Salvadori & Ferrara (2012) —. 2012, MNRAS, 421, L29
- Salvaterra et al. (2011) Salvaterra, R., Ferrara, A., & Dayal, P. 2011, MNRAS, 414, 847
- Schneider et al. (2008) Schneider, R., Salvaterra, R., Choudhury, T. R., Ferrara, A., Burigana, C., & Popa, L. A. 2008, MNRAS, 384, 1525
- Shapley et al. (2006) Shapley, A. E., Steidel, C. C., Pettini, M., Adelberger, K. L., & Erb, D. K. 2006, ApJ, 651, 688
- Sheth & Tormen (2002) Sheth, R. K., & Tormen, G. 2002, MNRAS, 329, 61
- Siana et al. (2007) Siana, B., et al. 2007, ApJ, 668, 62
- Stark et al. (2009) Stark, D. P., Ellis, R. S., Bunker, A., Bundy, K., Targett, T., Benson, A., & Lacy, M. 2009, ApJ, 697, 1493
- Steidel et al. (2001) Steidel, C. C., Pettini, M., & Adelberger, K. L. 2001, ApJ, 546, 665
- Trac & Cen (2007) Trac, H., & Cen, R. 2007, ApJ, 671, 1
- Vanzella et al. (2012a) Vanzella, E., et al. 2012a, ApJ, 751, 70
- Vanzella et al. (2012b) —. 2012b, MNRAS, 424, L54
- Wise & Cen (2009) Wise, J. H., & Cen, R. 2009, ApJ, 693, 984
- Wood & Loeb (2000) Wood, K., & Loeb, A. 2000, ApJ, 545, 86
- Wyithe & Loeb (2003) Wyithe, J. S. B., & Loeb, A. 2003, ApJ, 586, 693