A genetic variant near olfactory receptor genes influences cilantro preference
Abstract
The leaves of the Coriandrum sativum plant, known as cilantro or coriander, are widely used in many cuisines around the world. However, far from being a benign culinary herb, cilantro can be polarizing—many people love it while others claim that it tastes or smells foul, often like soap or dirt. This soapy or pungent aroma is largely attributed to several aldehydes present in cilantro. Cilantro preference is suspected to have a genetic component, yet to date nothing is known about specific mechanisms. Here we present the results of a genome-wide association study among 14,604 participants of European ancestry who reported whether cilantro tasted soapy, with replication in a distinct set of 11,851 participants who declared whether they liked cilantro. We find a single nucleotide polymorphism (SNP) significantly associated with soapy-taste detection that is confirmed in the cilantro preference group. This SNP, rs72921001, (, odds ratio 0.81 per A allele) lies within a cluster of olfactory receptor genes on chromosome 11. Among these olfactory receptor genes is OR6A2, which has a high binding specificity for several of the aldehydes that give cilantro its characteristic odor. We also estimate the heritability of cilantro soapy-taste detection in our cohort, showing that the heritability tagged by common SNPs is low, about 0.087. These results confirm that there is a genetic component to cilantro taste perception and suggest that cilantro dislike may stem from genetic variants in olfactory receptors. We propose that OR6A2 may be the olfactory receptor that contributes to the detection of a soapy smell from cilantro in European populations.
Background
The Coriandrum sativum plant has been cultivated since at least the 2nd millennium BCE [1]. Its fruits (commonly called coriander seeds) and leaves (called cilantro or coriander) are important components of many cuisines. In particular, South Asian cuisines use both the leaves and the seeds prominently, and Latin American food often incorporates the leaves.
The desirability of cilantro has been debated for centuries. Pliny claimed that coriander had important medicinal properties: “vis magna ad refrigerandos ardores viridi” (“While green, it is possessed of very cooling and refreshing properties”) [2]. The Romans used the leaves and seeds in many dishes, including moretum (a herb, cheese, and garlic spread similar to today’s pesto) [3]; the Mandarin word for cilantro, 香菜 (xiāngcài), literally means “fragrant greens”. However, the leaves in particular have long inspired passionate hatred as well; e.g., John Gerard called it a “very stinking herbe” with leaves of “venemous quality” [4, 5].
It is not known why cilantro is so differentially perceived. The proportion of people who dislike cilantro varies widely by ancestry [6]; however, it is not clear to what extent this may be explained by differences in environmental factors, such as frequency of exposure. Genetics has been thought to play a role, but to date no studies have found genetic variants influencing cilantro taste preference.
The smell of cilantro is often described as pungent or soapy. It is suspected, although not proven, that cilantro dislike is largely driven by the odor rather than the taste. The key aroma components in cilantro consist of various aldehydes, in particular (E)-2-alkenals and n-aldehydes [7, 8]. The unsaturated aldehydes (mostly decanal and dodecanal) in cilantro are described as fruity, green, and pungent; the (E)-2-alkenals (mostly (E)-2-decenal and (E)-2-dodecenal) as soapy, fatty, “like cilantro”, or pungent [7, 8].
Several families of genes are important for taste and smell. The TAS1R and TAS2R families form sweet, umami, and bitter taste receptors [9, 10]. The olfactory receptor family contains about 400 functional genes in the human genome. Each receptor binds to a set of chemicals, enabling one to recognize specific odorants or tastants. Genetic differences in many of these receptors are known to play a role in how we perceive tastes and smells [11, 12, 13, 14].
Results and discussion
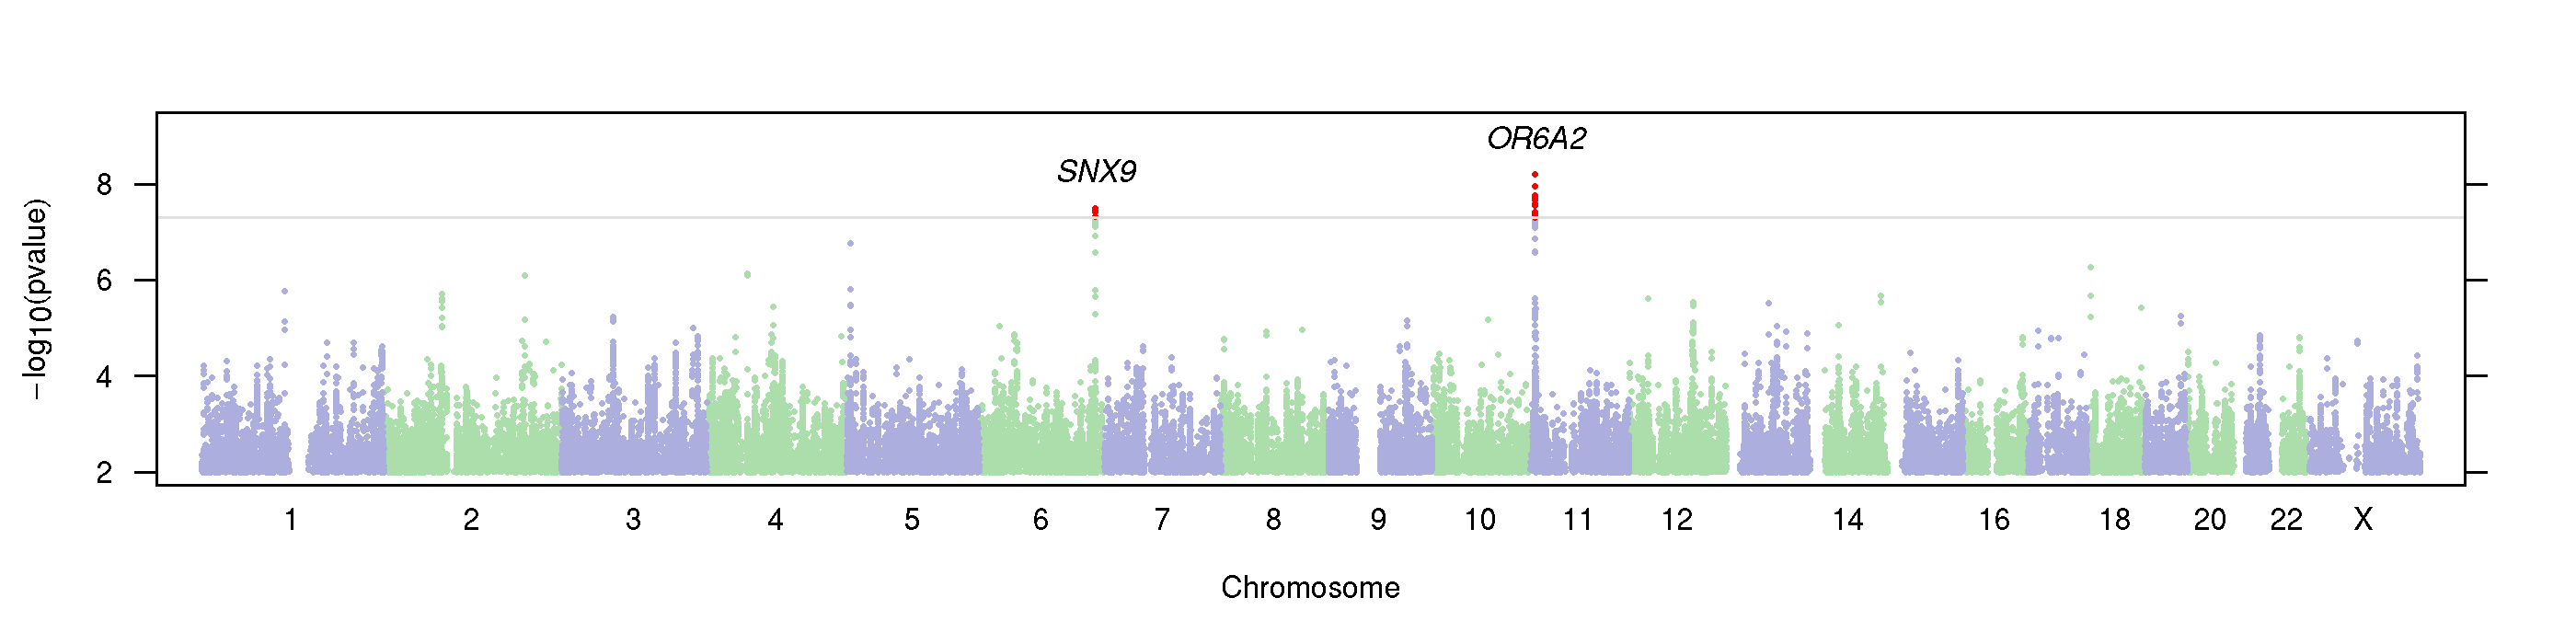
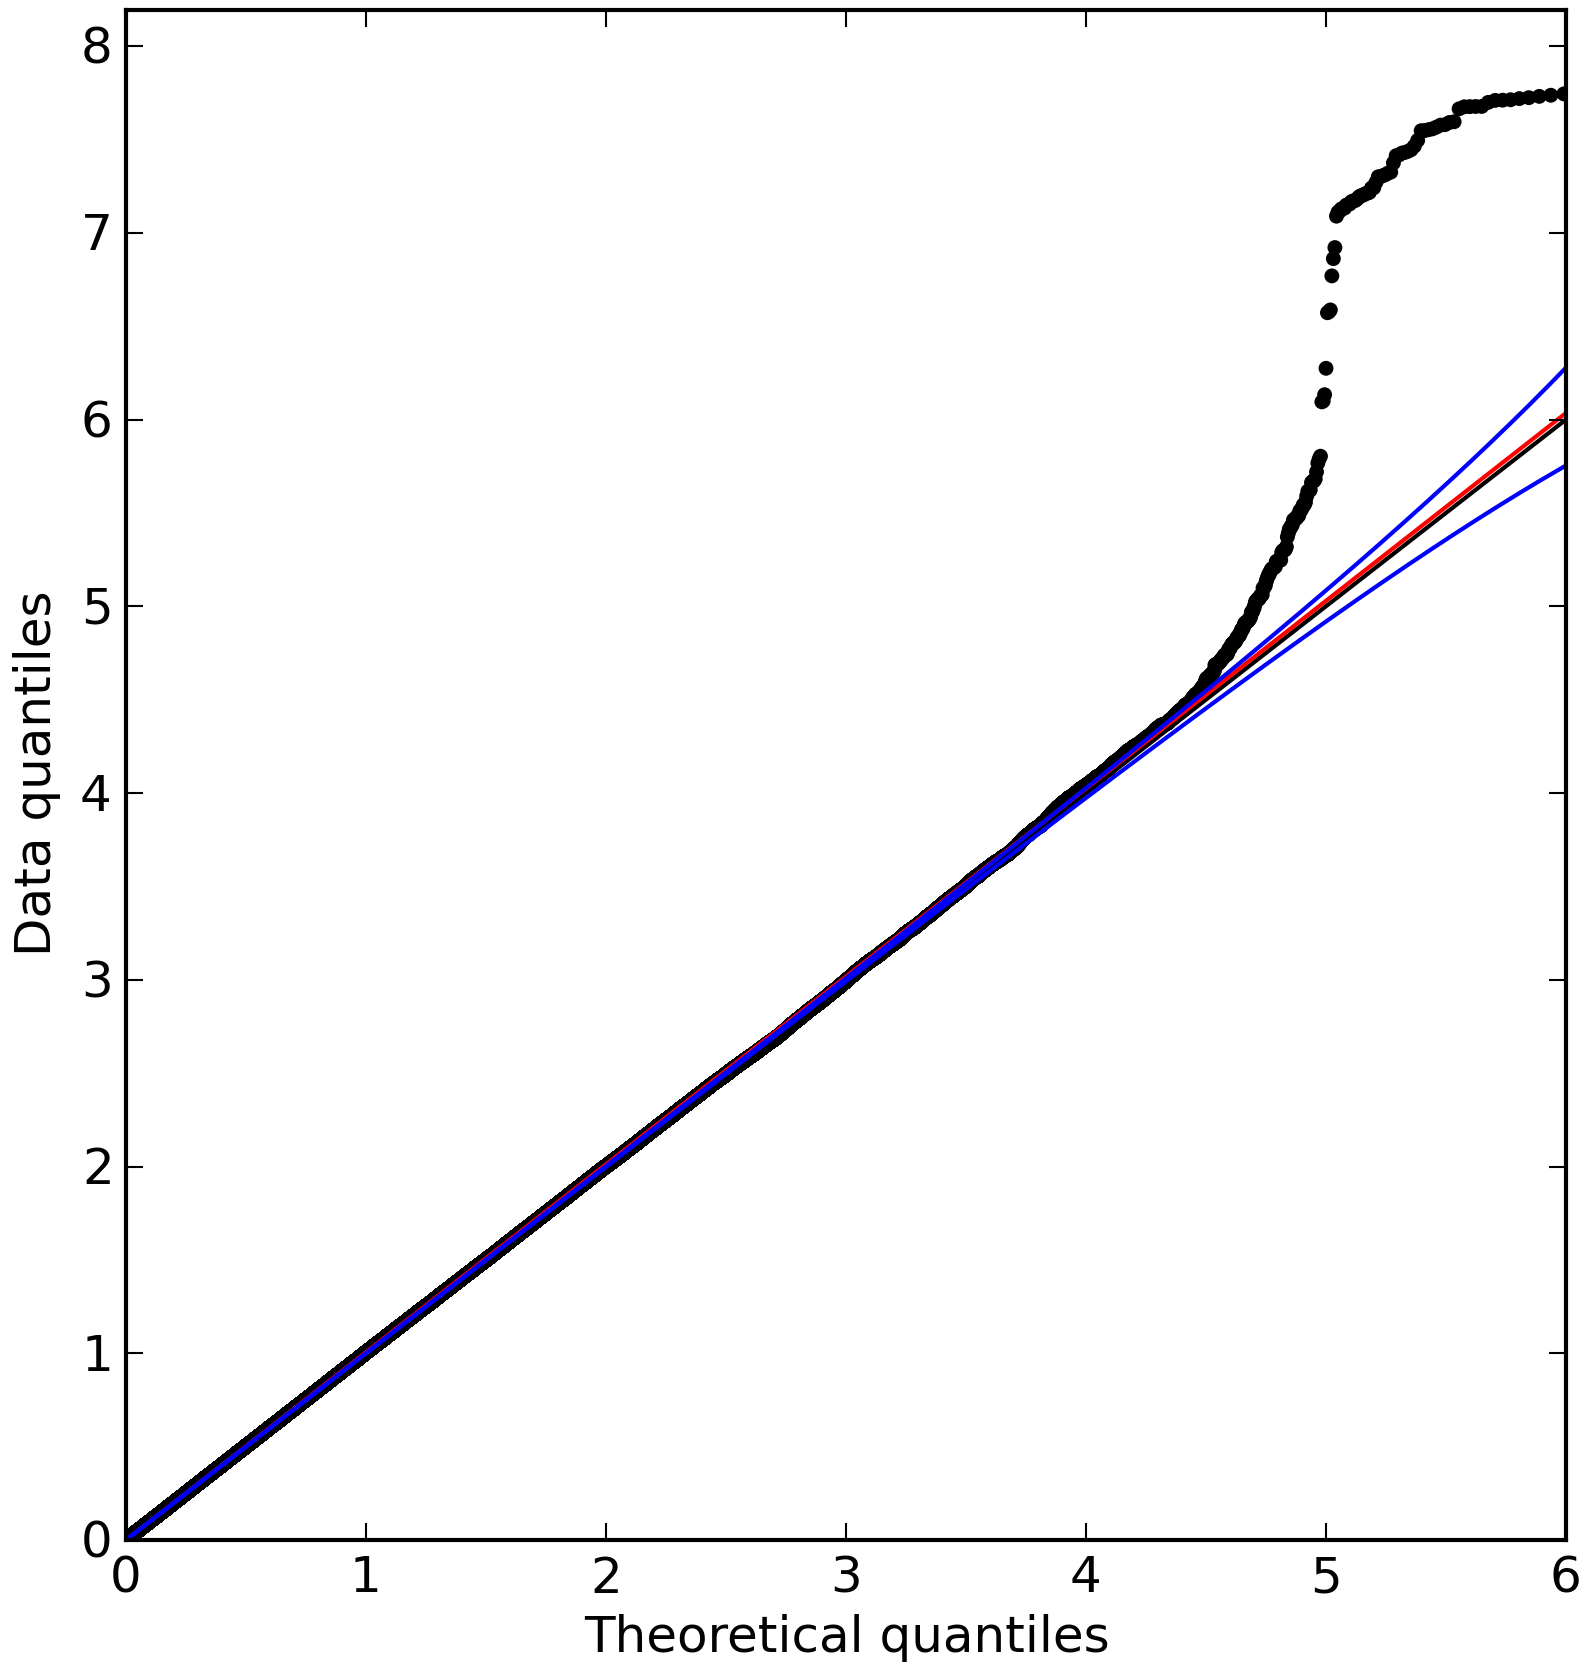
Here we report the first ever genome-wide association study (GWAS) of cilantro soapy-taste detection. Briefly, the GWAS was conducted in 14,604 unrelated participants of primarily European ancestry who responded to an online questionnaire asking whether they thought cilantro tasted like soap (Table 1). Two single nucleotide polymorphisms (SNPs) were significant genome-wide () in this population. One SNP, in a cluster of olfactory receptors, replicated in a non-overlapping group of 11,851 participants (again, unrelated and of primarily European ancestry) who reported whether they liked or disliked cilantro (see Methods for full details). Figure 1 shows -values across the whole genome; Figure 3 shows -values near the most significant associations. A quantile-quantile plot (Figure 2) shows little () global inflation of -values. Index SNPs with -values under are shown in Table 2 (along with replication -values).
| N | Female | Age (SD) | |
|---|---|---|---|
| Tastes soapy | 1994 | 0.566 | 49.0 (15.0) |
| Doesn’t taste soapy | 12610 | 0.489 | 48.3 (15.2) |
| Total | 14604 | 0.500 | 48.4 (15.2) |
| Dislikes cilantro | 3181 | 0.487 | 47.1 (16.6) |
| Likes cilantro | 8906 | 0.420 | 43.8 (14.5) |
| Total | 12087 | 0.438 | 44.7 (15.1) |
| SNP | chr | pos | gene | allele | MAF | OR (CI) | |||
|---|---|---|---|---|---|---|---|---|---|
| rs72921001 | 11 | 6,889,648 | OR6A2 | C/A | 0.364 | 0.969 | 0.0057 | 0.809 (0.753 – 0.870) | |
| rs114184611 | 6 | 158,311,499 | SNX9 | C/T | 0.077 | 0.980 | 0.49 | 0.679 (0.588 – 0.784) | |
| chr5:4883483 | 5 | 4,883,483 | ADAMTS16 | C/T | 0.032 | 0.885 | 0.51 | 0.526 (0.405 – 0.683) | |
| rs7227945 | 18 | 4,251,279 | DLGAP1/LOC642597 | T/G | 0.055 | 0.920 | 0.96 | 1.447 (1.258 – 1.663) | |
| rs6554267 | 4 | 56,158,891 | KDR/SRD5A3 | T/G | 0.019 | 0.651 | 0.85 | 1.975 (1.529 – 2.549) | |
| rs13412810 | 2 | 192,420,461 | MYO1B/OBFC2A | G/A | 0.141 | 0.942 | 0.78 | 0.770 (0.693 – 0.857) |
| Population | Not soapy (%) | Soapy (%) | Total | MAF | -value |
|---|---|---|---|---|---|
| Ashkenazi | 634 (85.9%) | 104 (14.1%) | 738 | 0.355 | 0.56 |
| South Europe | 458 (86.6%) | 71 (13.4%) | 529 | 0.335 | 0.25 |
| Europe all | 13213 (87.0%) | 1973 (13.0%) | 15186 | 0.373 | |
| North Europe | 11794 (87.2%) | 1736 (12.8%) | 13530 | 0.376 | |
| All | 16196 (87.6%) | 2299 (12.4%) | 18495 | 0.356 | |
| African-American | 545 (90.8%) | 55 (9.2%) | 600 | 0.224 | 0.87 |
| Latino | 820 (91.3%) | 78 (8.7%) | 898 | 0.350 | 0.29 |
| East Asia | 424 (91.6%) | 39 (8.4%) | 463 | 0.283 | 0.22 |
| South Asia | 322 (96.1%) | 13 (3.9%) | 335 | 0.371 | 0.0078 |
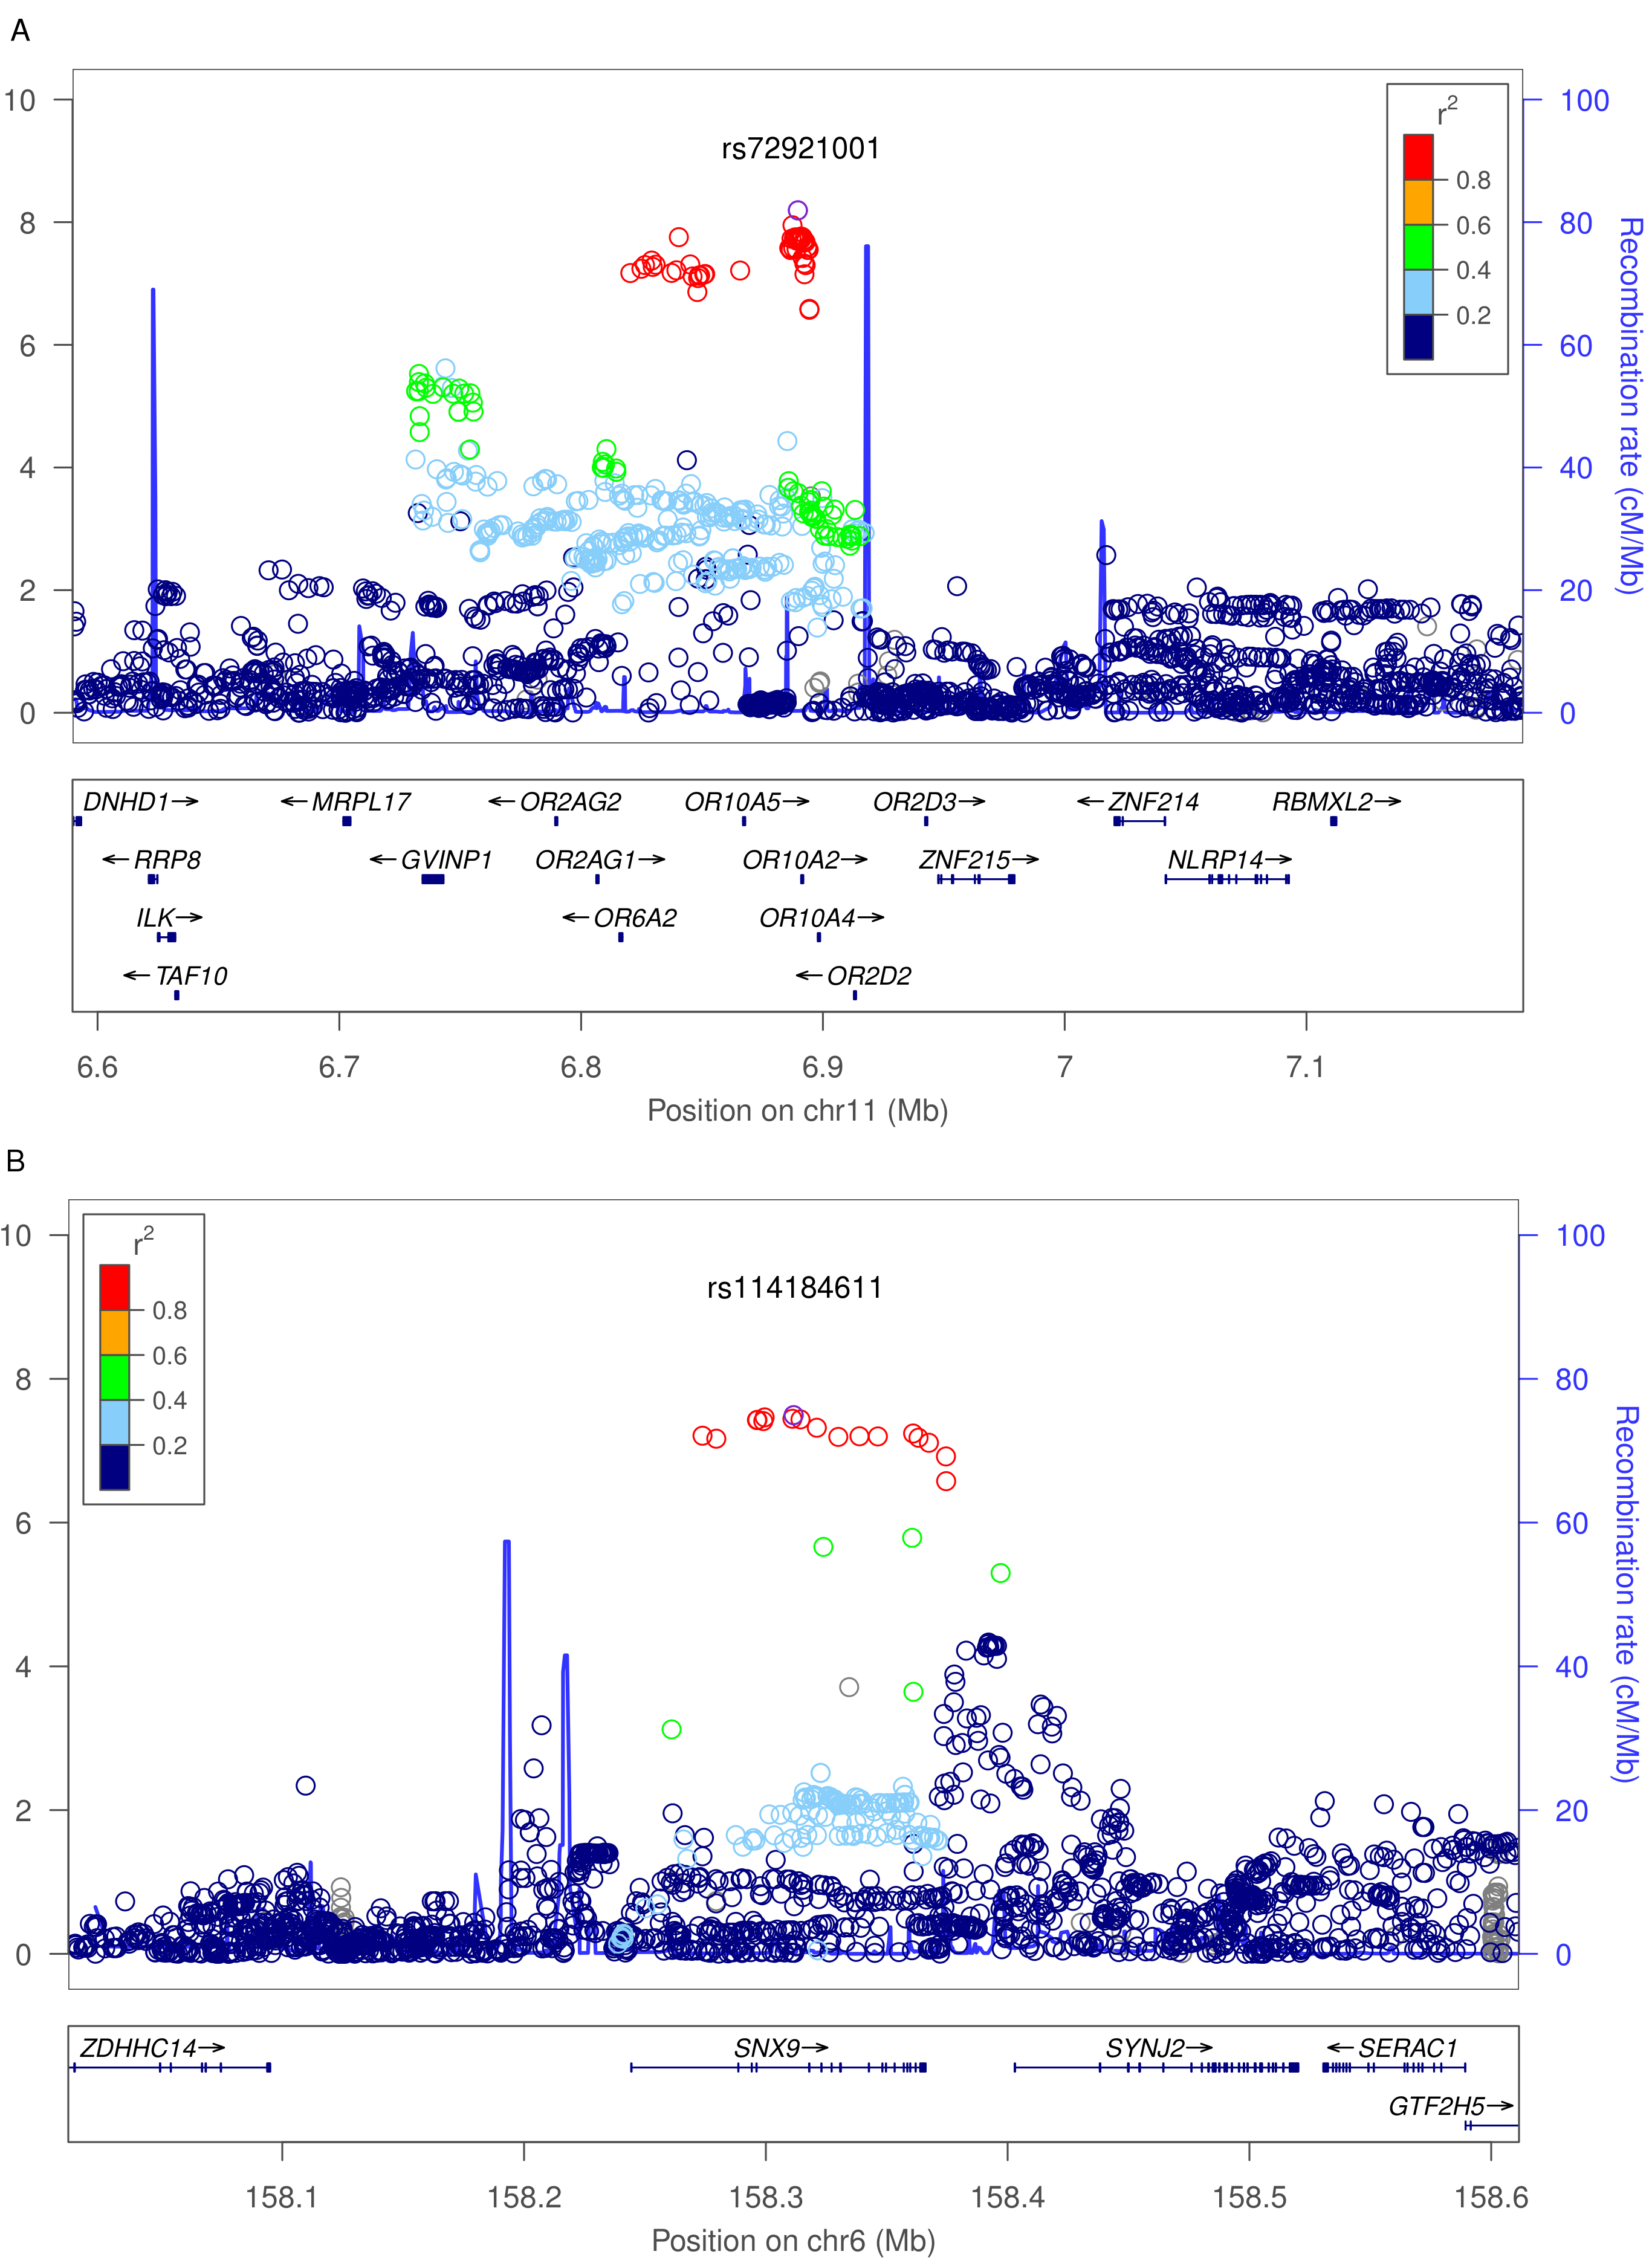
We found one significant association for cilantro soapy-taste that was confirmed in the cilantro preference population. The SNP, rs72921001 (, OR=0.81, ) lies on chromosome 11 within a cluster of eight olfactory receptor genes: OR2AG2, OR2AG1, OR6A2, OR10A5, OR10A2, OR10A4, OR2D2, and OR2D3. The C allele is associated with both detecting a soapy smell and disliking cilantro. Of the olfactory receptors encoded in this region, OR6A2 appears to be the most promising candidate underlying the association with cilantro odor detection. It is one of the most studied olfactory receptors (often as the homologous olfactory receptor I7 in rat) [15, 16, 17, 18]. A wide range of odorants have been found to activate this receptor, all of them aldehydes [16]. Among the unsaturated aldehydes, octanal binds the best to rat I7 [17]; however, compounds ranging from heptanal to undecanal also bind to this receptor [16]. Several singly unsaturated n-aldehydes also show high affinity, including (E)-2-decenal [16]. These aldehydes include several of those playing a key role in cilantro aroma, such as decanal and (E)-2-decenal. Thus, this gene is particularly interesting as a candidate for cilantro odor detection. The index SNP is also in high LD () with three non-synonymous SNPs in OR10A2, namely rs3930075, rs10839631, and rs7926083 (H43R, H207R, and K258T, respectively). Thus OR10A2 may also be a reasonable candidate gene in this region.
The second significant association, with rs114184611 (, OR=0.68, ), lies in an intron of the gene SNX9 (sorting nexin-9). See Figure 3. SNX9 encodes a multifunctional protein involved in intracellular trafficking and membrane remodeling during endocytosis [19]. It has no known function in taste or smell and did not show association with liking cilantro in the replication population. This SNP is located about 80kb upstream of SYNJ2, an inositol 5-phosphatase thought to be involved in membrane trafficking and signal transduction pathways. In candidate gene studies, SYNJ2 SNPs were found to be associated with agreeableness and symptoms of depression in the elderly [20] and with cognitive abilities [21]. In mice, a Synj2 mutation causes recessive non-syndromic hearing loss [22]. Given recent evidence that the perception of flavor may be influenced by multiple sensory inputs (cf. [23, 24]) we cannot exclude the SYNJ2-linked SNP as conveying a biologically meaningful association. While this SNP may be a false positive, it could also be the case that this SNP is associated only with detecting a soapy smell in cilantro (and not in liking cilantro).
We have used two slightly different phenotypes in our discovery and replication, soapy-taste detection and cilantro preference, which are correlated (). Detection of a soapy taste is reportedly one of the major reasons people seem to dislike cilantro. Despite having over 10,000 more people reporting cilantro preference, we have used soapy-taste detection as our primary phenotype because it is probably influenced by fewer environmental factors. Indeed, we see a stronger effect of rs72921001 on soapy-taste detection than on cilantro preference (OR of 0.81 versus 0.92).
We find significant differences by sex and ancestral population in soapy-taste detection (Tables 1 and 3). Women are more likely to detect a soapy taste (and to dislike cilantro) (OR for soapy-taste detection 1.36, ), Table 1. African-Americans, Latinos, East Asians, and South Asians are all significantly less likely to detect a soapy taste compared to Europeans (ORs of 0.676, 0.637, 0.615, and 0.270 respectively, ), see Table 3. Ashkenazi Jews and South Europeans did not show significant differences from Northern Europeans ( respectively). We tested the association between rs72921001 and soapy-taste detection within each population. Aside from the European populations, there was only a significant association in the small South Asian group (, OR=0.18, 95% CI 0.053–0.64). This association is in the same direction as the association in Europeans. Note that the GWAS population in Table 1 is a subset of the “Europe all” population in Table 3, filtered to remove relatives (Methods). While the differences in allele frequency across populations do not explain the differences in soapy-taste detection, our analysis does suggest that this SNP may affect soapy-taste detection in non-European populations as well.
We calculated the heritability for cilantro soapy-taste detection using the GCTA software [25]. We found a low heritability of 0.087 (, 95% CI (-0.037 – 0.211)). This estimate is a lower bound for the true heritability, as our estimate only takes into account heritability due to SNPs genotyped in this study. While this calculation does not exclude a heritability of zero, the existence of the association with rs72921001 does give a non-zero lower bound on the heritability. Despite the strength of the association of the SNP near OR6A2, it explains only about 0.5% of the variance in perceiving that cilantro tastes soapy.
There are a few possible explanations for these heritability numbers. It is possible that other genetic factors not detected here could influence cilantro preference. For example, there could be rare variants not typed in this study (possibly in partial linkage disequilibrium with rs72921001) that have a larger effect on cilantro preference. Such rare variants could cause the true heritability of this phenotype to be larger than we have calculated. For example, the heritability of height is estimated to be about 0.8 however, the heritability tagged by common SNPs is calculated at about 0.45 [26]. On the other hand, there is still considerable room between the 0.5% variance explained by rs72921001 and the estimated heritability of 8.7%. Thus it is quite possible that cilantro preference could be polygenic, as many other complex traits are (e.g., [27]). Finally, it is possible that the heritability of cilantro preference is just rather low and that, aside from the association discovered here, there is not a strong genetic component to cilantro preference. We note that there can be epigenetic modifiers of taste as well, for example, food preferences can even be transmitted to the fetus in utero through the mother’s diet [23].
Conclusions
Through a GWAS, we have shown that a SNP, rs72921001, near a cluster of olfactory receptors is significantly associated with detecting a soapy taste to cilantro. One of the genes near this SNP encodes an olfactory receptor, OR6A2, that detects the aldehydes that may make cilantro smell soapy and thus is a compelling candidate gene for the detection of the cilantro odors that give cilantro its divisive flavor.
Methods
Subjects
Participants were drawn from the customer base of 23andMe, Inc., a consumer genetics company. This cohort has been described in detail previously [14, 28]. Participants provided informed consent and participated in the research online, under a protocol approved by the external AAHRPP-accredited IRB, Ethical and Independent Review Services (E&I Review).
Phenotype data collection
On the 23andMe website, participants contribute information through a combination of research surveys (longer, more formal questionnaires) and research “snippets” (multiple-choice questions appearing as part of various 23andMe webpages). In this study, participants were asked two questions about cilantro via research snippets:
-
•
“Does fresh cilantro taste like soap to you?” (Yes/No/I’m not sure)
-
•
“Do you like the taste of fresh (not dried) cilantro?” (Yes/No/I’m not sure)
Among all 23andMe customers, 18,495 answered the first question (as either yes or no), 29,704 the second, and 15,751 both. Participants also reported their age. Sex and ancestry were determined on the basis of their genetic data. From these answers, we chose a set of 14,604 participants who answered the “soapy” question for GWAS, and 11,851 who answered only the taste preference question for a replication set.
In both the GWAS set and the replication set, all participants were of European ancestry. In either group, no two shared more than 700 cM of DNA identical by descent (IBD, approximately the lower end of sharing between a pair of first cousins). IBD was calculated using the methods described in [29]; the principal component analysis was performed as in [14]. To determine European and African-American ancestry, we used local-ancestry methods (as in [30]). Europeans had over 97% of their genome painted European, African-Americans had at least 10% African and at most 10% Asian ancestry. Other groups were built using anecstry informative markers trained on a subset of 23andMe customers who reported having four grandparents of a given ancestry.
Genotyping
Subjects were genotyped on one or more of three chips, two based on the Illumina HumanHap550+ BeadChip, the third based on the Illumina OmniExpress+ BeadChip. The platforms contained 586,916, 584,942, and 1,008,948 SNPs. Totals of 291, 5,394, and 10,184 participants (for the GWAS population) were genotyped on the platforms, respectively. A total of 1,265 individuals were genotyped on multiple chips. For all participants, we imputed genotypes in batches of 8,000–10,000 using Beagle and Minimac [31, 32, 33] against the August 2010 release of the 1000 Genomes reference haplotypes [34], as described in [35].
A total of 11,914,767 SNPs were imputed. Of these, 7,356,559 met our thresholds of minor allele frequency, average across batches of at least 0.5, and minimum across batches of at least 0.3. The minimum requirement was added to filter out SNPs that imputed less well in the batches consisting of the less dense platform. Positions and alleles are given relative to the positive strand of build 37 of the human genome.
Statistical analysis
For the GWAS, -values were calculated using a likelihood ratio test for the genotype term in the logistic regression model
where is the vector of phenotypes (coded as 1=thinks cilantro tastes soapy, 0=doesn’t), is the vector of genotypes (coded as a dosage 0–2 for the estimated number of minor alleles present), and are the projections onto the principal components. The same model was used for the replication, with the phenotype coded as 1=dislikes cilantro, 0=likes. We used the standard cutoff for genome-wide significance of to correct for the multiple tests in the GWAS. ORs and -values for the differences in soapy-taste detection between sexes and population were calculated directly, without any covariates. Table 3 uses a proxy SNP for rs72921001, as our imputation was done only in Europeans, so we did not have data for rs72921001 in other populations.
For the heritability calculations, we used the GCTA software [25]. The calculations were done on genotyped SNPs only within a group of 13,628 unrelated Europeans. Unrelated filtering here was done using GCTA to remove individuals with estimated relatedness larger than 0.025. Thus, this group is slightly different from the GWAS set, as there relatedness filtering there was done using IBD. We assumed a prevalence for soapy-taste detection of 0.13 for the transformation of heritability from the 0-1 scale to the liability scale. Otherwise, default options were used. We calculated heritability for autosomal and X chromosome SNPs separately; the estimates were 0.0869 (standard error 0.0634, -value 0.0805) for autosomal SNPs and (standard error 0.010753, -value 0.5) for the X chromosome.
Author’s contributions
NE, SW, CBD, AKK, JLM, DAH, UF, and JYT conceived and designed the experiments. NE analyzed the data and drafted the manuscript with contributions from all other authors.
Acknowledgements
We thank the customers of 23andMe for participating in this research and all the employees of 23andMe for contributing to the research.
References
- [1] D. Zohary and M. Hopf, Domestication of Plants in the Old World: The Origin and Spread of Cultivated Plants in West Asia, Europe, and the Nile Valley. Oxford University Press, USA, 2000.
- [2] J. Bostock and H. Riley, The Natural History of Pliny. No. v. 4 in Bohn’s classical library, H. G. Bohn, 1855.
- [3] P. Faas, Around the Roman table. Palgrave Macmillan, 2002.
- [4] J. Gerard, The Herball or General Historie of Plants. Theatrum Orbis Terrarum, Amsterdam, 1974 [1597 ed.].
- [5] H. Leach, “Rehabilitating the “stinking herbe”: A case study of culinary prejudice,” Gastronomica: The Journal of Food and Culture, vol. 1, no. 2, pp. 10–15, 2001.
- [6] L. Mauer, A. El-Sohemy, C. Spence, V. Harrar, B. Piqueras-Fiszman, R. Havermans, A. Roefs, C. Nederkoorn, A. Jansen, O. Mouritsen, et al., “Prevalence of cilantro (coriandrum sativum) disliking among different ethnocultural groups,” Flavour, vol. 1, no. 1, p. 8, 2012.
- [7] K. Cadwallader, D. Benitez, S. Pojjanapimol, O. Suriyaphan, and T. Singh, “Characteristic aroma components of the cilantro mimics,” in Natural Flavors and Fragrances (R. R. Frey C, ed.), vol. vol. 908, (Washington, DC), pp. 117–128, American Chemical Society, 2005.
- [8] G. Eyres, J. P. Dufour, G. Hallifax, S. Sotheeswaran, and P. J. Marriott, “Identification of character-impact odorants in coriander and wild coriander leaves using gas chromatography-olfactometry (GCO) and comprehensive two-dimensional gas chromatography-time-of-flight mass spectrometry (GC x GC-TOFMS),” J Sep Sci, vol. 28, pp. 1061–1074, Jun 2005.
- [9] X. Li, L. Staszewski, H. Xu, K. Durick, M. Zoller, and E. Adler, “Human receptors for sweet and umami taste,” Proc. Natl. Acad. Sci. U.S.A., vol. 99, pp. 4692–4696, Apr 2002.
- [10] J. Chandrashekar, K. L. Mueller, M. A. Hoon, E. Adler, L. Feng, W. Guo, C. S. Zuker, and N. J. Ryba, “T2Rs function as bitter taste receptors,” Cell, vol. 100, pp. 703–711, Mar 2000.
- [11] D. R. Reed and A. Knaapila, “Genetics of taste and smell: poisons and pleasures,” Prog Mol Biol Transl Sci, vol. 94, pp. 213–240, 2010.
- [12] U. K. Kim, E. Jorgenson, H. Coon, M. Leppert, N. Risch, and D. Drayna, “Positional cloning of the human quantitative trait locus underlying taste sensitivity to phenylthiocarbamide,” Science, vol. 299, pp. 1221–1225, Feb 2003.
- [13] A. Keller, H. Zhuang, Q. Chi, L. B. Vosshall, and H. Matsunami, “Genetic variation in a human odorant receptor alters odour perception,” Nature, vol. 449, pp. 468–472, Sep 2007.
- [14] N. Eriksson, J. M. Macpherson, J. Y. Tung, L. S. Hon, B. Naughton, S. Saxonov, L. Avey, A. Wojcicki, I. Pe’er, and J. Mountain, “Web-based, participant-driven studies yield novel genetic associations for common traits,” PLoS Genet., vol. 6, p. e1000993, 2010.
- [15] M. D. Kurland, M. B. Newcomer, Z. Peterlin, K. Ryan, S. Firestein, and V. S. Batista, “Discrimination of saturated aldehydes by the rat I7 olfactory receptor,” Biochemistry, vol. 49, pp. 6302–6304, Aug 2010.
- [16] R. C. Araneda, A. D. Kini, and S. Firestein, “The molecular receptive range of an odorant receptor,” Nat. Neurosci., vol. 3, pp. 1248–1255, Dec 2000.
- [17] D. Krautwurst, K. W. Yau, and R. R. Reed, “Identification of ligands for olfactory receptors by functional expression of a receptor library,” Cell, vol. 95, pp. 917–926, Dec 1998.
- [18] R. C. Araneda, Z. Peterlin, X. Zhang, A. Chesler, and S. Firestein, “A pharmacological profile of the aldehyde receptor repertoire in rat olfactory epithelium,” J. Physiol. (Lond.), vol. 555, pp. 743–756, Mar 2004.
- [19] W. Buajeeb, S. Poomsawat, J. Punyasingh, and S. Sanguansin, “Expression of p16 in oral cancer and premalignant lesions,” J. Oral Pathol. Med., vol. 38, pp. 104–108, Jan 2009.
- [20] M. Luciano, L. M. Lopez, M. H. de Moor, S. E. Harris, G. Davies, T. Nutile, R. F. Krueger, T. Esko, D. Schlessinger, T. Toshiko, J. L. Derringer, A. Realo, N. K. Hansell, M. L. Pergadia, A. K. Pesonen, S. Sanna, A. Terracciano, P. A. Madden, B. Penninx, P. Spinhoven, C. A. Hartman, B. A. Oostra, A. C. Janssens, J. G. Eriksson, J. M. Starr, A. Cannas, L. Ferrucci, A. Metspalu, M. J. Wright, A. C. Heath, C. M. van Duijn, L. J. Bierut, K. Raikkonen, N. G. Martin, M. Ciullo, D. Rujescu, D. I. Boomsma, and I. J. Deary, “Longevity candidate genes and their association with personality traits in the elderly,” Am. J. Med. Genet. B Neuropsychiatr. Genet., vol. 159B, pp. 192–200, Mar 2012.
- [21] L. M. Lopez, S. E. Harris, M. Luciano, D. Liewald, G. Davies, A. J. Gow, A. Tenesa, A. Payton, X. Ke, L. J. Whalley, H. Fox, P. Haggerty, W. Ollier, A. Pickles, D. J. Porteous, M. A. Horan, N. Pendleton, J. M. Starr, and I. J. Deary, “Evolutionary conserved longevity genes and human cognitive abilities in elderly cohorts,” Eur. J. Hum. Genet., vol. 20, pp. 341–347, Mar 2012.
- [22] S. S. Manji, L. H. Williams, K. A. Miller, L. M. Ooms, M. Bahlo, C. A. Mitchell, and H. H. Dahl, “A mutation in synaptojanin 2 causes progressive hearing loss in the ENU-mutagenised mouse strain Mozart,” PLoS ONE, vol. 6, no. 3, p. e17607, 2011.
- [23] N. Bakalar, “Sensory science: partners in flavour,” Nature, vol. 486, pp. 4–5, Jun 2012.
- [24] B. Smith, “Perspective: complexities of flavour,” Nature, vol. 486, p. S6, Jun 2012.
- [25] J. Yang, S. H. Lee, M. E. Goddard, and P. M. Visscher, “GCTA: a tool for genome-wide complex trait analysis,” Am. J. Hum. Genet., vol. 88, pp. 76–82, Jan 2011.
- [26] J. Yang, B. Benyamin, B. P. McEvoy, S. Gordon, A. K. Henders, D. R. Nyholt, P. A. Madden, A. C. Heath, N. G. Martin, G. W. Montgomery, M. E. Goddard, and P. M. Visscher, “Common SNPs explain a large proportion of the heritability for human height,” Nat. Genet., vol. 42, pp. 565–569, Jul 2010.
- [27] H. Lango Allen, K. Estrada, G. Lettre, S. I. Berndt, M. N. Weedon, F. Rivadeneira, C. J. Willer, A. U. Jackson, S. Vedantam, S. Raychaudhuri, T. Ferreira, A. R. Wood, R. J. Weyant, A. V. Segre, E. K. Speliotes, E. Wheeler, N. Soranzo, J. H. Park, J. Yang, D. Gudbjartsson, N. L. Heard-Costa, J. C. Randall, L. Qi, A. Vernon Smith, R. Magi, T. Pastinen, L. Liang, I. M. Heid, J. Luan, G. Thorleifsson, T. W. Winkler, M. E. Goddard, K. Sin Lo, C. Palmer, T. Workalemahu, Y. S. Aulchenko, A. Johansson, M. C. Zillikens, M. F. Feitosa, T. Esko, T. Johnson, S. Ketkar, P. Kraft, M. Mangino, I. Prokopenko, D. Absher, E. Albrecht, F. Ernst, N. L. Glazer, and et al., “Hundreds of variants clustered in genomic loci and biological pathways affect human height,” Nature, vol. 467, pp. 832–838, Oct 2010.
- [28] J. Y. Tung, C. B. Do, D. A. Hinds, A. K. Kiefer, J. M. Macpherson, A. B. Chowdry, U. Francke, B. T. Naughton, J. L. Mountain, A. Wojcicki, and N. Eriksson, “Efficient Replication of over 180 Genetic Associations with Self-Reported Medical Data,” PLoS ONE, vol. 6, p. e23473, 2011.
- [29] B. Henn, L. Hon, J. M. Macpherson, N. Eriksson, S. Saxonov, I. Pe’er, and J. L. Mountain, “Cryptic distant relatives are common in both isolated and cosmopolitan genetic samples,” PLoS ONE, vol. 7, no. 4, p. e34267, 2012.
- [30] N. Eriksson, J. Y. Tung, A. K. Kiefer, D. A. Hinds, U. Francke, J. L. Mountain, and C. B. Do, “Novel associations for hypothyroidism include known autoimmune risk loci,” PLoS ONE, vol. 7, no. 4, p. e34442, 2012.
- [31] S. R. Browning and B. L. Browning, “Rapid and accurate haplotype phasing and missing-data inference for whole-genome association studies by use of localized haplotype clustering,” Am. J. Hum. Genet., vol. 81, pp. 1084–1097, Nov 2007.
- [32] B. Howie, C. Fuchsberger, M. Stephens, J. Marchini, and G. R. Abecasis, “Fast and accurate genotype imputation in genome-wide association studies through pre-phasing,” Nat. Genet., vol. 44, no. 8, pp. 955–959, 2012.
- [33] G. Abecasis and C. Fuchsberger, “minimac.” http://genome.sph.umich.edu/wiki/minimac.
- [34] D. Altshuler, R. M. Durbin, G. R. Abecasis, D. R. Bentley, A. Chakravarti, A. G. Clark, F. S. Collins, F. M. De La Vega, P. Donnelly, M. Egholm, P. Flicek, S. B. Gabriel, R. A. Gibbs, B. M. Knoppers, E. S. Lander, H. Lehrach, E. R. Mardis, G. A. McVean, D. A. Nickerson, L. Peltonen, A. J. Schafer, S. T. Sherry, J. Wang, R. Wilson, R. A. Gibbs, D. Deiros, M. Metzker, D. Muzny, J. Reid, D. Wheeler, and et al., “A map of human genome variation from population-scale sequencing,” Nature, vol. 467, pp. 1061–1073, Oct 2010.
- [35] N. Eriksson, G. M. Benton, C. B. Do, A. K. Kiefer, J. L. Mountain, D. A. Hinds, U. Francke, and J. Y. Tung, “Genetic variants associated with breast size also influence breast cancer risk,” BMC Med Genet, vol. 13, p. 53, Jun 2012.