Characterizing the Mid-IR Extragalactic Sky with WISE and SDSS
Abstract
The Wide-field Infrared Survey Explorer (WISE) has completed its all-sky survey in four channels at 3.4 - 22 m, detecting hundreds of millions of objects. We merge the \wise mid-infrared data with optical data from the Sloan Digital Sky Survey (SDSS) and provide a phenomenological characterization of \wise extragalactic sources. \wise is most sensitive at 3.4 m () and least sensitive at 22 m (). The band probes massive early-type galaxies out to . This is more distant than SDSS identified early-type galaxies, consistent with the fact that 28% of 3.4 m sources have faint or no -band counterparts (). In contrast, 92 - 95% of 12 m and 22 m sources have SDSS optical counterparts with . \wise 3.4 m detects 89.8% of the entire SDSS QSO catalog at SNRW1 7, but only 18.9% at 22 m with SNRW4 5. We show that \wise colors alone are effective in isolating stars (or local early-type galaxies), star-forming galaxies and strong AGN/QSOs at . We highlight three major applications of \wise colors: (1) Selection of strong AGN/QSOs at using and criteria, producing a better census of this population. The surface density of these strong AGN/QSO candidates is per deg2. (2) Selection of dust-obscured, type-2 AGN/QSO candidates. We show that \wise , combined with (Vega) colors can be used to identify type-2 AGN candidates. The fraction of these type-2 AGN candidates is 1/3rd of all \wise color-selected AGNs. (3) Selection of ultra-luminous infrared galaxies at with extremely red colors, or well-detected 22 m sources lacking detections in the 3.4 and 4.6 m bands. The surface density of ULIRG candidates selected with is per deg2 at SNR (the corresponding, lowest flux density of 2.5 mJy), which is consistent with that inferred from smaller area Spitzer surveys. Optical spectroscopy of a small number of these high-redshift ULIRG candidates confirms our selection, and reveals a possible trend that optically fainter or redder candidates are at higher redshifts.
1 Introduction
With the power of large number statistics, wide-area astronomical surveys in this decade have made many significant discoveries. A new generation of high-precision, wide-area optical imaging surveys are being proposed for the end of this decade to address fundamental questions in cosmology, galaxy formation and to search for extrasolar planets. Most recently, the advent of the Wide-field Infrared Survey Explorer (\wise; Wright et al. 2010) has provided the community with an unprecedented dataset in the mid-infrared. This unique NASA mission mapped the entire sky in four bands at 3.4, 4.6, 12 and 22 m ( through ), with 5 point source sensitivities better than 0.05, 0.1, 0.75 and 6 mJy, respectively. \wise 12 m images are more than 100 times deeper than previous all-sky infrared survey missions, such as that provided by the Infrared Astronomical Satellite (IRAS; Neugebauer et al. 1984), while the 3.4 m data are 1.5 magnitude (a factor of 4 in flux density) deeper than the Two-Micron All-Sky Survey (2MASS; Skrutskie et al. 2006) data for sources with spectral energy distributions similar to an A0 star; \wise is even more sensitive for red sources like K-stars, early-type galaxies, AGN, and dust-obscured galaxies.
has made two public data releases, including coadded atlas images and source catalogs. The first was the preliminary release in April 2011, covering roughly half of the sky, and the second was the all-sky data release in March 2012, covering the entire sky. Although \wise has a significantly smaller aperture and the angular resolution is only half that of Spitzer, its unique all-sky coverage enables selection of large samples of extragalactic sources, allowing statistical studies of stellar photospheric emission at 3.4 and 4.6 m and dust emission at 12 and 22 m. The primary goal of this paper is to provide an empirical characterization of \wise extragalactic sources, and to identify the types of sources which can be isolated using mid-infrared colors. To achieve this goal, we combine \wise mid-infrared data with optical data from the Sloan Digital Sky Survey (SDSS) seventh data release (DR7; Abazajian et al. 2009). We characterize the color distributions and source types using broad-band photometry and spectroscopic information. The motivation for such a phenomenological study is to give the community a summary of the observational properties and the limitations of two large surveys, particularly for mid-infrared extragalactic objects. More detailed, quantitative analyses of specific extragalactic populations are discussed in companion papers by the \wise extragalactic science team. Specifically, Griffith et al. (2011) and Tsai et al. (2012a) discuss \wise selection of low-metallicity blue compact dwarf galaxies at . Donoso et al. (2012) examines the origin of 12 m emission in mid-infrared galaxies at using \wise data in conjunction with SDSS DR7 spectroscopic data, while Lake et al. (2012) uses Keck spectroscopy to study the redshift distribution of flux-limited \wise samples. Stern et al. (2012) and Assef et al. (2012) present detailed studies of \wise-selected AGN within the COSMOS and Boötes fields, respectively, including careful analyses of completeness and reliability of \wise AGN selection using color. Eisenhardt et al. (2012) presents the first results for ultraluminous infrared galaxies (ULIRGs) discovered by \wise. Wu et al. (2012) and Yan et al. (2012) present the far-infrared properties and spectral energy distributions (SEDs) of similarly selected galaxies based on ground-based millimeter and Herschel space-based far-infrared data, respectively. Bridge et al. (2012) discusses the interesting Ly properties of the \wise ULIRG population, emphasizing the high rate of extended emission, so-called “Ly blobs”. Tsai et al. (2012b) and Stern et al. (in prep) present detailed studies of two interesting \wise-selected AGN, while Jarrett et al. (2012) and Petty et al. (2012) study spatially resolved, local () galaxies with \wise. Blain et al. (2012) presents the \wise properties of optically selected QSOs. Finally, Gettings et al. (2012) discusses the first results of using \wise to identify high-redshift galaxy clusters.
The organization of this paper is as follows. Section 2 describes the \wise and SDSS data, including the \wise sample selection and the SDSS optical data used by this paper. Section 3 presents the main results, providing the technical details of the catalog matching and summarizing the brightness, color and photometric redshift distributions for galaxies detected by both \wise and SDSS (§ 3.1). We identify the characteristic color criteria which can be used to select large samples of strong AGN/QSOs (§ 3.2), type-2 AGN candidates (§ 3.3) and potential ULIRGs (§ 3.4). Section 4 summarizes the main conclusions and discusses the implications for future studies using \wise. Throughout the paper, we adopt an = 0.27, = 0.73 and = 71 cosmology.
2 Data
2.1 WISE-SDSS sky coverage
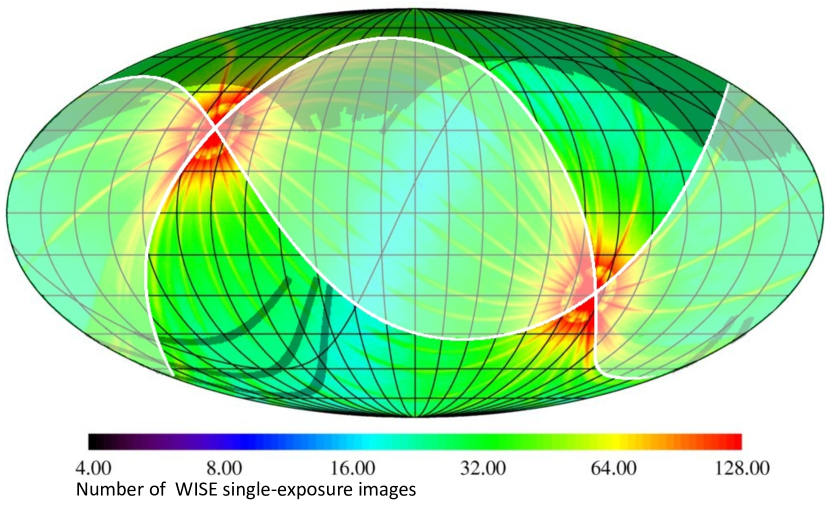
The data used by this paper are drawn from the overlapping sky region where both \wise preliminary public release data and SDSS DR7 data are available. Although this area is only 1/4th of the total SDSS area, the number of galaxies included in our analysis is , large enough for the purposes of this paper. Because this paper started with the preliminary release data, we kept the same overlap region between the preliminary release data and SDSS DR7, but the actual \wise photometry are taken from the all-sky data release. Figure 1 presents the full-sky coverage map from \wise, with colors indicating the number of repeated single exposures at each sky position. Overlaid in the figure are the coverages of the SDSS DR7 data and the \wise preliminary release data. The overlap area between DR7 and the \wise preliminary release is 2344 deg2 and defines the area analyzed in the rest of this paper. This area is slightly less than 30% of the total SDSS areal coverage, and is 5.7% of the entire sky.
One characteristic feature of the \wise mission is that it does not have uniform depth-of-coverage. For both the preliminary and the all-sky data release, the median depth-of-coverage is 15.65, 15.55, 14.85 and 14.84 exposures at and respectively (each single exposure has 11 seconds). 95% of the sky has coverage at , and at 111See Section 6 in the Explanatory Supplement to the \wise All-Sky Data Release Products, http://wise2.ipac.caltech.edu/docs/release/allsky/expsup/index.html. Taking 10 exposures per position as the depth-of-coverage in and , and 9 in and , the sensitivities are 17.30 mag (0.037 mJy), 15.84 mag (0.079 mJy), 11.59 mag (0.67 mJy) and 8.00 mag (5.10 mJy) for the four bands, respectively.
2.2 WISE data
We start with the \wise preliminary public release source catalog (Cutri et al. 2011)222A detailed description of the catalog can be found in the Explanatory Supplement to the \wise Preliminary Data Release Products at http://wise2.ipac.caltech.edu/docs/release/prelim/expsup/.. This catalog includes all sources detected in at least one band with photometric signal-to-noise ratio (SNR) after removing all artifacts. As described in the explanatory supplement to the preliminary data release products, source detection and photometric measurements are performed on all four bands simultaneously. The released catalog contains photometric measurements (or limits) in all four bands.
is the most sensitive at 3.4 m and the least sensitive at 22 m; the minimum sensitivities for these two bands are 0.05 and 6 mJy, respectively. For , the sensitivity ratio corresponds to a mid-infrared spectral index . Among all \wise -detected galaxies at the limiting depth of that band, only 2% of the sources are also detected in , implying extremely red mid-infrared spectral energy distributions (SEDs), redder than .
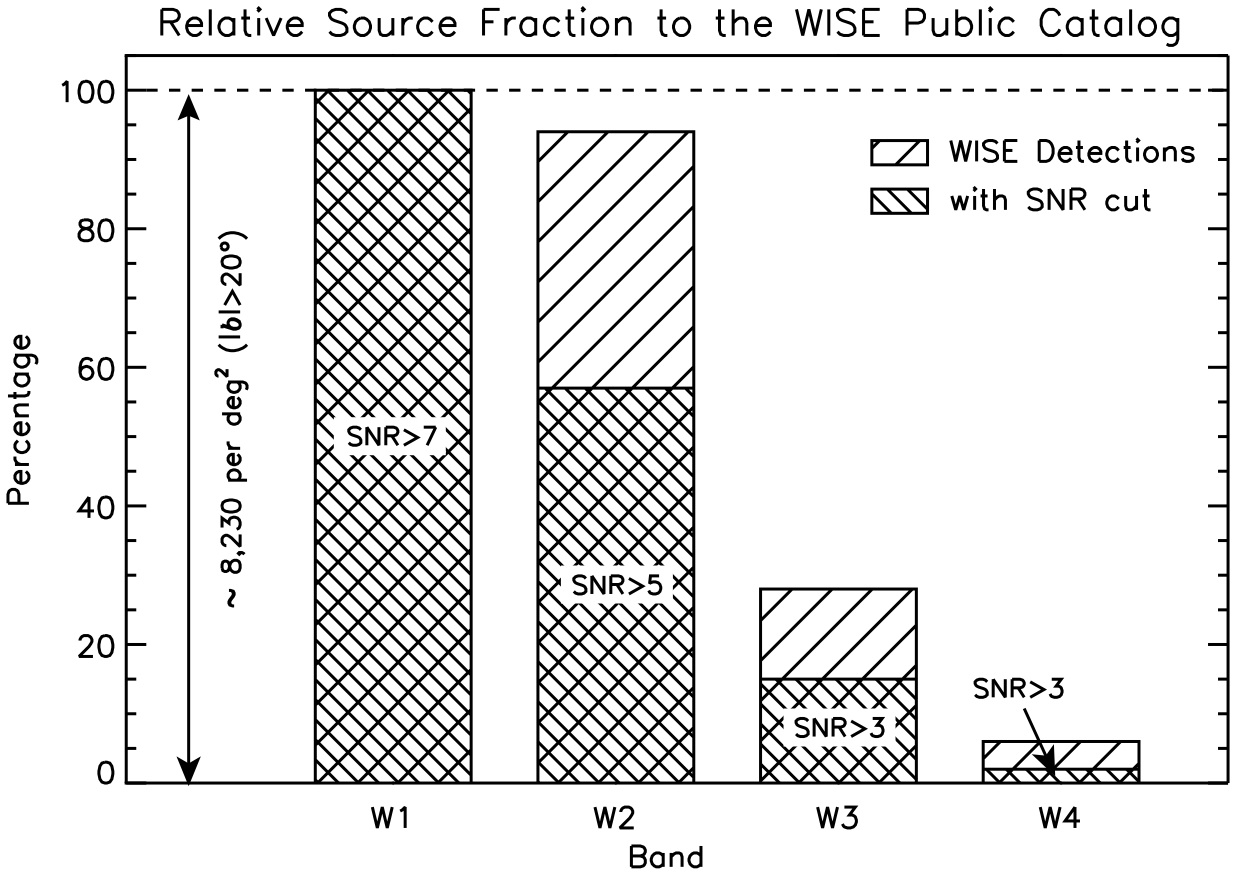
The public released catalog contains a very small number of sources which are detected only in and/or , but not in and/or (e.g., Eisenhardt et al. 2012). Due to the large sensitivity differences between and , the entire catalog is essentially a 3.4 m-selected sample with SNR 7 (); only 0.16% of the catalog is very faint in but bright in one of the other three \wise bands (e.g., SNR, but SNR 7 for any of the other three bands). Therefore, we call this original catalog from the \wise data archive, without any additional cuts, the W1 sample. Many sources in this preliminary public release catalog have SNR, but low SNR in the other three \wise bands. When we study the color distributions, it becomes necessary to require the color errors to be small relative to the range of colors. Specifically, the color for \wise galaxies roughly spans the narrow range, 0 to 2. We require the errors in to be less than 0.27 mag, meaning we need a source catalog with SNR (corresponding to mag). A similar argument is applied to the colors, which have a larger spread of . In this case, we require SNR ( mag). In summary, to obtain meaningful color distributions, we base our analyses below on the following three source samples: the original W1 sample (SNR), a W1/2 sample (SNR and SNR), and a W1/2/3 sample ().
Figure 2 shows the source fraction in each of the above three samples relative to the four-band merged, public released catalog. When applying additional photometric SNR cuts, the source sample sizes become increasingly smaller. At SNR 5, 4.6 m sources are only 57% of the W1 sample. At SNR 3, this fraction is only 15% and 2% at 12 m and 22 m, respectively. In the sense of source surface density, the W1 sample has 8230 sources per deg2, whereas the W1/2 and W1/2/3 samples have only 4700 and 1235 sources per deg2, respectively. For comparison, the source surface density in the SDSS photometric catalog is about 27,300 sources per deg2, over three times higher than that of \wise 3.4 m. This is because SDSS detects many more low-luminosity (low-mass) galaxies than \wise (see, e.g., Donoso et al. 2012).
For the three samples specifically selected for this paper, SNRW1 = 7 corresponds to apparent magnitudes between 16.8 and 17.6 mag (0.058 - 0.028 mJy), SNRW2 = 5 to 15.9 mag to 16.5 mag (0.075 - 0.043 mJy), and SNRW3 = 3 to the limiting magnitudes of 12.2 to 12.8 mag (0.38 - 0.22 mJy).
photometry is calibrated relative to measurements of standard stars, using the Vega magnitude system. The conversion factors to the AB system () are 2.683 (), 3.319 (), 5.242 () and 6.604 (); equivalently, zero magnitude corresponds to 309.5, 171.79, 31.676 and 8.36 Jy for the four bands, respectively (Wright et al. 2010) and (Jarrett et al. 2011). SDSS photometry directly output from the SDSS archive is in the asinh magnitude system. We translate asinh magnitudes into the AB system using information provided by SDSS333See http://www.sdss.org/DR7/algorithms/fluxcal.html.. When calculating SDSS\wise colors, we convert SDSS photometry to the Vega system using (Fukugita, Shimasaku & Ichikawa 1995). Throughout this paper, \wise magnitudes are in the Vega system, SDSS magnitudes are in the AB system, but all colors are in the Vega system.
2.3 SDSS data
This paper uses the SDSS DR7 data (Abazajian et al. 2009), including the photometric catalog, the main galaxy spectroscopic catalog444See http://www.mpa-garching.mpg.de/SDSS/DR7/. (Brinchmann et al. 2004), the luminous red galaxy (LRG) spectroscopic sample (Eisenstein et al. 2001) and the QSO sample (Schneider et al. 2010). The DR7 legacy survey catalog covers 8423 deg2 and contains 230 million sources. The main galaxy spectroscopic catalog is generated jointly by the Max-Planck-Institut fur Astrophysik and the Johns Hopkins University (MPA-JHU DR7 main galaxy catalog; Brinchmann et al. 2004). It consists of almost galaxies with Petrosian (1976) magnitudes brighter than for which various derived physical parameters are readily available. We adopt the following classification criteria as in Kauffman et al. (2003): star-forming (SF) galaxies are defined as having 1.3 + 0.61 (Eq. 1 in Kauffmann et al. 2003); AGNs (Seyfert and LINERs) are defined as having (Eq. 5 in Kewley et al. 2001); and composite systems are defined as having between the two values described by the above equations. These SF galaxy and AGN definitions are used in § 3.2 when we utilize SDSS spectra to classify \wise sources. When based on \wise data alone, we do not use these definitions. Two LRG samples are selected in color-magnitude space, one to (roughly volume-limited, to ) and one to (flux-limited, to ) (Eisenstein et al. 2001). The QSO sample is selected by their non-stellar colors or FIRST (Becker et al. 1995) radio emission to for and to for (Richards et al. 2002).
In addition, all SDSS photometric redshifts (when spectroscopic redshifts are not available) used in sections below are the ones derived based on the neural network method (Oyaizu et al. 2008). We caution that, in general, broad band photometric redshifts are highly uncertain for strong type-1 AGNs/QSOs (Assef et al. 2010; Brodwin et al. 2006). These strong type-1 AGNs from SDSS have the most complete spectroscopic redshifts.
3 Analysis and Results
3.1 Apparent magnitude and redshift distributions
The \wise 3.4 and 4.6 m bands primarily sample emission from stellar photospheres, whereas the 12 and 22 m bands are more sensitive to dust emission heated by stars and accreting black holes. Therefore, \wise readily identifies a variety of galaxy populations in the mid-infrared sky. To characterize these populations, we first address several basic properties of the matched \wise-SDSS catalog, including optical brightness distributions, redshifts, the fraction of \wise sources undetected or with very faint optical counterparts, and optical thru mid-infrared colors of matched sources.
We carried out source matching between \wise and SDSS DR7 with a matching radius of 3″. This is based on the fact that the \wise angular resolutions are 61, 64, 65, and 12″ for the four bands, respectively. Figure 3 shows the percentage of \wise sources with SDSS -band optical counterparts for the four \wise bands. To a depth of , corresponding to the 50% completeness depth of SDSS (Abazajian et al. 2004), 91% of the W1/2/3 and 96% of the W1/2/3/4 (SNR) samples have optical counterparts. In contrast, only 72% and 86% of the W1 and the W1/2 samples have optical counterparts with . This implies that the bulk of 12 and 22 m galaxies are dusty star-forming galaxies and AGNs at low redshifts (), whereas 15 - 25% of 3.4 and 4.6 m sources could be massive early-type galaxies which are fainter than the SDSS photometric limits and are at 1. Indeed, Gettings et al. (2012) reports on a \wise-selected galaxy cluster at which is well-detected in and but is undetected by SDSS.
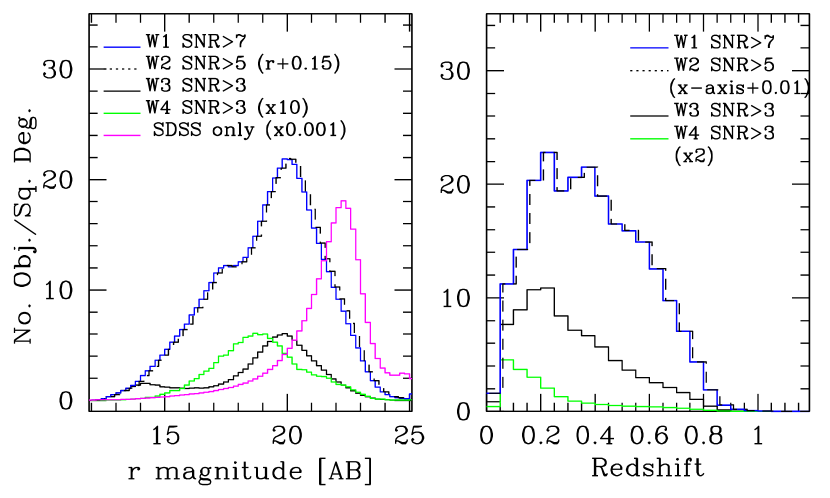
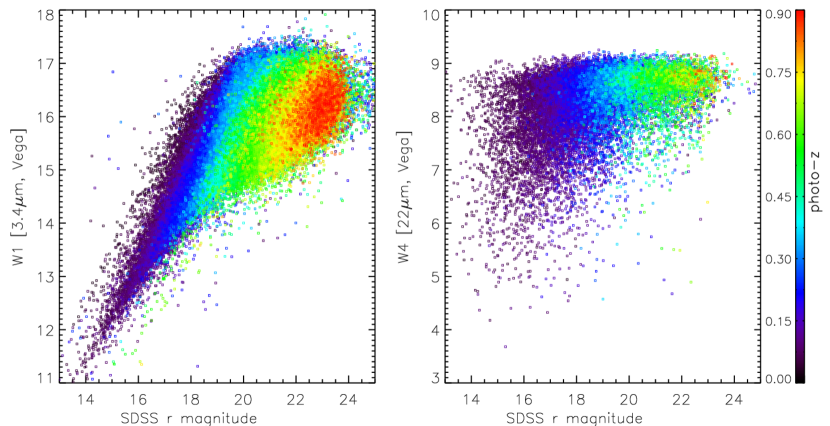
Figure 4 shows the optical brightness and photometric redshift distributions for the mid-infrared sources detected in the four bands. It is clear that \wise 22 m sources have corresponding optical magnitudes which peak at 19, one magnitude brighter than the peaks for the W1, W2 and W3 samples. For comparison, the parent SDSS photometric catalog continues to rise until completeness causes an apparent drop at . This confirms that SDSS detects many more low-mass, low-luminosity galaxies than \wise and the bulk of \wise galaxies with optical counterparts are relatively local, at .
About 28% and 14% of \wise 3.4 m and 4.6 m sources are very faint or without any optical counterparts in the SDSS photometric catalog. These optically faint 3.4 m galaxies are predominantly massive early-type galaxies at , though heavily obscured galaxies and AGN also contribute at some level. Figure 5 examines the colors of this optically faint population, showing that sources with very faint -band magnitudes () have redder colors than optically brighter sources. As discussed below and shown with color-redshift tracks for galaxy templates from Assef et al. (2010), redder color is an indicator of early-type and star-forming galaxies being at higher redshifts, .


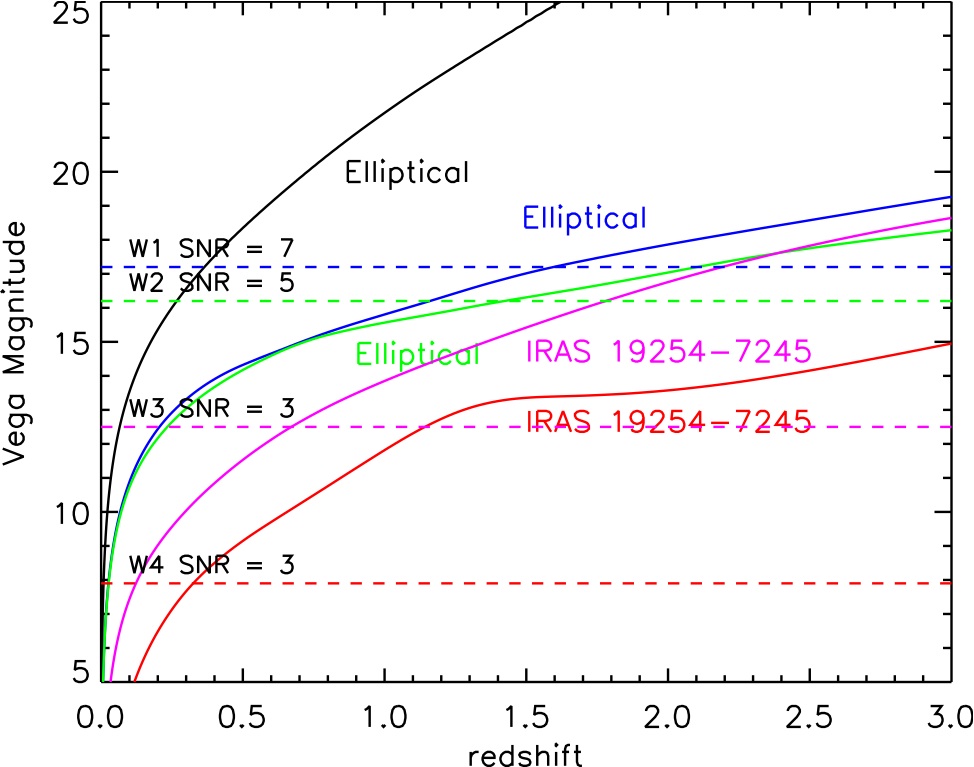
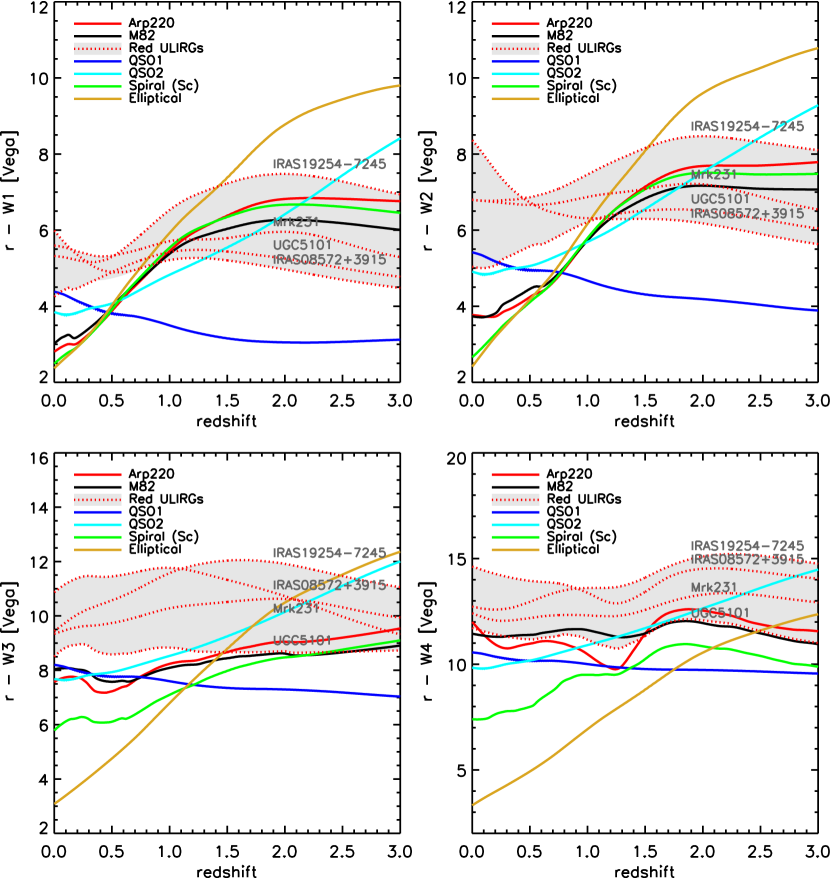
What types of galaxies are detected by \wise at 3.4 and 22 microns? One way to answer this is to calculate expected \wise magnitudes as a function of redshift using empirical galaxy templates. Figure 6 shows the expected and magnitudes for an early-type galaxy template, as well as and magnitudes for an infrared-bright galaxy (IRAS 192547245) as a function of redshift. This figure suggests that ignoring evolution, L∗ early-type galaxies should be visible in \wise 3.4 m data out to redshifts of 1.5 - 2. Another important result emphasized by Figure 6 is that the observed magnitudes do not change significantly over for early-type galaxies; this benevolent -correction has been noted repeatedly for the similar 3.6 m band of Spitzer (e.g., Eisenhardt et al. 2008; Mancone et al. 2010; Galametz et al. 2012). In contrast, optical -band magnitudes steeply decline in brightness with redshift.
Figure 7 illustrates how and magnitudes change with optical brightness, , and photometric redshift. traces until , at which point magnitudes remain within a narrow range of 15.8 - 16.8 mag, while optical brightness becomes increasingly fainter, stretching over three magnitudes. Figure 6 and Figure 7 illustrate the same effect, i.e., most galaxy SEDs have very steep slopes at ultraviolet through optical wavelengths, and much shallower slopes in the near-infrared. The turn-over at in Figure 7 implies that the bulk of sources are low-redshift (), typical SDSS-detected galaxies, and sources with tend to be at higher redshifts ().
3.2 Separating powerful AGN/QSOs at from galaxies
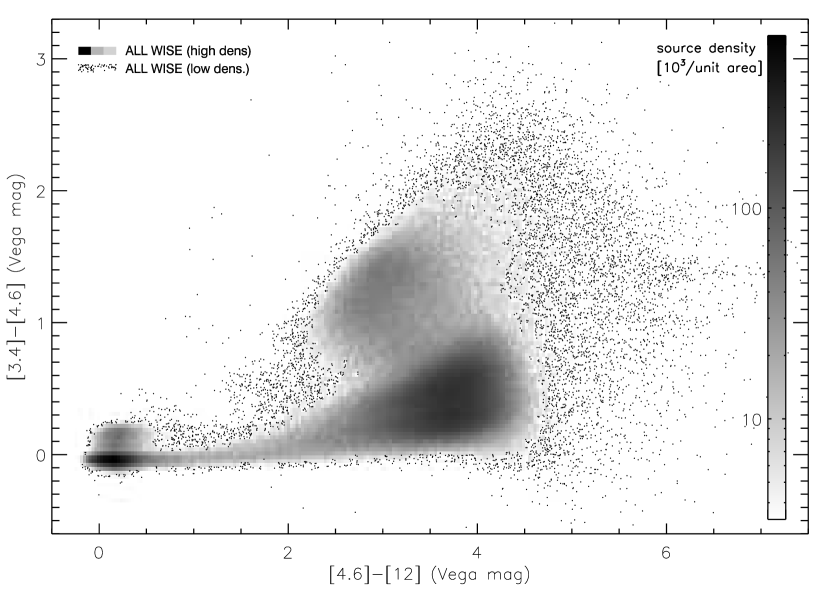
With four-band mid-infrared photometry, can \wise colors alone provide diagnostics for different types of sources as well as crude redshift information? Figure 8 addresses this question by showing vs. colors for the W1/2/3 sample. The three high source density regions are: (1) the stellar locus with both colors near zero; at mid-infrared wavelengths, emission from Galactic stars from spectral class O through T3 is dominated by the Rayleigh-Jeans tail of the blackbody spectrum, thereby yielding Vega-system colors near zero for most Galactic stars (note that pure elliptical galaxies with no dust at also sit near the stellar locus); (2) the red cloud with ; and (3) the bluer sequence, spanning a wide range in color. Here we do not see any extremely cool brown dwarfs with very red color due to methane absorption since such sources are very faint in , and thus are excluded in our W1/2/3 sample (Kirkpatrick et al. 2011).
What is the physical basis of the color-color distribution shown in Figure 8? Figure 9 through 11 examine this question from different angles. Figure 9 shows empirical galaxy and AGN templates from m based on objects with multi-wavelength data in NOAO Deep Wide-Field Survey (Assef et al. 2010). For systems with strong nuclear heating, the mid-infrared SEDs tend to be roughly a rising power-law, resulting in . For systems with dominant stellar emission at , this color is smaller because the 3.4 m band is sampling below the 1.6 m H- opacity peak of the stellar emission, making the color bluer; at , the 3.4 m band samples below the near-infrared stellar peak, getting fainter, thereby providing redder colors.
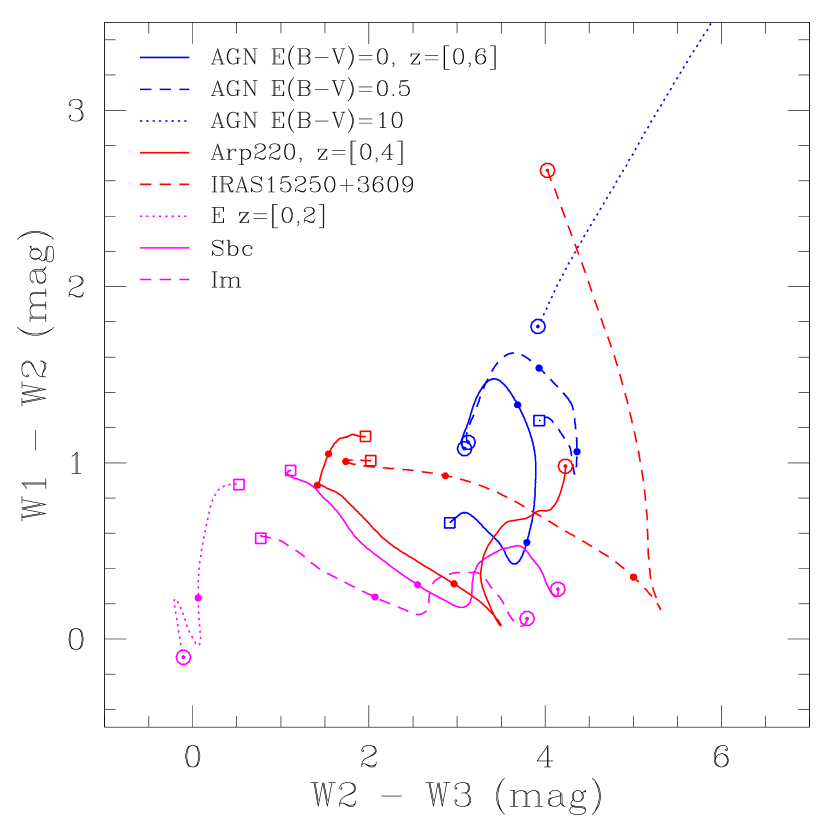
Figure 10 shows the and color tracks as a function of redshift calculated using the set of SED templates of Assef et al. (2010), the Arp 220 SED template of Polletta et al. (2007) and the IRAS15250+3609 template of Vega et al. (2008). The model colors clearly do not span the full range of observed values in Figure 8. The assumed SED templates, generated from optical and Spitzer observations, are by no means complete. These templates include elliptical galaxies, star forming Sbc and Im type galaxies, type-1 AGNs and local ULIRGs Arp 220 and IRAS15250+3609. The AGN tracks have three different dust obscuration factors; dust-obscured ones are type-2 AGNs.
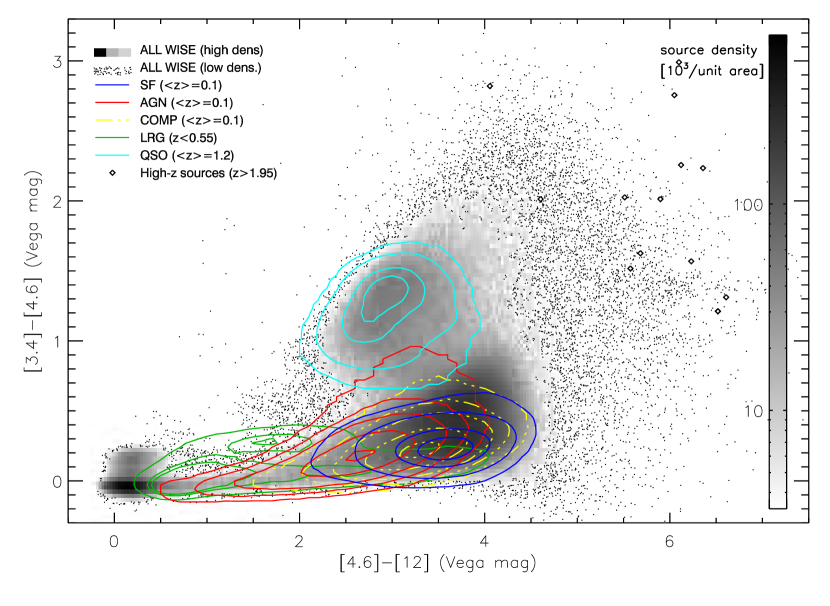
As opposed to Figure 10 which shows \wise colors based on SED templates, Figure 11 is the color-color plot for known sources. Specifically, we plot SDSS spectroscopically classified sources, including star-forming (SF) galaxies, galaxies hosting AGN, SF/AGN composite systems, LRGs, QSOs and \wise-selected ULIRGs. These figures enable us to conclude that \wise colors alone are effective in separating strong AGNs from star-forming galaxies, and in separating stars from extragalactic sources (other than early-type galaxies at very low-redshift).
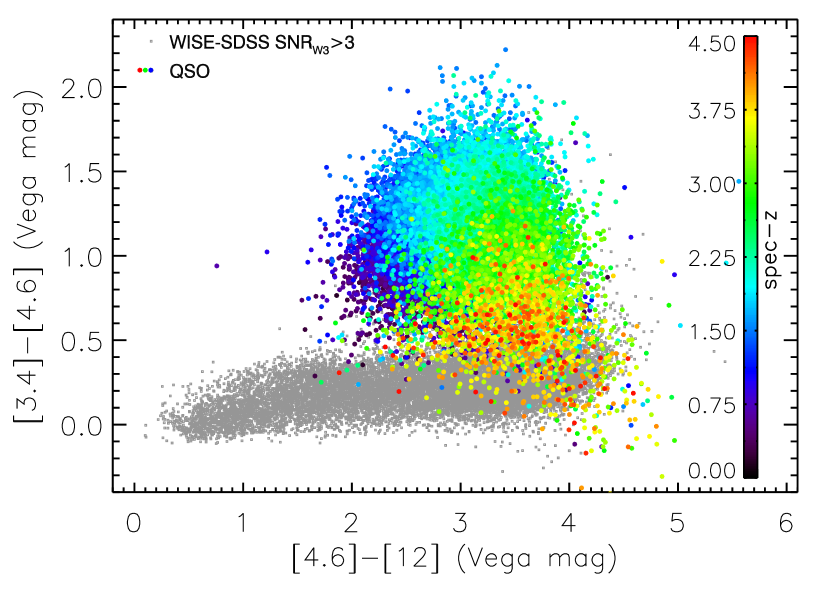
Figures 8 through 11 all suggest one unique application of \wise data over the entire sky — selecting strong AGN/QSO candidates at using color. Using mid-IR colors to select AGNs has been noted earlier in Spitzer studies over relatively small areas and with much smaller AGN samples (e.g., Lacy et al. 2004; Stern et al. 2005). The selection of method, briefly discussed in Jarrett et al. (2011), is tested and discussed in detail in Stern et al. (2012) and Assef et al. (2012) (see also Ashby et al. 2009; Assef et al. 2010; Eckart et al. 2010; Edelson & Malkan 2012; Massaro et al. 2012; Wu et al. 2012; Mateos et al. 2012). With the current analysis, we, for the first time, investigate this simple selection criterion using the wide-area, large spectroscopic database of SDSS. vs. is plotted in Figure 12 for SDSS spectroscopically confirmed QSOs, color-coded by redshift. Normal, star-forming galaxies are also plotted. We see that QSOs at mostly have , and are reasonably well separated from star-forming galaxies. However, QSOs have bluer colors due to the 3.4 and 4.6 m filters sampling rest-frame optical wavelengths, making such quasars difficult to distinguish from normal galaxies based on mid-IR colors alone. A similar issue with Spitzer selection of distant quasars was pointed out by Assef et al. (2010). The selected AGN candidate sample has two unique features: (1) it provides a more complete selection of QSOs, particularly at , where the SDSS optical color method has issues (Richards et al. 2002; Schneider et al. 2010); and (2) it is less affected by dust than optical selection methods, and thus is more sensitive to obscured, type-2 AGNs.
In addition to the color criterion of , another important condition for selecting AGN with high completeness and reliability is magnitude and SNR limits (see Stern et al. (2012) and Assef et al. (2012) for the full details). Using the deep, multi-wavelength data in Cosmic Evolution Survey (COSMOS; Scoville et al. 2007), Stern et al. (2012) found that in combination with at identifies 78% of Spitzer mid-IR AGN candidates (as the truth sample) with a reliability of 95%. Assef et al. (2012) uses higher latitude \wise data in the wider-area Boötes field to further investigate the completeness and reliability of the \wise AGN selection as functions of magnitude and SNR. As shown in Figure 10 and discussed in § 3.1, optically faint, high-redshift elliptical and Sbc galaxies tend to have very red colors. These sources are contaminants to \wise AGNs based on a pure color cut. To limit the contamination, Stern et al. (in prep) and Assef et al. (2012) found that at the number of sky coverage can achieve completeness of 74% and reliability of 89%. Here similar to Stern et al. (2012), the reliability and completeness of \wise AGN sample is derived based on using the Spitzer color selected mid-IR AGNs as the truth sample. For our chosen \wise + SDSS overlap sub-region, more than 80% of the sky have the coverage , and 99% have the coverage . At , the median source SNR and the number sky coverage are 12 and 22 respectively. Therefore, for our analysis of \wise AGNs throughout this paper, we adopt criterion. Our AGN selection criteria of , should maintain a reasonable completeness and a good reliability.
What is the source density of \wise-selected sources? In the large, high Galactic latitude \wise-SDSS overlap area we analyze here, the W1/2/3 sample contains 12% Galactic stars, 12% luminous AGN candidates, and 70% normal galaxies (possibly containing weak AGNs). The remaining 6% of sources are extremely red, with either or . These present a rare population of red objects, and are likely dusty systems at high redshift (see § 3.4). With the selection of , , the \wise AGN/QSO candidates have a surface density of per deg2. Considering only the optically bright subsample, with , the AGN candidate surface density is 35 per deg2. For comparison, Stern et al. (2012) finds 61.95.4 per deg-2 AGN candidates with 95% reliability for , and Assef et al. (in prep) finds 1374 per deg-2 candidates for .

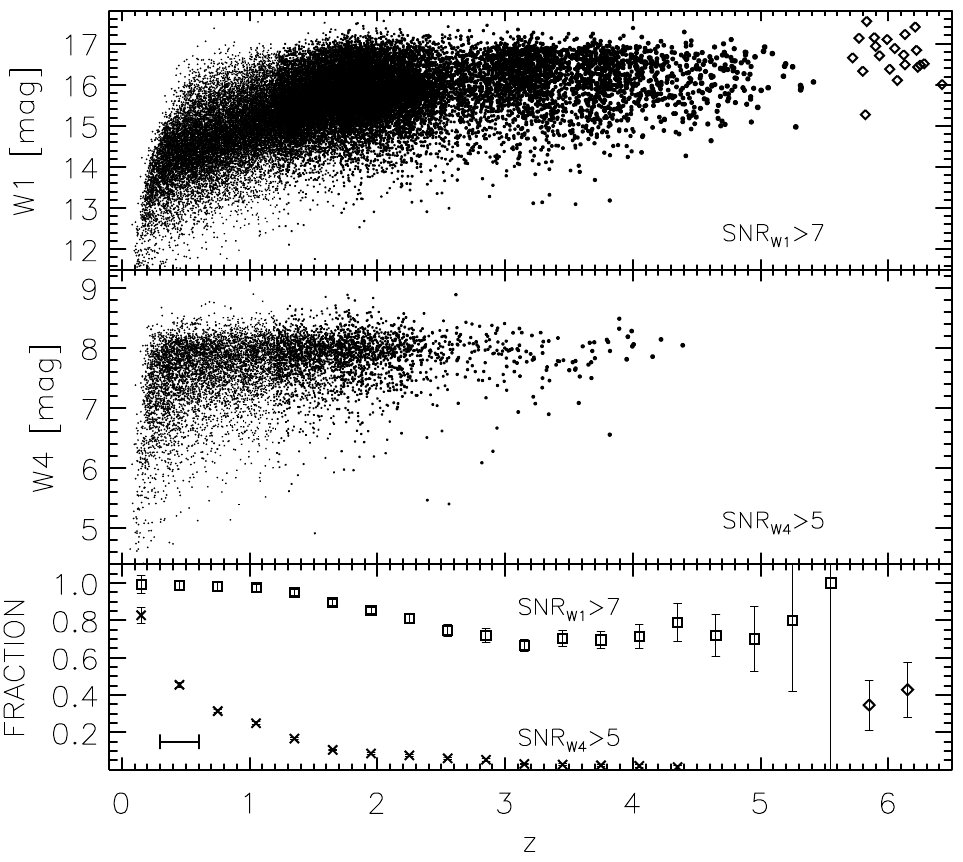
SDSS spectroscopic QSOs are optically bright sources. What is the fraction of this population detected by \wise 3.4 and 22 m? Figure 13 addresses this question. Overall, \wise detects a high fraction of SDSS QSOs from DR7 Schneider et al. (2010) catalog, and QSOs from Fan et al. (2006); Jiang et al. (2009), Willott et al. (2009) and Willott et al. (2010). Of the entire QSO sample, only % have detections at SNR, and much higher fraction, % have detections at SNR. We note that \wise is quite sensitive in detecting QSOs, with a detection rate of 50%, as shown in the bottom panel of Figure 13. In particular, the highest redshift quasar currently known, ULAS J1120+0461 at (Mortlock et al. 2011), is also detected by \wise 3.4 m. Blain et al. (2012) presents a detailed discussion of the \wise properties of optically selected QSOs.
3.3 Type-2 AGN candidates
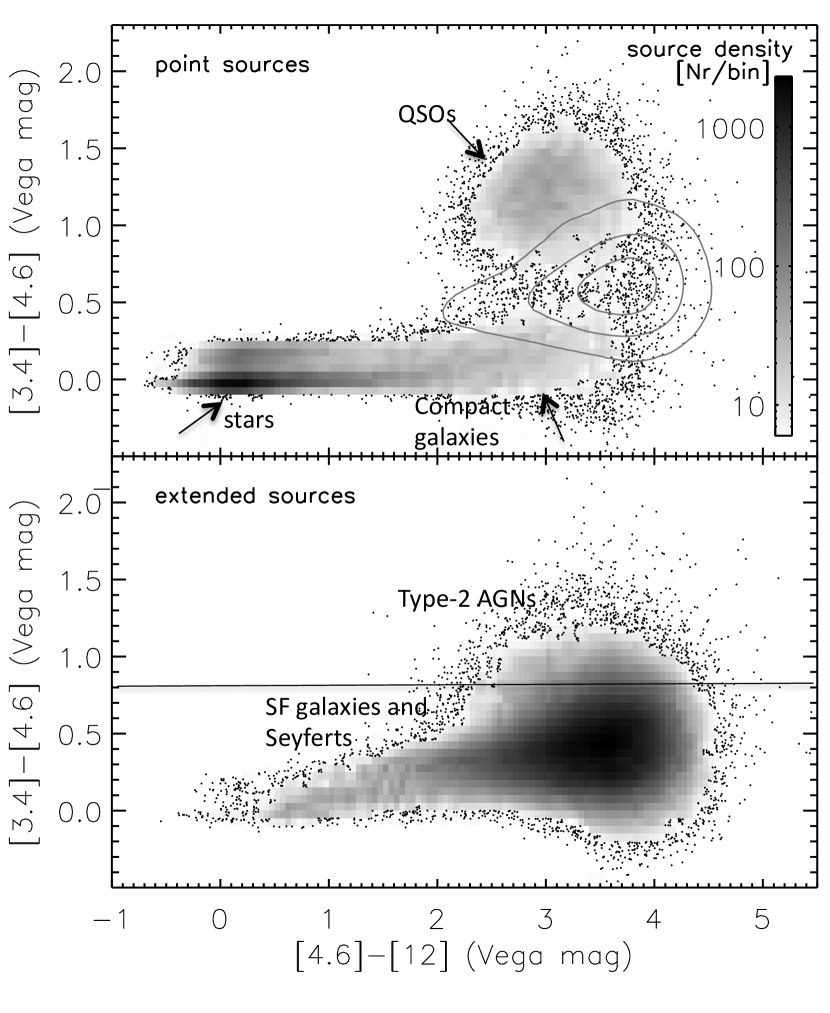
is very sensitive to dust-obscured objects. This naturally leads to two questions: (1) can \wise colors be used to identify type-2 AGNs; and (2) what is the relative fraction of type-1 and type-2 QSO/AGNs selected by \wise? One simple way to understand the \wise colors of extragalactic sources is to compare mid-IR colors of SDSS unresolved, point sources (including QSOs, stars and compact galaxies) with that of extended galaxies (including type-2 AGNs and normal galaxies). Figure 14 illustrates this comparison, showing clear separation between strong QSOs and star forming galaxies. Here we take the SDSS photometric catalog, and separate sources by their morphological types — unresolved point sources versus extended galaxies. This list is then matched with the \wise catalog. We do not apply any \wise magnitude cut since our purpose is to show the difference in mid-IR color distributions of SDSS extended versus pointed sources. To ensure reliable star/galaxy classification, we require (e.g., 95% reliability quoted in Table 2 in Stoughton et al. 2002). \wise colors of unresolved sources (e.g., Galactic stars and quasars) are clearly separated from extended galaxies. Furthermore, in terms of unresolved SDSS sources, note that the Galactic stars (at the origin) are clearly distinct from the unresolved quasars (with redder mid-infrared colors).
One cautionary note about type-2 AGN is that any discussion and conclusions will depend how such sources are defined. In the current analysis, we define two type-2 AGN samples. The first sample is the AGN candidates with , , and with extended SDSS -band morphologies (SDSS TYPE = 3; ). In general, AGNs have two components, extended galaxy and central accreting black holes. For strong AGNs, the central black hole emission dominates over the extended component in type-1 AGNs, but not in type-2. Here we adopt the morphology criterion for our selection. Unfortunately, this definition only works for optically bright AGN candidates with spatially resolved host galaxies in the SDSS data. It is also worth noting that mid-IR color criteria for AGNs tend to select systems with strong black hole accretions. For fainter type-2 AGN candidates, we use an alternative definition: , and very red optical-to-mid-infrared color — i.e., optically faint, \wise 4.6 m AGN candidates. As emphasized earlier, when selecting \wise AGNs using colors, the criterion is very important for limiting contamination from high-redshift galaxies to less than 20% (Assef et al. 2012).
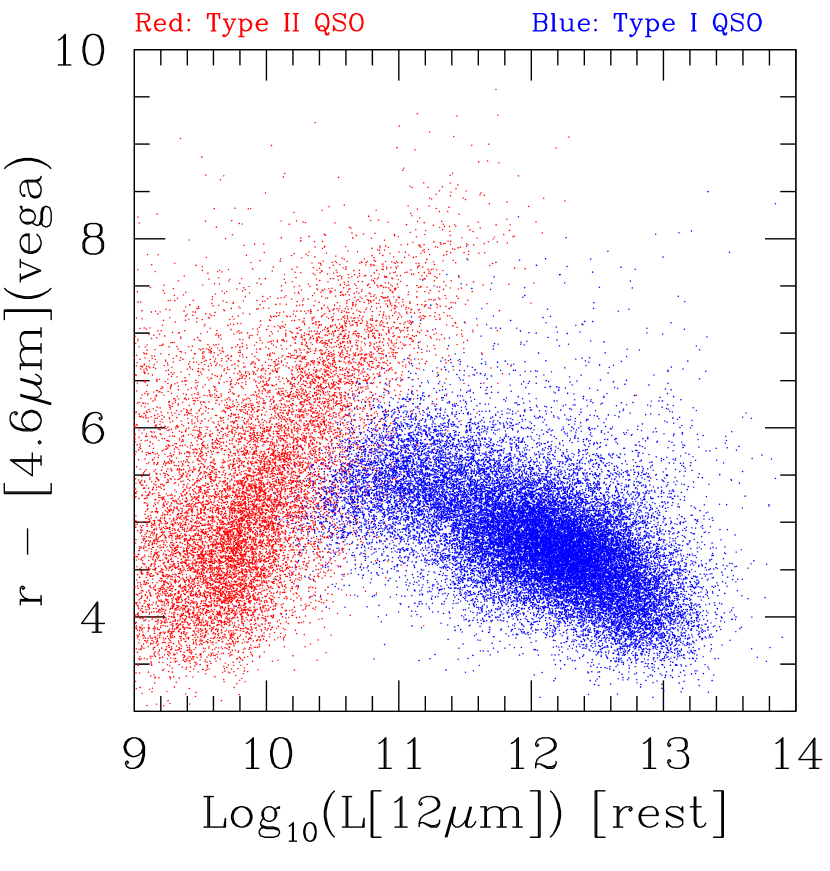
For the former, optically bright type-2 AGN definition, we estimate of \wise-selected AGN/QSOs to be spatially resolved. This suggests an almost 2:1 type-1 to type-2 AGN ratio. Since type-2 AGN here only include bright AGNs with well-resolved host galaxies in optical images, it is not surprising that the type-2 to type-1 ratio is so low – e.g., lower than what is required to explain the hard X-ray background (Gilli et al. 2007; Comastri et al. 2011). With SDSS + \wise data, it is also possible to use color to select type-2 AGNs. Figure 15 examines this technique, showing colors for both type-1 and optically bright type-2 AGNs with extended SDSS morphologies. The morphological criterion imposes a strong selection function, producing an artificial deficit of luminous type-2 AGN in Figure 15. Higher luminosity sources will tend to be at higher redshifts and high-redshift obscured AGNs drop below the limit imposed to provide reliable morphologies. Here is calculated using spectroscopic or photometric redshifts, including small -corrections (less than 0.1 magnitude) based on the appropriate type-1 or type-2 AGN template from Assef et al. (2010). Type-1 and type-2 AGNs clearly have very different color distributions, especially at the high luminosity end. This is consistent with what has been found by Hickox et al. (2011) based on X-ray and Spitzer data in the Boötes field. This result lends support for using to select type-2 AGNs which do not have reliable optical morphology information.
Furthermore, the feasibility of this method is illustrated in Figure 16, showing the calculated optical/mid-IR colors based on assumed sets of SED templates as a function of redshift. These galaxy templates are constrained by actual Spitzer observations (Polletta et al. 2007; Vega et al. 2008). We see a strong divergence in optical/mid-IR colors of type-1 and type-2 QSO/AGNs at . Figure 17 further examines this technique, showing vs. for \wise sources with , matched with SDSS -band data down to the faintest limits. The secondary branch in the figure shows that sources with red colors are potential type-2 AGNs. If we use the criteria of , , and to define a sample of red AGN as potential type-2 sources, we find that type-2 candidates account for of all \wise-selected AGN candidates to that depth. The surface density of such a type-2 AGN candidates is about 16.4 per deg2, whereas bright with resolved morphology, type-2 AGN is about 31% of all AGNs, yielding surface density of 17.3 per deg2. Stern et al. (2012), using the Hubble Space Telescope imaging available in the COSMOS field, find that of \wise-selected AGN candidates to a depth of are unresolved in .
Our intention here is to illustrate the methods of using colors to select large samples of type-2 AGN candidates over wide areas of sky. Our crude estimate of the type-2 AGN fraction (integrated) is on the order of 1/3rd of all AGNs. However, we caution that to truly understand the implications of these numbers, we will need to have the redshift and luminosity information. Such studies utilizing \wise plus other ancillary spectroscopic data in smaller regions of sky are included in Assef et al. (2012) and Stern et al. (in prep).
3.4 High-redshift ULIRG candidates
One of the primary \wise mission goals is to identify extremely luminous () dusty starbursts and AGNs (i.e., ULIRGs and hyper-luminous infrared galaxies, or HyLIRGs) at high redshift. We have pursued two basic approaches in finding high-redshift ULIRGs. One is to use \wise data alone, and the second is to combine \wise with optical data.
Using \wise colors alone, high-redshift ULIRGs can be identified by requiring very red, rising mid-infrared SEDs, redder than the spectral index corresponding to the \wise sensitivity limits (see § 2.2). Specifically, this means significant detections (SNR 3 - 5) in or , but no detections in and , i.e., so-called -dropouts (Eisenhardt et al. 2012). Follow-up optical spectroscopy of more than 100 candidates using the Keck, Gemini, Magellan, and Palomar telescopes have demonstrated that the majority of these candidates are indeed at redshifts of 1 - 3, implying very high luminosities given the high fluxes at 12 and 22 m (Eisenhardt et al. 2012; Wu et al. 2012). This type of ULIRG is rare, with a surface density of just 0.02 sources per deg2. One interesting feature of these ULIRGs is their extremely steep mid-IR spectral slopes. Comparing Figure 10 and 11, we see that the newly discovered \wise-selected 2 ULIRGs have much redder colors than the calculated high- colors using local ULIRG SED templates, including the reddest one such as IRAS15250+3609. Eisenhardt et al. (2012), Wu et al. (2012), Bridge et al. (2012) and Yan et al. (2012) present complete discussions on the -drop selection, follow-up spectroscopy, as well as far-infrared photometry from CSO and Herschel for some of these extremely luminous () ULIRGs at .
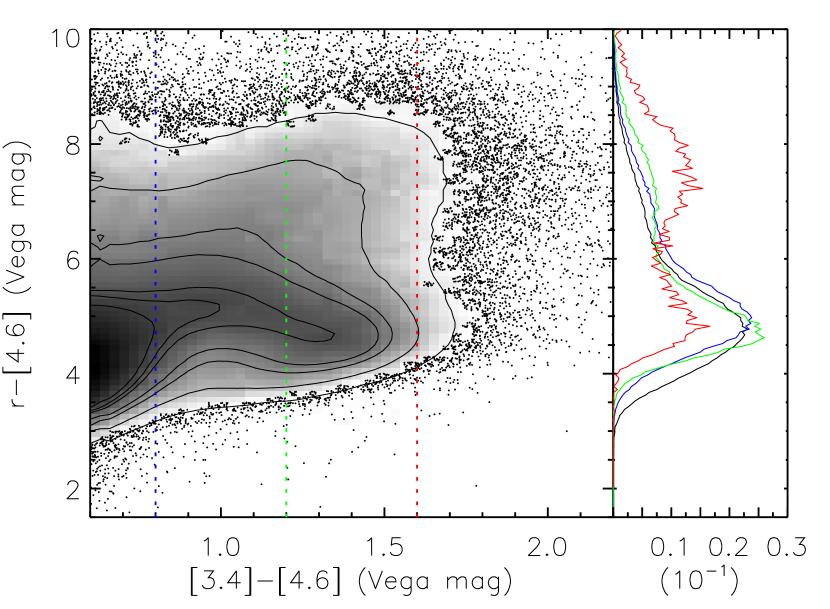
The second method is to utilize optical/mid-infrared colors. As shown in Figure 16, color becomes redder at higher redshift. This is true as well for the other three \wise bands. Indeed, there is a rich literature using red optical-to-mid-infrared colors with Spitzer to select high-redshift galaxies. For example, red 24 m to -band colors (; Vega) have been used in the Extragalactic First Look Survey (XFLS; (Yan et al. 2004)) and Boötes field to successfully select many highly obscured galaxies at (Yan et al. 2005, 2007; Dey et al. 2008). As shown in Figure 16, highly dust-reddened local ULIRGs, such as IRAS 19254-7245, Mrk 231, UGC5101 and IRAS 08572+3915 have very red colors at any redshifts. Using as the selection criterion, \wise identifies high-redshift ULIRG candidates per deg2 for SNR. This signal-to-noise ratio cut roughly corresponds to a 22 m flux density mJy. This is shown in Figure 18. If we instead apply a uniform flux density cut of mJy, the surface density of ULIRG candidates is per deg2, comparable to that of Dey et al. (2008) using Spitzer data over the 10 deg-2 Boötes field with the flux density cut of mJy. To verify our analysis, we chose a subset of the SDSS-WISE overlap region covering 180 sq. degrees. All of the red, high-redshift candidates with were visually examined. We found a small percentage of contaminants (8%). Our derived surface density values have been corrected for this percentage. The \wise all-sky data offers an excellent opportunity to assemble a large sample of 22 m-selected “dust-obscured galaxies”, or DOGs, at .


3.5 Keck spectroscopy of a sample of high-redshift ULIRG candidates with very red color
The \wise team has carried out optical spectroscopic follow-up observations of high-redshift ULIRG candidates. These candidates include both -dropouts as well as extremely red optical/mid-IR sources. Eisenhardt et al. (2012) focused on one particular -dropout, J181417.29+341224.9 at , whose optical spectrum shows a typical star-forming galaxy whereas its IR SED suggests a highly obscured AGN with a bolometric luminosity of . Wu et al. (2012) presents optical spectra of a sub-set of -dropouts with millimeter observations, making a comparison between -dropouts and Spitzer-discovered dust obscured galaxies (“DOGs”).
The follow-up observations included a sample of \wise sources with . Table 1 lists the source information for eight galaxies with good spectra. These spectra were taken using Low Resolution Imager and Spectrograph (LRIS,(Oke et al. 1995)) on the Keck telescope during the nights of March 10, April 10, and May 10, 2011. The total on-target integration times range from 10 to 15 minutes. Figure 19 shows the wavelength calibrated spectra in the observed frame for these 8 sources. Prominent emission lines include Ly, C IV 1549, [Mg II] 2800, Ne V 3426, [O II] 3727, and [O III] 5007 etc, strong spectral features. W1422+5613 has a C IV 1549 FWHM of 1480 km/s, not accounting for the spectral resolution. If we adopt 2000 km/s for type-1 and type-2 separation based on C IV 1549, this object is indeed a type-2 AGN. This cutoff value is very conservative comparing to the mean C IV 1549 velocity width of 5600 km/s, estimated the SDSS QSO sample (Shen et al. 2008). Similarly, W1457+2932 is a type-1 AGN with a C IV 1549 FWHM of 3940 km/s. W1603+3627 has a C IV 1549 FWHM of 1790 km/s, however, its C III] 1909 FWHM is broad, 3170 km/s and the [Mg II] 2800 is broad as well. Since C IV 1549 line is a complex line and could have some absorption. We classify this object as type-1 based on C III] 1909 and [Mg II] 2800 instead. W1604+2041 is a type-2 AGN with a Ne V 3426 FWHM of 1350 km/s. W1617+3355 has a ratio of [O III] 5007 to H of 3.7, which is in a range that could be either AGN or star-forming based on the Baldwin, Phillips & Terlevich (BPT) diagram. Its [O III] 5007 FWHM is 610 km/s, making it consistent with either a type-2 AGN or a star-forming galaxies. W1617+2336 is a type-1 AGN with a C IV 1549 FWHM of 4800 km/s. W1636+3309 has a ratio of [O III] 5007 to H20, which implies an AGN, however, the available spectral line widths for a small number of features are narrow, suggesting it being a type-2. The classification for this source is not clear. W1708+3315 has [O III]/H, again making it ambiguous, either a type-2 AGN or a star-forming galaxy. Table 1 lists these classifications. Although the number of spectra is small and there are some ambiguous systems, the source types among the randomly selected 8 targets are dominated by type-2 AGNs. This supports the interpretation that the high mid-IR fluxes at 22 m are due to dust emission heated by obscured central AGNs.
We plot the colors and brightness of these 8 sources as a function of their spectroscopic redshifts in Figure 20. It suggests that optically fainter or redder candidates could be at higher redshifts. The brightness in the 22 m band does not appear to correlate with redshift, with many high-redshift ULIRGs being quite bright in W4.
4 Discussion and Summary
With the public data releases, \wise has delivered to the community the most sensitive all-sky mid-infrared map of our generation. In this paper, we present a phenomenological study that characterizes the observational properties of mid-infrared extragalactic sources and identifies color selection criteria for isolating large samples of QSOs, dust-obscured type-2 AGNs and luminous high-redshift ULIRG candidates.
With 5 sensitivities 0.05, 0.1, 0.75 and 6 mJy at 3.4, 4.6, 12 and 22 m, the W1, W1/2, W1/2/3 and W1/2/3/4 samples have source surface densities of 8230, 4700, 1235 and 150 per deg2, respectively. At the limit of the data, only very red mid-infrared sources with spectral slopes steeper than are simultaneously detected in both and . The source density is one-third that of the SDSS photometric catalog, suggesting that \wise 3.4 m does not detect many low-mass, low-luminosity, blue galaxies (Donoso et al. 2012). We find that 28% of the sample have -band magnitudes fainter than 22.6, including many sources lacking optical counterparts. We present observational evidence that suggests that optically faint 3.4 m sources are likely early-type galaxies beyond the redshift limit of the SDSS imaging data.
3.4 m data are sensitive to bright quasars. Of the entire SDSS optical QSO sample (Schneider et al. 2010), % have detections at SNR. \wise even detects 3.4 m emission from the highest, known redshift QSO, ULAS J1120+0461 at (Mortlock et al. 2011). In contrast, only % of all SDSS QSO sample have detections at SNR. Some of these optically selected bright QSOs detected at 22 m are not just bright in all bands, but indeed have strong mid-IR dust emission.
The unique advantage of \wise all-sky data for extragalactic sources is the diagnostic power of its mid-infrared colors. This power comes from the fact that pure stellar systems, star-forming galaxies and QSO/AGN have distinctly different near-infrared SEDs (see Figure 9), yielding very different observed mid-infrared colors for different types of objects. We show that \wise colors alone can separate source populations, including Galactic stars, star-forming galaxies and QSO/AGN. We present three useful applications of \wise all-sky data. (1) We select QSO/strong AGN at using color and . The magnitude cut is to limit the contamination from early galaxies at high redshift. This population of QSOs is interesting to inventory since a large fraction of QSOs at are missed by the SDSS optical color selection. Beyond , the \wise QSO color selection starts to fail as the 3.4 m and 4.6 m bands sample wavelengths blue-ward of 1Å, and the observed \wise colors start to have overlap with low-redshift star-forming galaxies. (2) We demonstrate the possibility for selecting type-2 AGN/QSO candidates using , and (or SDSS optically resolved morphologies for sources). The \wise data allow a more complete census of dust-obscured, actively accreting, supermassive black hole systems than allowed by the current generation of deep X-ray surveys. (3) High-redshift () dust-obscured, extremely luminous ULIRGs/HyLIRGs are another population of extragalactic objects which the \wise data can be used to identify. With follow-up optical spectroscopy, Eisenhardt et al. (2012) demonstrates the efficient selection of ULIRGs with extremely red mid-infrared slopes (the -drop-out method). In addition, we show that extremely red optical-to-mid-IR colors, e.g., using , can also be used to select high-redshift dust-obscured starbursts and AGN. The candidate surface density for this later selection is at SNR. This is consistent with the number inferred from the previous studies using Spitzer data over much smaller areas.
Optical spectroscopic follow-up of a small number of 14 ULIRG candidates confirms that the color selection indeed works, identifying IR luminous galaxies over a wide range of redshift, . Despite small number statistics, we find indications that optically fainter and redder sources tend to be at higher redshifts. The Keck optical spectra for the 8 sources detect many typical strong emission nebular lines seen among AGNs, such as Ly, C IV 1549, Ne V 3426, [O III] 5007 lines. In addition, of the 8 sources with the optical spectra, five have spectral types of type-2 AGN, one type-1 AGN with fairly broad C IV 1549 emission line, and two possible star-forming galaxies.
5 Acknowledgement
This publication makes use of data products from the Wide-field Infrared Survey Explorer, which is a joint project of the University of California, Los Angeles, and the Jet Propulsion Laboratory/California Institute of Technology, funded by the National Aeronautics and Space Administration. This paper also utilized the publicly available SDSS datasets. Funding for the SDSS and SDSS-II has been provided by the Alfred P. Sloan Foundation, the Participating Institutions, the National Science Foundation, the U.S. Department of Energy, the National Aeronautics and Space Administration, the Japanese Monbukagakusho, the Max Planck Society, and the Higher Education Funding Council for England. The SDSS Web Site is http://www.sdss.org/. The SDSS is managed by the Astrophysical Research Consortium for the Participating Institutions. The Participating Institutions are the American Museum of Natural History, Astrophysical Institute Potsdam, University of Basel, University of Cambridge, Case Western Reserve University, University of Chicago, Drexel University, Fermilab, the Institute for Advanced Study, the Japan Participation Group, Johns Hopkins University, the Joint Institute for Nuclear Astrophysics, the Kavli Institute for Particle Astrophysics and Cosmology, the Korean Scientist Group, the Chinese Academy of Sciences (LAMOST), Los Alamos National Laboratory, the Max-Planck-Institute for Astronomy (MPIA), the Max-Planck-Institute for Astrophysics (MPA), New Mexico State University, Ohio State University, University of Pittsburgh, University of Portsmouth, Princeton University, the United States Naval Observatory, and the University of Washington. Some of the data presented herein were obtained at the W.M. Keck Observatory, which is operated as a scientific partnership among the California Institute of Technology, the University of California and the National Aeronautics and Space Administration. The Observatory was made possible by the generous financial support of the W.M. Keck Foundation. The authors wish to recognize and acknowledge the very significant cultural role and reverence that the summit of Mauna Kea has always had within the indigenous Hawaiian community. We are most fortunate to have the opportunity to conduct observations from this mountain.
References
- Abazajian et al. (2009) Abazajian, K. N., et al. 2009, ApJS, 182, 543
- Abazajian et al. (2004) Abazajian, K. N., et al. 2004, ApJS, 182, 543
- Ashby et al. (2009) Ashby, M., Stern, D., Brodwin, M. et al. 2009, ApJ, 701, 428
- Assef et al. (2010) Assef, R. J., et al. 2010, ApJ, 713, 970
- Assef et al. (2012) Assef, R. J., et al. 2012,ApJ, in prep.
- Becker et al. (1995) Becker, R. H., White, R. L., & Helfand, D. J. 1995, ApJ, 450, 559
- Blain et al. (2012) Blain, A. et al. 2012, ApJ, in prep.
- Blanton et al. (2003) Blanton, M. et al. 2003, ApJ, 819, 838
- Bridge et al. (2012) Bridge, C. et al. 2012, ApJ, submitted.
- Brinchmann et al. (2004) Brinchmann, J., Charlot, S., White, S. D. M., Tremonti, C., Kauffmann, G., Heckman, T., & Brinkmann, J. 2004, MNRAS, 351, 1151
- Brodwin et al. (2006) Brodwin, M., Brown, M. J. I., Ashby, M. L. N., et al. 2006, ApJ, 651, 791
- Comastri et al. (2011) Comastri, A., Ranalli, P., Iwasawa, K., et al. 2011, A&A, 526, L9
- Cutri et al. (2011) Cutri, R. et al. 2011, “Explanatory Supplement to the \wise Preliminary Data Release Products”, http://wise2.ipac.caltech.edu/docs/release/prelim/expsup/
- Dey et al. (2008) Dey A. et al., 2008, ApJ, 677, 943
- Donoso et al. (2012) Donoso, E., Yan, L., Tsai, C.-W. et al. 2012, ApJ, 748, 80
- Eckart et al. (2010) Eckart, M., McGreer, I., Stern, D. et al. 2010, ApJ, 708, 584
- Edelson & Malkan (2012) Edelson, R., & Malkan, M. 2012, ApJ, 751, 52
- Eisenhardt et al. (2012) Eisenhardt, P. R. M., Wu, J., Tsai, C.-W., et al. 2012, ApJ, 755, 173
- Eisenhardt et al. (2008) Eisenhardt, P. R. M., Brodwin, M., Gonzalez, A. H., et al. 2008, ApJ, 684, 905
- Eisenstein et al. (2001) Eisenstein D. J. et al., 2001, AJ, 122, 2267
- Fan et al. (2006) Fan, X., Strauss, M. A., Becker, R. H., et al. 2006, AJ, 132, 117
- Fukugita, Shimasaku & Ichikawa (1995) Fukugita, M., Shimasaku, K., & Ichikawa, T. 1995, PASP, 107, 945
- Galametz et al. (2012) Galametz, A., Stern, D., De Breuck, C. et al. 2012, 749, 169
- Gettings et al. (2012) Gettings, D. , et al. 2012, submitted
- Gilli et al. (2007) Gilli, R., Comastri, A., & Hasinger, G. 2007, A&A, 463, 79
- Griffith et al. (2011) Griffith, R., Tsai, C.-W., Stern, D., et al. 2011, ApJ, 736, L22
- Hickox et al. (2011) Hickox, R. et al. 2011, ApJ, 731, 117
- Jarrett et al. (2011) Jarrett, T., Cohen, M., Masci, F., et al. 2011, ApJ, 735, 112
- Jarrett et al. (2012) Jarrett, T. et al. 2012, AJ, submitted
- Jiang et al. (2009) Jiang, L., Fan, X., Bian, F., et al. 2009, AJ, 138, 305
- Jiang et al. (2010) Jiang, L., Fan, X., Brandt, W. N., et al. 2010, Nature, 464, 380
- Kauffmann et al. (2003) Kauffmann, G., et al. 2003, MNRAS, 346, 1055
- Kewley et al. (2001) Kewley, L. J., Dopita, M. A., Sutherland, R. S., Heisler, C. A., & Trevena, J. 2001, ApJ, 556, 121
- Kirkpatrick et al. (2011) Kirkpatrick, J. D., Cushing, M. C., Gelino, C. R., et al. 2011, ApJS, 197, 19
- Lin et al. (2004) Lin, Y.-T., Mohr, J. J., & Stanford, S. A. 2004, ApJ, 610, 745
- Lacy et al. (2004) Lacy, M., et al. 2004, ApJS, 154, 166
- Lake et al. (2012) Lake, S., et al. 2012, AJ, 143, 7
- Mancone et al. (2010) Mancone, C., Gonzalez, A., Brodwin, M., et al. 2010, ApJ, 720, 284
- Massaro et al. (2012) Massaro, F., D’Abrusco, R., Tosti, G., et al. 2012, ApJ, 750, 138
- Mateos et al. (2012) Mateos, S. et al. 2012, arXiv1208.2530
- Neugebauer et al. (1984) Neugebauer, G., et al. 1984, ApJ, 278, L1
- Mortlock et al. (2011) Mortlock, D. J., Warren, S. J., Venemans, B. P., et al. 2011, Nature, 474, 616
- Richards et al. (2002) Richards, G.T. et al. 2002, AJ, 123, 1559
- Oke et al. (1995) Oke, J. B., Cohen, J. G., Carr, M., et al. 1995, PASP, 107, 375
- Oyaizu et al. (2008) Oyaizu, H., Lima, M., Cunha, C. E., et al. 2008, ApJ, 674, 768
- Petty et al. (2012) Petty, S. et al. 2012, AJ, submitted
- Petrosian (1976) Petrosian, V. 1976, ApJ, 209, L1
- Polletta et al. (2007) Polletta M. et al. 2007, ApJ, 663, 81
- Schneider et al. (2010) Schneider D. P. et al., 2010, AJ, 139, 2360
- Scoville et al. (2007) Scoville N. et al., 2007, ApJS, 172, 38
- Shen et al. (2008) Shen, Y., Greene, J. E., Strauss, M. A., Richards, G. T., & Schneider, D. P. 2008, ApJ, 680, 169
- Silva et al. (1998) Silva L. et al. 1998, ApJ, 509, 103
- Skrutskie et al. (2006) Skrutskie M. et al. 2006, AJ, 131, 1400
- Stern et al. (2005) Stern, D., et al. 2005, ApJ, 631, 163
- Stern et al. (2012) Stern, D., Assef, R. J., Benford, D. J., et al. 2012, ApJ, 753, 30
- Stoughton et al. (2002) Stoughton, D. et al. 2002, AJ, 123, 485
- Tsai et al. (2012a) Tsai, C. et al. 2012, ApJ, in prep.
- Tsai et al. (2012b) Tsai, C. et al. 2012, ApJ, in prep.
- Vega et al. (2008) Vega O. et al. 2008, A&A, 484, 631
- Willott et al. (2009) Willott, C. J., Delorme, P., Reylé, C., et al. 2009, AJ, 137, 3541
- Willott et al. (2010) Willott, C. J., Delorme, P., Reylé, C., et al. 2010, AJ, 139, 906
- Wright et al. (2010) Wright, E. L., et al. 2010, AJ, 140, 1868
- Wu et al. (2012) Wu, J., Tsai, C.-W., Sayers, J., et al. 2012, ApJ, 756, 96
- Wu et al. (2012) Wu, X.-B., Hao, G., Jia, Z., Zhang, Y., & Peng, N. 2012, AJ, 144, 49
- Yan et al. (2004) Yan, L., et al. 2004, ApJS, 154, 75
- Yan et al. (2005) Yan, L., et al. 2005, ApJ, 628, 604
- Yan et al. (2007) Yan, L., et al. 2007, ApJ, 658, 778
- Yan et al. (2012) Yan, L., et al. 2012, ApJ, in preparation
| Source | type | ||||||
|---|---|---|---|---|---|---|---|
| mag | mag | mag | mag | mag | |||
| J142228.88+561355.6 | 2.524 | 23.4 | 9.94 | 7.10 | 13.46 | 16.30 | type-2 AGN |
| J145705.91+293231.7 | 2.908 | 23.02 | 9.57 | 6.78 | 14.45 | 16.24 | type-1 AGN |
| J160346.21+362740.2 | 2.134 | 23.4 | 10.86 | 7.38 | 12.54 | 16.02 | type-1 AGN |
| J160456.27+204100.3 | 1.262 | 22.48 | 10.43 | 7.69 | 12.05 | 14.79 | type-2 AGN |
| J161714.90+335556.4 | 0.619 | 21.42 | 9.52 | 6.57 | 11.90 | 14.85 | type-2/star forming |
| J161728.91+233646.8 | 1.707 | 22.27 | 9.02 | 6.69 | 13.25 | 15.58 | type-1 AGN |
| J163619.18+330922.1 | 0.731 | 22.64 | 10.01 | 8.00 | 12.63 | 14.64 | type-2 AGN |
| J170813.71+331538.7 | 0.773 | 21.98 | 9.28 | 7.83 | 12.70 | 14.15 | type-2/star-forming |