Spectral Energy Distributions of Local Luminous and Ultraluminous Infrared Galaxies
Abstract
Luminous (LIRGs: log ) and ultraluminous infrared galaxies (ULIRGs: log ) are the most extreme star forming galaxies in the universe. The local (U)LIRGs provide a unique opportunity to study their multi-wavelength properties in detail for comparison to their more numerous counterparts at high redshifts. We present common large aperture photometry at radio through X-ray wavelengths, and spectral energy distributions (SEDs) for a sample of 53 nearby () LIRGs and 11 ULIRGs spanning log from the flux-limited (Jy) Great Observatories All-sky LIRG Survey (GOALS). The SEDs for all objects are similar in that they show a broad, thermal stellar peak (m) and a dominant FIR (m) thermal dust peak, where increases from with increasing . When normalized at IRAS-60m, the largest range in the luminosity ratio, , observed over the full sample is seen in the Hard X-rays ( 2-10 keV), where (). A small range is found in the Radio (1.4 GHz), , where the mean ratio is largest, (). Total infrared luminosities, , dust temperatures, and dust masses were computed from fitting thermal dust emission modified blackbodies to the mid-infrared (MIR) through submillimeter SEDs. The new results reflect an overall 0.02 dex lower luminosity than the original IRAS values. Total stellar masses were computed by fitting stellar population synthesis models to the observed near-infrared (NIR) through ultraviolet (UV) SEDs. Mean stellar masses are found to be . Star formation rates have been determined from the infrared (SFR yr-1) and from the monochromatic UV luminosities (SFR yr-1), respectively. Multiwavelength AGN indicators have be used to select putative AGN: about 60% of the ULIRGs would have been classified as an AGN by at least one of the selection criteria.
1 Introduction
Luminous infrared galaxies (LIRGs: ) are an important class of extragalactic objects. Although relatively rare in the local universe, they still outnumber optically selected starburst and Seyfert galaxies at comparable bolometric luminosity Soifer et al. (1987), and at the highest luminosities, ultraluminous infrared galaxies, (ULIRGs: ), exceed the space density of optically selected quasars by a factor of Sanders et al. (1988). Extensive follow-up observations at radio through X-ray wavelengths of complete samples of objects first discovered in the All-Sky survey, show that (U)LIRGs appear to be powered by a mixture of starburst and AGN activity, triggered by strong interactions and mergers of gas-rich spirals (see Sanders & Mirabel, 1996, for a more complete review).
Despite the nearly two decades since the publication of the first catalogs of (U)LIRGs, there is surprisingly little published photometry that can be used to construct accurate SEDs for even the nearest and best studied sources. The majority of the nearby (U)LIRGs are often “messy” systems that do not lend themselves to simple single aperture measurements. Published data not only suffer from different apertures used at both the same and different wavelengths, but also from inconsistent definitions of the true extent and shape of the interacting galaxies, which are often characterized by highly irregular tidal debris fields. The Great Observatories All-sky LIRG Survey (GOALS: Armus et al., 2009) has made one of its top priorities, the compilation of a consistent set of photometric images of all LIRGs in the Revised Bright Galaxy Sample (RBGS: Sanders et al., 2003), by reanalyzing existing archival data and obtaining new images at radio through X-ray wavelengths111A complete description of the multi-wavelength data can be found on the GOALS website at http://www.goals.ipac.caltech.edu..
This paper presents photometric radio through X-ray SEDs for 64 of the nearest and best studied (U)LIRGs, using common aperture “masks” to compute accurate total fluxes (including the extended tidal debris fields) for each source. These SEDs are then used to compute basic properties for each source — the total infrared (IR) luminosity, dust temperature, dust mass, and total stellar mass. We also compare SEDs of individual sources in order to understand the expected variation in spectral shapes and colors as well as AGN diagnostics for the complete sample of (U)LIRGs. Understanding the range of spectral and physical properties for this class of objects is critical before any direct comparison to their high- counterparts may be made.
The paper is organized as follows: descriptions of the (U)LIRG sample and of the multi-wavelength data sets are provided in §2 and §3, respectively. The complete SEDs and spectral properties are presented in §4. Derived and adopted properties, such as the infrared luminosity, m), dust temperature, dust mass, and stellar mass, , are given in §5. Our conclusions are summarized in §6. Throughout this paper, we adopt a flat model of the universe with a Hubble constant km s-1 Mpc-1, and = 0.28, = 0.72 Komatsu et al. (2009).
2 Sample
Our sample of 64 (U)LIRGs represents the nearest and brightest infrared-luminous extragalactic sources observable from the northern hemisphere. It is a complete subset of all objects in the IRAS Bright Galaxy Sample Soifer et al. (1987), with , originally chosen to satisfy the constraints and in order to minimize Galactic extinction and to be observable from Mauna Kea, respectively222NGC 1068 would have been a part of this sample. However, its proximity and thus, large angular extent, pose a challenge for the UH-2.2m telescope and its limited field-of-view to capture the entire galaxy and its full debris field. Therefore, it has been left out of the current sample.. Our subsample represents 30% of all LIRGs and 50% of all ULIRGs in GOALS. The median infrared luminosity of our subsample is , with a luminosity range . The redshift range is , corresponding to a luminosity distance, Mpc, with median ( Mpc). Basic properties of our subsample of GOALS objects are listed in Table 1.
3 Data
The multi-wavelength images for our targets have been assembled from a variety of sources, including our own extensive archive of ground- and space-based observations of (U)LIRGs, as well as data obtained from various data archives. The sources for the images used in our analysis is detailed in Tables 2 and 3. All images were reprocessed and analyzed using a consistent set of criteria. The procedures used to prepare the photometry masks are described in §3.3.
3.1 Space-based Observations
Observations of the majority of our targets at X-Ray, ultraviolet, and infrared wavelengths were obtained as part of major GOALS observing campaigns. The Chandra-GOALS program Iwasawa et al. (2011) provides X-ray photometry in the Soft X-ray (SX: 0.5-2 KeV) and Hard X-ray (HX: 2-10 KeV) bands. The GALEX-GOALS program Howell et al. (2010) provides observations of the majority of our targets in the far-UV (FUV: m) and near-UV (NUV: m) bands. The Spitzer-GOALS programs (Mazzarella et al. in prep.; Surace et al. in prep.) obtained MIR (3.6, 4.6, 5.4, 8.0m) and FIR (24, 70 and 160m) images with IRAC and MIPS, respectively. The Herschel-GOALS programs (PIs: Sanders, Armus) involving PACS and SPIRE observations are currently ongoing and will be completed in late 2012. IRAS data at 12, 25, 60, 100m as published in the RBGS Sanders et al. (2003) have also been incorporated into our analysis for completeness.
3.2 Ground-based Observations
Most of the observations in the optical bands were taken with the Tektronix 20482048 camera (hereafter, Tek2048) at the University of Hawaii (UH) 2.2m Telescope on Mauna Kea. BVI-band images for 53 LIRGs + 1 ULIRG were originally obtained as part of a PhD Thesis that studied a complete subsample of LIRGs from the IRAS BGS (see Ishida, 2004, for details on the observations and reduction). The primary source of the -band images is the RBGS - Atlas (Mazzarella et al. in prep.), while Surace et al. (1998, 2000), and Surace & Sanders (2000) provide -band data for many of the ULIRGs, all imaged with either the Tek2048 or the Orbit 20482048 cameras on the UH 2.2m Telescope.
The remaining optical, near-infrared (NIR), submillimeter and radio data have been compiled from the literature and the NASA/IPAC Extragalactic Database (NED). Most notably, JHKS images were extracted from the 2-Micron-All-Sky-Survey (2MASS; Skrutskie et al., 2006) Extended Source Image Server, and in the case of large systems spanning multiple frames, the Large Galaxy Atlas Jarrett et al. (2003) via the InfraRed Science Archive (IRSA). Submillimeter data at 850m and 450m, obtained using the Submillimeter Common-User Bolometer Array (SCUBA) at the James Clerk Maxwell Telescope were taken from Dunne et al. (2000) and Dunne & Eales (2001), while 1.49 GHz radio data obtained at the Very Large Array (VLA) were taken from Condon et al. (1990, 1996). All of our archival data sources are summarized in Table 2.
The remaining gaps in our optical photometry table were filled by observed with the Tek2048 camera on the UH 2.2m Telescope during two observing runs, totaling 8 partially photometric nights in February and August of 2008. Each exposure was typically 2-6 minutes, with seeing ranging between – , (see Table 3 for a summary). A dither pattern of was used during the observations. The data were reduced and calibrated using various packages provided by the IDL astron library. The reduction involved several standard steps: all images were bias-subtracted using a median bias computed from bias frames taken at the beginning of each night. There is a location-dependent shutter correction time of 0.18 seconds (Helene Courtois, private communication) for the Tek2048; this is a significant contribution for the images with short exposure times (calibration stars in particular), so all of the data were corrected by this factor. For each of the UVRI filters during each night of the run, a master flat, created from median-combining normalized flats, was used to flat-field all the corresponding science images. After adding astrometry information (using IDL routine STARAST) to the image headers, science images observed close in time within the same night were coadded to increase the signal-to-noise ratio for each target frame. The data were subsequently calibrated with standard stars in the corresponding optical bands Landolt (1983), taking into account airmass corrections. To ensure that consistent apertures were used to find the total flux from each galaxy system, photometry was subsequently measured using previously constructed “masks”, as described in §3.3.
3.3 Photometry Masks
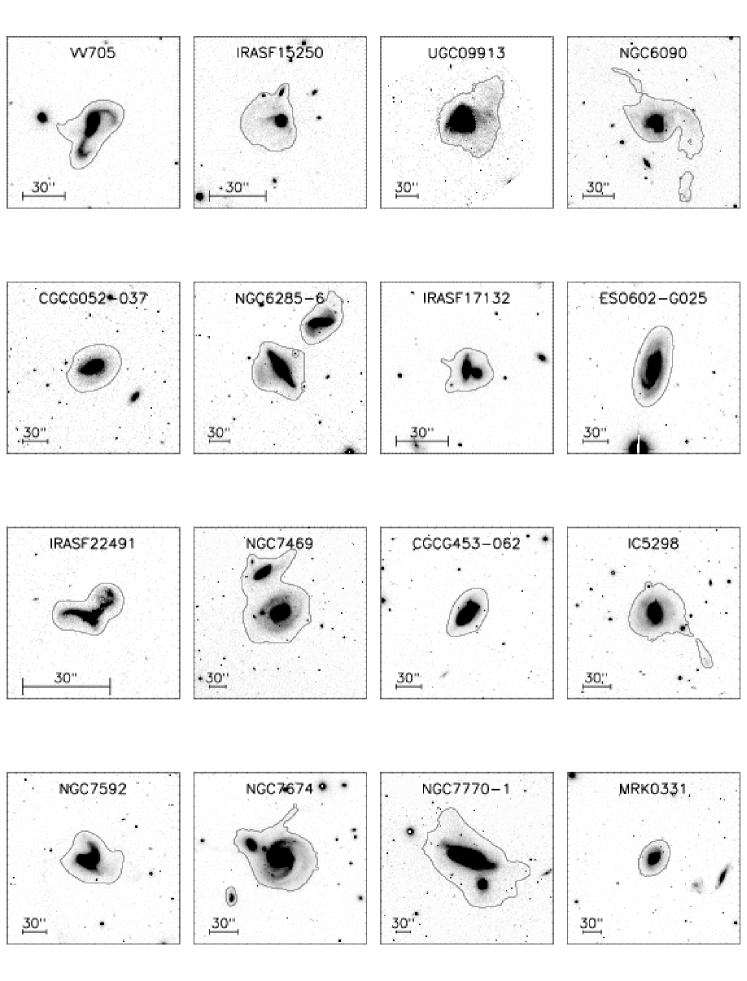
When assembling SEDs for our sources we constructed a single photometric mask for each source that was designed to incorporate the total flux from a galaxy system whether it consists of a single galaxy with disturbed morphology or two separate interacting galaxies. The masks have been defined based on isophotes in the median- and boxcar-smoothed -band images at the surface brightness limit of 24.5 mag/arcsec2 (Vavilkin et al. in prep.). They are intended to encapsulate the global flux from tidal debris as well as individual components within these merger systems. The more luminous 43 objects in our sample () have masks defined using HST-ACS images (Evans et al. in prep.); the other 21 masks were generated using the same technique from ground-based -band images taken with the UH 2.2m Telescope. We have tested for systematic bias between the masks made from HST and ground-based images and found that the difference in measured photometry is less than 0.2%, within photometric uncertainties. The photometry masks for all 64 (U)LIRGs are shown in
Masked photometry has been extracted from images taken at effective wavelength mm and at MIPS 24m band. The short wavelength limit has been imposed due to the fact that the X-ray photon counts are fairly localized, whereas on the longward side, the images are lacking in resolution ( PSF). At either end of the wavelength range, therefore, masks would not improve the precision of the total flux measurement over that of circular or elliptical apertures. Differential emission will be taken into account when deep optical/NIR images probing the extended debris field are acquired in the near future (Spitzer snapshot program, P.I. Sanders). Within the wavelength regime where masks have been applied, the masks are very large relative to the beam size and hence aperture corrections are not needed.
4 Spectral Energy Distribution of the GOALS Sample
In this section we present SEDs (radio through X-ray) for our complete sample of 64 (U)LIRGs. The common aperture mask photometry data are provided in Table 4 (X-ray to NIR) and Table 5 (MIR to radio). The complete radio through X-ray SEDs ( vs ) for each source are shown in the panels of
The photometric data points are overlaid with the best-fit model SEDs, which will be discussed in more detail in §5.1.
(U)LIRGs are known to exhibit several common features in their SEDs, e.g. a drop-off in the UV flux, an optical-NIR stellar thermal “bump”, and a thermal dust “bump” at FIR wavelengths Sanders & Mirabel (1996). However, photometry compiled for our complete local sample displays varied spectral shapes across the electromagnetic spectrum. The main goal of our current study is to characterize the full SED and spectral properties of (U)LIRGs as follows.
4.1 Spectral Shapes
Before we employ the SEDs of these (U)LIRGs as local templates, we must first understand the variations in the spectral shapes across the range of various attributes. In particular,
hows the radio through X-ray SEDs of all 64 (U)LIRGs. Normalized at -band, this plot shows the best-fit modeled fluxes at the observed filters and brings out the variations in the optical (UV-NIR) regime, the shortward end of which at FUV is characterized by the young stellar populations in the galaxies. No attempt has been made to connect the observed X-ray emission to the UV flux given our lack of data in the nearly two decade wavelength range between the FUV and soft X-ray (SX) measurements.
To better demonstrate both the range and mean of the object SEDs, we show in
he mean SED along with the 25%, 75%, and max/min values for the 11 ULIRGs and 53 LIRGs separately. Qualitatively speaking, the overall SED shape is similar for all of the LIRGs and ULIRGs, with two significant maxima, one of which is near 1m and the other near 80m, with a large dip between them, and all SEDs falling towards the FUV and at submillimeter wavelengths. The logarithmic difference between the stellar and dust peaks is 1.2 dex for the ULIRGs but only 0.7 dex for the LIRGs, providing a quantitative measure for the change in stellar-to-dust ratio with infrared luminosity. The next two sections offer different ways to quantify the spectral shapes. The fit data values for the mean SEDs for both LIRGs and ULIRGs are given in Table 6.
4.2 Spectral Indices
A useful and more quantitative way of discussing the spectral shapes of SEDs makes use of spectral indices defined as follows:
| (1) |
where the indices (1,2) correspond to observed wavelengths in microns. To mirror a high- SED study of a 70-m seltected sample of (U)LIRGs Kartaltepe et al. (2010), here we have chosen three wavelength ranges where the SEDs appear to show the largest variations - in the UV-optical (m), NIR (m) and the MIR (m). These three wavelength ranges correspond to the shaded regions shown in
The top panels in
how vs. for three different spectral indices, corresponding to the three wavelength ranges described above. The mean values of for LIRGs and ULIRGs along with a regression analysis for the full subsample of 64 objects is given in Table 7.
In
e compare spectral indices: vs. contrasts the slopes on either side of the stellar “bump”; vs. contrasts the blue-ward slopes of the optical and the infrared “bumps”, respectively; vs. contrasts the red-ward and blue-ward slopes of the optical and infrared “bumps”, respectively. The correlation coefficients for these three sets of comparisons are -0.08, -0.03, and -0.01. With this sample size, the conservative, non-directional -values are 0.57, 0.83, and 0.94, respectively. This indicates that there is no correlation found between each pair of spectral indices. However, we note that for all three spectral index comparisons, the ULIRGs tend to show smaller values of and , corresponding to a deeper trough at m, presumably due to greater silicate dust absorption of the continuum in ULIRGs. The physical significance of using as an AGN indicator is further discussed in §5.1.5.
4.3 Flux Ratios
The SED shapes can also be characterized in terms of flux ratios with respect to the measured flux at 60m to compare direct stellar emission to dust emission.
hows the distribution of flux ratios at Radio (1.4 GHz), -band (1.2m) , (0.23m), and HX (2-10 keV), for all 11 ULIRGs and 53 LIRGs, where data are available. The wavelengths chosen for display represent the short and long wavelength extremes of the SEDs as well as the “peak” and the short wavelength side of the stellar thermal bump. For the -band and NUV ratios, the difference in the distributions between ULIRGs and LIRGs is simply due to the well-known property of the SEDs where the thermal stellar “bump” remains relatively constant () while the thermal dust “bump” grows by a factor of (e.g. Sanders & Mirabel, 1996). The differerent distributions for the LIRGs and ULIRGs point to the discrepant starlight-to-dust ratios in the two populations. The HX band shows a somewhat surprising result in that the ratio seems to be similar for both LIRGs and ULIRGs.
Finally, we summarize the SEDs of our complete sample of (U)LIRGs in Table 8, which lists the relative mean luminosity, , in all 26 observed bands with respect to the mean luminosity at 60m. Table 8 also lists the dispersion in the luminosity ratio, , and the full range, . The largest values of are found at the long and short wavelength ends of the SEDs, where the emission is clearly not fit by the two (stellar and dust) thermal “bumps”. However, it is interesting to note that a small dispersion in is found in the Radio (1.4 GHz), where the ratio is largest (). This would seem to confirm that the well-known “radio-infrared correlation” (e.g. Helou et al., 1985), also holds for (U)LIRGs.
At X-ray wavelengths, there seems to be a 0.4 dex increase in the mean luminosity in the HX band compared to the SX band. Of the 26 objects within our sample that are detected in both X-ray bands, 58% are more luminous in HX than in SX, suggesting the presence of a HX ionizing source. Due to the relative incompleteness of X-ray observations at the lower-luminosity end of our sample, this is slightly higher than the conservative estimate of 37% AGN fraction (or 48% if [Ne v] detection is taken into account) from an X-ray study of 44 GOALS (U)LIRGs at the high end of the range (with median ; Iwasawa et al., 2011). Incorporating the entire GOALS sample, Petric et al. (2011) found that 18% of all (U)LIRGs contain an AGN based on a mid-IR Spitzer-IRS study; the comparatively lower fraction reflect that fewer of the lower-luminosity objects feature an AGN. We note that because of the complexity of dust geometry within these systems, discrepancies among the AGN fractions thus determined may be due to the limited sensitivity of the various AGN indicators.
5 Physical Properties of the GOALS Sample
Here we discuss the template fitting done to compute infrared luminosity and stellar mass; specifically, we fit the MIR-submillimeter portion of the SED with various dust models to compute and compare with previous estimates of computed from IRAS photometry. We use population synthesis models to fit the UV-NIR portion of the SED in order to determine stellar mass. These masses are then compared with stellar mass estimates computed using -band luminosities alone.
5.1 Template Fits
We have fitted each of the (U)LIRG SEDs with stellar population synthesis and dust models (see
. Our goals are two-fold: (1) to better determine stellar mass () and subsequently star formation rate (SFR) of the local (U)LIRGs, and (2) to better estimate the flux at any unobserved wavelength band. The optical-through-NIR SED fitting has been done using the Le PHotometric Analysis for Redshift Estimations (Le PHARE333http://www.cfht.hawaii.edu/$∼$arnouts/LEPHARE/cfht_lephare/lephare.html) code, a photometric redshift and simulation package developed by S. Arnouts & O. Ilbert. It is capable of providing optical and FIR fitting as well as a complete treatment of physical parameters and uncertainties based on the simple stellar population synthesis model of choice. As described below we consider both a Salpeter Salpeter (1955) and Chabrier Chabrier (2003) IMF for all of our sources, plus a Calzetti extinction law Calzetti et al. (1994) adopted throughout. Stellar masses were determined from fitting the observed data shortward of -band.
5.1.1 Infrared Luminosities, Dust Temperatures, and Dust Masses
The infrared luminosity, , that is discussed throughout this paper refers to the luminosity emitted in the wavelength range m. The values of given in Table 1 have been adopted from the RBGS using the following prescription reproduced from Perault (1987) and Sanders & Mirabel (1996):
| (2) |
| (3) |
where , , , , are the flux densities in Jy at 12, 25, 60, and 100 m, respectively, and is the luminosity distance.
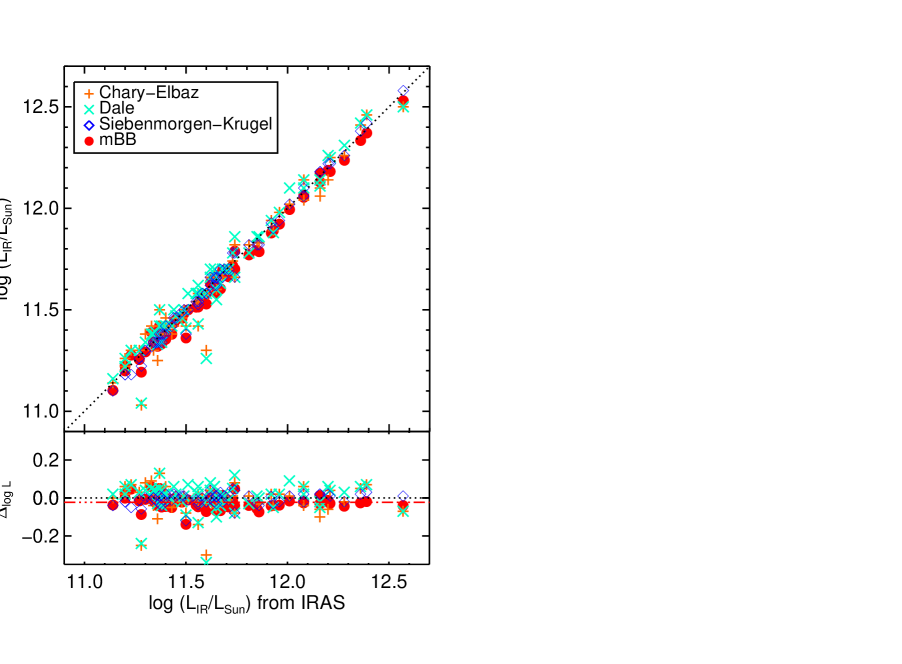
Given the availability of our new IRAC, MIPS and SCUBA data points, we can now test the above IRAS approximation and the validity of the assumed SED, in particular longward of 100m, for the local (U)LIRG population. We compute a new total infrared luminosity, m, by using minimization to fit the MIR-FIR-submm portion (14 data points) of the SEDs with different dust models and a modified black body fit (CE,DH,SK,mBB: Chary & Elbaz, 2001; Dale & Helou, 2002; Siebenmorgen & Krügel, 2007; Casey, 2012, Table 9). For the CE models, 105 templates with infrared luminosity ranging from to have been used. For the DH models, the 64 templates employed exhibit infrared luminosity within the range of . The SK template library in LEPHARE consists of spatially integrated SEDs computed for starbursts of different radii, total luminosity, visual extinction, dust density within hot spots, and the luminosity ratio of hot spots to total as a secondary parameter based on Siebenmorgen & Krügel (2007). We utilized the models with radii = 1kpc, , mag, cm-3, and OB luminosity to total luminosity of 40%-90%. Lastly, the model-independent mBB fit is essentially the sum of a mid-infrared powerlaw at and a single-temperature greybody at m Casey (2012):
| (4) |
where is the far infrared dust temperature, is the wavelength corresponding to an optical depth of unity, is the wavelength where the mid-infrared powerlaw turns over, is the emissivity, and is the spectral index of the powerlaw component. We let and vary to fit the SED where adequate data exist (see more details in Casey, 2012).
The comparison of values is shown in
The CE and DH model fits have large scatters (0.07 dex and 0.08 dex) around the IRAS values. The SK model fits exhibit a large scatter (0.05 dex) around the systematic offset of dex from the IRAS luminosities. The mBB fit values are 0.02 dex systematically lower than the IRAS values, which translates to 5% of the infrared luminosity at level. The disagreement with the IRAS values is primarily due to the inadequate color assumptions implied in the coefficients of Eqn. 2. The scatter and discrepancy exhibited by the luminosities derived from the model-dependent templates are due to limitations in the step size within the model grids.
Comparing the fits of the different templates and the mBB at 12, 25, 60, 100, and 850m, the residuals between the data and the different fits are the smallest for mBB. The SK fits result in similarly minimal residuals except at the short wavelengths, whereas the CE and DH fit residuals exhibit the largest scatters. The main reason for the mismatch to the data is that the detailed infrared SED models have many degrees of freedom and very large template libraries at discrete temperatures and other grid parameters. In contrast, the analytical mBB fit provides more fitting flexibility and is designed to represent the data as accurately as possible, despite having only three free parameters and not accounting for the mid-infrared PAH features. Since for this paper we only measure , , and , we choose to adopt the mBB fit results for the rest of the analyses.
Fitting greybody of a single dust temperature to the FIR SED from the blackbody peak (m) to 1000m, we determine and present the temperature of the dust in Table 9: mean K. This temperature is 10K cooler than that determined from the Perault (1987) prescription (see discussion in Casey, 2012). With the lack of long-wavelength data points, the latter assumes a single temperature dust emissivity model fit to the fluxes in the four IRAS bands (as described in Sanders & Mirabel, 1996), often adopting a peak shortward of the true peak now revealed when data points longward of 100m are present. The MIPS-160m and the SCUBA-850m points are invaluable for constraining the real peak, and this will be nailed when the Herschel far-infrared imaging observations are completed for the entire GOALS sample. Dust masses were calculated using the 850m flux from the SED and Eqn. 8 in Casey et al. (2011):
| (5) |
where is the flux density at frequency , is the dust mass absorption coefficient at , is the Planck function at temperature , and is the luminosity distance. We adopted a dust absorption coefficient of m2 kg-1 Weingartner & Draine (2001); Dunne et al. (2003). We derived a mean dust temperature for the sample.
We note that dust temperatures and masses depend critically on a thorough understanding of the radiative transfer involved as well as the underlying geometry of the dust cloud. This dust temperature can be taken as a characteristic for the system (measured from the peak of the SED). Clearly the physics of these galaxies is more complex, comprising of many dust reservoirs of different temperatures. Unfortunately probing that is beyond the current scope of observations and this work. We included our derivation of the dust temperature primarily as a baseline for comparison to the high- universe, though we caution that the physical interpretation of that quantity remains uncertain.
5.1.2 Stellar Masses
Stellar masses for the (U)LIRGs in our sample have been computed via two methods using two different initial mass functions (IMFs), and the resulting masses are given in Table 10. Here, we discuss the differences among these measurements.
The two methods adopted for mass determination were to fit the UV-NIR part of the SEDs and to scale from the -band luminosity. -band is usually selected for stellar mass conversion because it is at or near the photospheric peak of the stellar SED, and is thought not to be contaminated by hot dust emission from AGN Hainline et al. (2011). However, problems with -band scaling may also arise due to thermally pulsing asymptotic giant branch stars for SEDs with a significant contribution from young stellar populations Walcher et al. (2011). On the other hand, the SED-fitted masses encompass the stellar component contributing to the optical peak, taking into account the treatment of dust with the designated dust extinction law. For the ensuing discussion, we focus on comparing the SED-fitted masses derived from using two different IMFs.
Our optical-NIR SED fitting procedure is based on stellar population synthesis models from Bruzual & Charlot (2003) using 10 different broadband UV, optical, and infrared bands. Two different IMFs were used: a Chabrier IMF Chabrier (2003) and a Salpeter IMF Salpeter (1955). Since the IMF dictates the scaling of the mass-to-light () ratio in converting luminosity to mass via its slope and mass cutoffs, we compare the masses derived from these two IMFs and assess their differences (
. The lower and upper mass cutoffs employed were 0.1 and 100 , respectively Bruzual & Charlot (2003); no additional adjustments to the parameters of the IMFs have been made. The models assumed a star formation history with where , varying from , is the e-folding parameter in years. The metallicity () has been treated as a free parameter as well.
In general, the mean difference between the masses derived from both methods is at the level of 0.260.41 dex, with the masses generally being underestimated from the Salpeter IMF. This was unexpected given that Salpeter IMF tends to result in higher stellar masses due to the difference in treatment of the low-mass end — the Chabrier IMF tends flatter and therefore more physical. Under the same input parameters the stellar models with Chabrier IMF fitted the UV light in our SEDs better than their Salpeter counterparts. We also note that the Chabrier IMF incorporates a more up-to-date treatment of UV radiation from young stars in starburst populations, and thus the Chabrier masses have been adopted as the stellar masses for the local (U)LIRGs.
5.1.3 Comparison of and
hows the (U)LIRGs as a distribution of SED-fitted mass in logarithmic scale. All but three of the 64 objects fall within 2 of the mean mass, log .
For the individual subsamples of 53 LIRGs and 11 ULIRGs, we find the mean stellar masses to be for the LIRGs, and for the ULIRGs. The factor of lower mean stellar mass for LIRGs is primarily due to a decreasing “low mass tail” of objects with masses in the range . On the other extreme, the most massive object (UGC 08058 = Mrk 231) appears to show hot dust emission from the central AGN, which contributes about 20% of the -band flux Surace & Sanders (1999, 2000). Thus for this one object, we have corrected the fitted stellar mass accordingly.
Our results are consistent with estimates of the mass of objects of similar luminosity at higher redshift: log (from Takagi et al., 2003, where the two-tailed unpaired -value for the differences between our ULIRG masses gives 0.052, which is not statistically significant); and log (from Melbourne et al., 2008, who found that (U)LIRGs are more massive than “normal”, non-LIRG galaxies that are morphologically irregulars and spirals from the GOODS-S field where log ).
5.1.4 Star Formation Rates
Using the light contribution from the UV and IR, we determine the star formation rate for the unobscured and obscured stellar populations, respectively. The recipe from Wuyts et al. (2011) gives the following calibration for converting from infrared and monochromatic UV luminosity at 2800Å to star formation rate:
| (6) |
Decomposing this quantity into separate UV and IR components, we consider the contribution to the total star formation rate from the UV and IR luminosities individually (Table 11). SFRUV ranges from 1 to 10 yr-1, while SFRIR is up to 50 times larger. We show the fold enrichment of SFRIR to SFRUV as a function of infrared luminosity in
The logarithmic difference for the LIRGs centered at 1.490.66 dex, while that for the ULIRGs is more clustered at 1.900.24 dex. This figure highlights that while the infrared star formation rate in ULIRGs is 100 times that determined from the UV, the fold enrichment in the LIRGs is only 30 times with a large scatter potentially due to the large variations in dust geometry (i.e. single spirals undergoing minor merger events as opposed to major-merging pairs).
The mean log SFRUV+IR for the GOALS ULIRGs is 2.250.16 and that for the LIRGs is 1.570.19. Corresponding specific star formation rates (sSFR = SFRUV+IR/) have been computed and are also listed in Table 11. The effect on SFR from UV emission and trends with infrared luminosity as seen in the GOALS (U)LIRGs as well as the comparison to a nearby lower-luminosity sample (SINGS; Kennicutt et al., 2003) have been discussed extensively in Howell et al. (2010). Compared with the Howell et al. (2010) sample (with median SSFR yr-1), the median SSFR of our sample is yr-1, or equivalent to a mass-doubling timescale of 1.5 Gyr. Our median SSFR value is higher because the GALEX sample is more complete at the lower-luminosity end (with less extinction by dust). The slope of the relation is -0.78 (or 0.22 in space) for the (U)LIRGs, which is shallower than that reported for the high- infrared main sequence galaxies Rodighiero et al. (2011); Daddi et al. (2007).
5.1.5 AGN Indicators
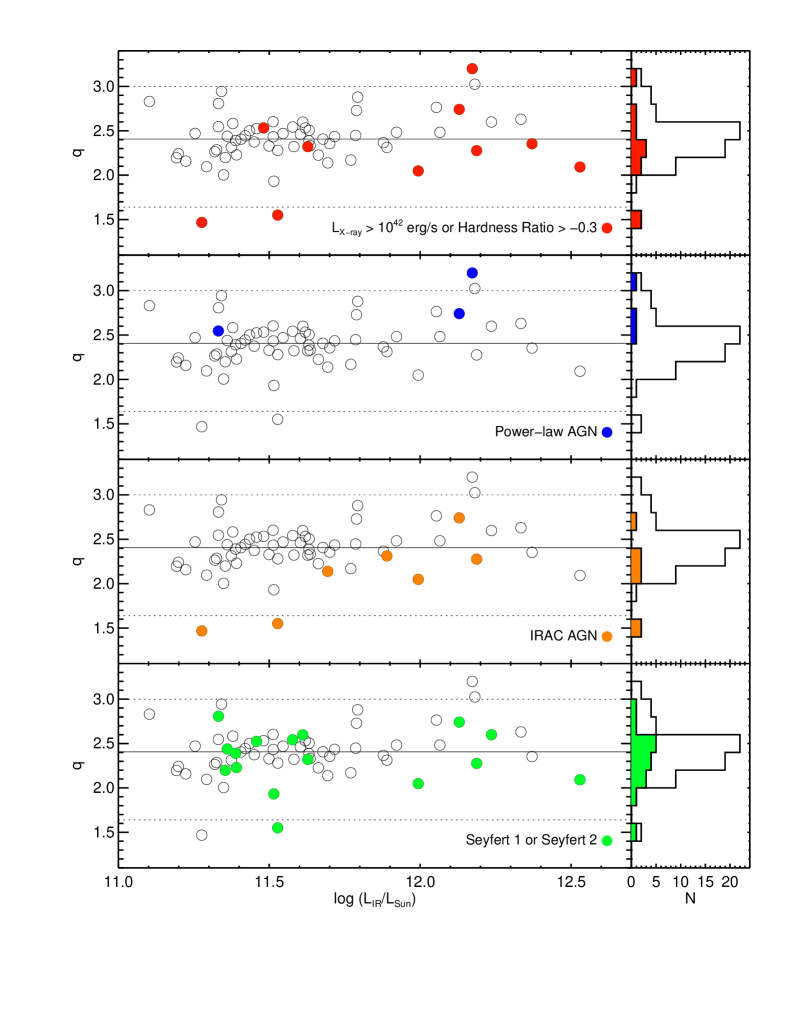
Different wavelengths offer different methods for diagnosing AGN candidates; a multi-wavelength SED study allows simultaneous access to these various indicators and may be used to evaluate their effectiveness. We employ the radio-infrared flux ratio () as defined by Condon et al. (1991) and the criteria specified by Yun et al. (2001) (radio-excess: ; infrared-excess: ) as the basis of our comparison.
hows plotted as a function of along with its distribution in the right panels. The mean for the sample. With these limits, there are two LIRGs (with ) identified as radio-excess sources. These objects may be potential AGN hosts with compact radio core or radio jets and lobes Kartaltepe et al. (2010); Sanders & Mirabel (1996). On the other end, both of the infrared-excess sources are ULIRGs, which may be hosting dense and compact starbursts, or a dust-enshrouded AGN.
For objects with X-ray detection, we define two different criteria for identifying X-ray AGNs: 1. Kartaltepe et al. (2010), and 2. Hardness Ratio HR Iwasawa et al. (2011). Seven systems qualified as an X-ray AGN by the first criterion, six by the second, and three of these objects were identified by both. Both radio-excess sources are very luminous in the HX band. All the HR AGN candidates are ULIRGs, though there may be a selection bias since all 11 of 11 ULIRGs in the GOALS sample have been observed and detected in the X-ray, but only 16 of 53 LIRGs have been observed thus far. Chandra observations of the lower-luminosity LIRGs have been proposed and awarded in Cycle 14 (P.I. Sanders) to complete the sample.
Power-law SED provides a complementary way to select AGNs that might be heavily obscured and opaque to hard X-ray emission. We apply a criterion based on to select galaxies with power-law SED shape in the near-IR, corresponding to spectral slope of 0.4 Kartaltepe et al. (2010); Alonso-Herrero et al. (2006); Donley et al. (2007). Only three power-law AGN candidates are identified in the sample, and the two ULIRGs among these are both X-ray AGN candidates.
Additional MIR-based selection criteria have been devised to identify heavily-obscured AGNs missed in deep X-ray surveys. In particular, selection based on IRAC color cuts Lacy et al. (2004); Stern et al. (2005) is insensitive to obscuration but can trace AGN-heated dust, providing a powerful technique for discerning luminous obscured and unobscured AGNs. The revised IRAC color selection by Donley et al. (2012) is designed to incorporate the best aspects of the current IRAC wedges but to minimizie star-forming contamints, and has been adopted here for selecting IRAC AGN candidates (see Eqn. 1 and 2 in Donley et al., 2012). This set of criteria results in 7 IRAC AGN candidates in our sample, two of them being ULIRGs. Interestingly, most of the IRAC AGNs are below the median of the sample (), with two of them being radio-excess sources.
Our last AGN indicator comparison involves selection based on optical emission line diagnostics. Yuan et al. (2010) applied an SDSS-based semi-empirical optical spectral classification scheme to a large sample of local infrared galaxies, 57 of which are in our current sample. Among these, two are Seyfert 1 galaxies and 14 are Seyfert 2 systems. These Seyferts bear a distribution in similar to that of the entire sample.
6 Conclusions
We have used common aperture masks for the first time to assemble accurate radio through X-ray SEDs of a complete local sample of 53 LIRGs and 11 ULIRGs observable from the northern hemisphere (, ). We have utilized several new large datasets provided by GOALS’s space- and ground-based observations of (U)LIRGs along with additional archival data from the literature and our own previously unpublished ground-based opt-NIR data from Mauna Kea in our analysis of these SEDs. We summarize our findings as follows:
-
•
The SEDs for all objects are similar in that they show a broad, thermal stellar peak (m) and a dominant FIR (m) thermal dust peak, where varies from with increasing . The logarithmic difference between the stellar and dust peaks is 1.2 dex for the ULIRGs and 0.7 dex for the LIRGs.
-
•
When normalized at IRAS-60m, the largest range in the luminosity ratio, , observed over the full sample is seen in the Hard X-rays (keV), where (). A small range is found in the Radio (1.4 GHz), , where the mean ratio is largest, ().
-
•
Infrared luminosities, m), have been recomputed using a modified blackbody fit Casey et al. (2011) to the MIR-FIR-submm SEDs. The new values are overall 0.02 dex lower than the original IRAS values Sanders et al. (2003), primarily due to the disagreement with the color indices implied in the coefficients of the Perault (1987) equation. The simple, analytical blackbody fit results have thus been adopted in determining the FIR properties of the (U)LIRGs (e.g. , , and ).
- •
-
•
Star formation rates determined from infrared and monochromatic UV luminosities individually have been compared: SFRUV ranges from 1 to 10 yr-1, while SFRIR is up to 50 times larger. The logarithmic difference for the ULIRGs is much more clustered (1.900.24 dex) than for the LIRGs (1.490.66 dex), plausibly due to large variations in dust geometry among the lower-luminosity objects.
-
•
Radio—infrared flux ratio (), along with other multiwavelength criteria, have been assessed as different AGN indicators. The results among the various selection techniques complement each other. About 60% of the ULIRGs (and 25% of the LIRGs) would be classified as an AGN by at least one of the selection criteria.
18. VU also extends appreciation towards the UH TAC for their generous support of this project in awarding telescope time on Mauna Kea, as well as Colin Aspin and the UH 2.2m Telescope staff for their help and support in the acquisition of the ground-based optical photometry. This research has made use of the NASA/IPAC Extragalactic Database (NED) and IPAC Infrared Science Achive, which are operated by the Jet Propulsion Laboratory, California Institute of Technology, under contract with the National Aeronautics and Space Administration. This publication has also made use of data products from the Two Micron All Sky Survey, which is a joint project of the University of Massachusetts and the Infrared Processing and Analysis Center/California Institute of Technology, funded by the National Aeronautics and Space Administration and the National Science Foundation. VU wishes to acknowledge funding support from the NASA Harriet G. Jenkins Predoctoral Fellowship Project and Giovanni Fazio via the Smithsonian Astrophysical Observatory Predoctoral Fellowship and JPL Contract/IRAC GTO Grant # 1256790. This paper is dedicated to the memory of Michele Dufault, who put in much hard work into the photometry extraction for the basis of this paper.
References
- Alonso-Herrero et al. (2006) Alonso-Herrero, A., et al. 2006, ApJ, 640, 167
- Armus et al. (2009) Armus, L., et al. 2009, PASP, 121, 559
- Bruzual & Charlot (2003) Bruzual, G., & Charlot, S. 2003, MNRAS, 344, 1000
- Calzetti et al. (1994) Calzetti, D., Kinney, A. L., & Storchi-Bergmann, T. 1994, ApJ, 429, 582
- Casey (2012) Casey, C. M. 2012, ArXiv e-prints, 1206.1595
- Casey et al. (2011) Casey, C. M., et al. 2011, MNRAS, 415, 2723
- Chabrier (2003) Chabrier, G. 2003, PASP, 115, 763
- Chary & Elbaz (2001) Chary, R., & Elbaz, D. 2001, ApJ, 556, 562
- Condon et al. (1990) Condon, J. J., Helou, G., Sanders, D. B., & Soifer, B. T. 1990, ApJS, 73, 359
- Condon et al. (1996) —. 1996, ApJS, 103, 81
- Condon et al. (1991) Condon, J. J., Huang, Z., Yin, Q. F., & Thuan, T. X. 1991, ApJ, 378, 65
- Daddi et al. (2007) Daddi, E., et al. 2007, ApJ, 670, 156
- Dale & Helou (2002) Dale, D. A., & Helou, G. 2002, ApJ, 576, 159
- Donley et al. (2012) Donley, J. L., et al. 2012, ApJ, 748, 142
- Donley et al. (2007) Donley, J. L., Rieke, G. H., Pérez-González, P. G., Rigby, J. R., & Alonso-Herrero, A. 2007, ApJ, 660, 167
- Dunne et al. (2000) Dunne, L., Eales, S., Edmunds, M., Ivison, R., Alexander, P., & Clements, D. L. 2000, MNRAS, 315, 115
- Dunne et al. (2003) Dunne, L., Eales, S., Ivison, R., Morgan, H., & Edmunds, M. 2003, Nature, 424, 285
- Dunne & Eales (2001) Dunne, L., & Eales, S. A. 2001, MNRAS, 327, 697
- Hainline et al. (2011) Hainline, L. J., Blain, A. W., Smail, I., Alexander, D. M., Armus, L., Chapman, S. C., & Ivison, R. J. 2011, ApJ, 740, 96
- Helou et al. (1985) Helou, G., Soifer, B. T., & Rowan-Robinson, M. 1985, ApJ, 298, L7
- Howell et al. (2010) Howell, J. H., et al. 2010, ApJ, 715, 572
- Ishida (2004) Ishida, C. M. 2004, PhD thesis, University of Hawai’i
- Iwasawa et al. (2011) Iwasawa, K., et al. 2011, A&A, 529, A106
- Jarrett et al. (2003) Jarrett, T. H., Chester, T., Cutri, R., Schneider, S. E., & Huchra, J. P. 2003, AJ, 125, 525
- Kartaltepe et al. (2010) Kartaltepe, J. S., et al. 2010, ApJ, 709, 572
- Kennicutt et al. (2003) Kennicutt, Jr., R. C., et al. 2003, PASP, 115, 928
- Komatsu et al. (2009) Komatsu, E., et al. 2009, ApJS, 180, 330
- Lacy et al. (2004) Lacy, M., et al. 2004, ApJS, 154, 166
- Landolt (1983) Landolt, A. U. 1983, AJ, 88, 439
- Melbourne et al. (2008) Melbourne, J., et al. 2008, AJ, 135, 1207
- Perault (1987) Perault, M. 1987, PhD thesis, University of Paris
- Petric et al. (2011) Petric, A. O., et al. 2011, ApJ, 730, 28
- Rodighiero et al. (2011) Rodighiero, G., et al. 2011, ApJ, 739, L40
- Salpeter (1955) Salpeter, E. E. 1955, ApJ, 121, 161
- Sanders et al. (2003) Sanders, D. B., Mazzarella, J. M., Kim, D.-C., Surace, J. A., & Soifer, B. T. 2003, AJ, 126, 1607
- Sanders & Mirabel (1996) Sanders, D. B., & Mirabel, I. F. 1996, ARA&A, 34, 749
- Sanders et al. (1988) Sanders, D. B., Soifer, B. T., Elias, J. H., Madore, B. F., Matthews, K., Neugebauer, G., & Scoville, N. Z. 1988, ApJ, 325, 74
- Siebenmorgen & Krügel (2007) Siebenmorgen, R., & Krügel, E. 2007, A&A, 461, 445
- Skrutskie et al. (2006) Skrutskie, M. F., et al. 2006, AJ, 131, 1163
- Soifer et al. (1987) Soifer, B. T., Sanders, D. B., Madore, B. F., Neugebauer, G., Danielson, G. E., Elias, J. H., Lonsdale, C. J., & Rice, W. L. 1987, ApJ, 320, 238
- Stern et al. (2005) Stern, D., et al. 2005, ApJ, 631, 163
- Surace & Sanders (1999) Surace, J. A., & Sanders, D. B. 1999, ApJ, 512, 162
- Surace & Sanders (2000) —. 2000, AJ, 120, 604
- Surace et al. (2000) Surace, J. A., Sanders, D. B., & Evans, A. S. 2000, ApJ, 529, 170
- Surace et al. (1998) Surace, J. A., Sanders, D. B., Vacca, W. D., Veilleux, S., & Mazzarella, J. M. 1998, ApJ, 492, 116
- Takagi et al. (2003) Takagi, T., Arimoto, N., & Hanami, H. 2003, MNRAS, 340, 813
- Walcher et al. (2011) Walcher, J., Groves, B., Budavári, T., & Dale, D. 2011, Ap&SS, 331, 1
- Weingartner & Draine (2001) Weingartner, J. C., & Draine, B. T. 2001, ApJ, 548, 296
- Wuyts et al. (2011) Wuyts, S., et al. 2011, ApJ, 738, 106
- Yuan et al. (2010) Yuan, T.-T., Kewley, L. J., & Sanders, D. B. 2010, ApJ, 709, 884
- Yun et al. (2001) Yun, M. S., Reddy, N. A., & Condon, J. J. 2001, ApJ, 554, 803
![[Uncaptioned image]](/html/1209.1611/assets/x1.png)
![[Uncaptioned image]](/html/1209.1611/assets/x2.png)
![[Uncaptioned image]](/html/1209.1611/assets/x3.png)
![[Uncaptioned image]](/html/1209.1611/assets/x5.png)
![[Uncaptioned image]](/html/1209.1611/assets/x6.png)
![[Uncaptioned image]](/html/1209.1611/assets/x7.png)
![[Uncaptioned image]](/html/1209.1611/assets/x8.png)


| RBGS Name | RA | Dec | log ()IRAS | Other Names | |
|---|---|---|---|---|---|
| (J2000) | (J2000) | () | (Mpc) | ||
| NGC 0034 | 00 11 06.5 | 12 06 26 | 11.49 | 84.1 | NGC 0017, VV 860, Mrk 0938 |
| MCG -02-01-051/2 | 00 18 50.4 | 10 22 08 | 11.48 | 117.5 | Arp 256, VV 352 |
| NGC 0232 | 00 42 45.8 | 23 33 41 | 11.44 | 95.2 | VV 830 |
| IC 1623A/B | 01 07 47.2 | 17 30 25 | 11.71 | 85.5 | Arp 236, VV 114 |
| MCG -03-04-014 | 01 10 08.9 | 16 51 10 | 11.65 | 144.0 | |
| CGCG 436-030 | 01 20 02.7 | 14 21 43 | 11.69 | 134.0 | |
| IRAS F01364-1042 | 01 38 52.9 | 10 27 11 | 11.85 | 210.0 | |
| III Zw 035 | 01 44 30.5 | 17 06 05 | 11.64 | 119.0 | |
| NGC 0695 | 01 51 14.2 | 22 34 57 | 11.68 | 139.0 | UGC 01315, V Zw 123 |
| NGC 0958 | 02 30 42.8 | 02 56 20 | 11.20 | 80.6 | |
| UGC 02238 | 02 46 17.5 | 13 05 44 | 11.33 | 92.4 | |
| UGC 02369 | 02 54 01.8 | 14 58 25 | 11.67 | 136.0 | |
| IRAS F03359+1523 | 03 38 46.7 | 15 32 55 | 11.55 | 152.0 | |
| UGC 02982 | 04 12 22.4 | 05 32 51 | 11.20 | 74.9 | |
| ESO 550-IG025 | 04 21 20.0 | 18 48 48 | 11.51 | 138.5 | |
| NGC 1614 | 04 33 59.8 | 08 34 44 | 11.65 | 67.8 | Arp 186, Mrk 0617, II Zw 015 |
| IRAS F05189-2524 | 05 21 01.5 | 25 21 45 | 12.16 | 187.0 | |
| NGC 2623 | 08 38 24.1 | 25 45 17 | 11.60 | 84.1 | UGC 04509, Arp 243, VV 079 |
| IRAS F08572+3915 | 09 00 25.4 | 39 03 54 | 12.16 | 264.0 | |
| UGC 04881 | 09 15 55.1 | 44 19 55 | 11.74 | 178.0 | Arp 055, VV 155 |
| UGC 05101 | 09 35 51.6 | 61 21 11 | 12.01 | 177.0 | |
| MCG +08-18-012/3 | 09 36 37.2 | 48 28 28 | 11.34 | 117.0 | CGCG 239-011 |
| IC 0563/4 | 09 46 20.6 | 03 03 30 | 11.23 | 92.9 | UGC 05230, Arp 303 |
| NGC 3110 | 10 04 02.1 | 06 28 29 | 11.37 | 79.5 | NGC 3122, NGC 3518 |
| IRAS F10173+0828 | 10 20 00.2 | 08 13 34 | 11.86 | 224.0 | |
| IRAS F10565+2448 | 10 59 18.1 | 24 32 35 | 12.08 | 197.0 | |
| MCG +07-23-019 | 11 03 53.2 | +0 50 57 | 11.62 | 158.0 | Arp 148, VV 032 |
| CGCG 011-076 | 11 21 12.2 | 02 59 03 | 11.43 | 117.0 | |
| IC 2810A/B | 11 25 45.0 | 14 40 36 | 11.64 | 157.0 | UGC 06436 |
| NGC 3690/IC 694 | 11 28 30.4 | 58 34 10 | 11.93 | 50.7 | Arp 299, VV 118 |
| IRAS F12112+0305 | 12 13 46.0 | 02 48 38 | 12.36 | 340.0 | |
| IRAS F12224-0624 | 12 25 03.9 | 06 40 53 | 11.36 | 125.0 | |
| UGC 08058 | 12 56 14.2 | 56 52 25 | 12.57 | 192.0 | Mrk 0231, VII Zw 490 |
| NGC 4922 | 13 01 24.9 | 29 18 40 | 11.38 | 111.0 | UGC 08135, VV 609 |
| ESO 507-G070 | 13 02 52.3 | 23 55 18 | 11.56 | 106.0 | |
| IC 0860 | 13 15 03.5 | 24 37 08 | 11.14 | 56.8 | |
| VV 250 | 13 15 32.8 | 62 07 37 | 11.81 | 142.0 | UGC 08335, Arp 238, VII Zw 506 |
| UGC 08387 | 13 20 35.3 | 34 08 22 | 11.73 | 110.0 | IC 0883, Arp 193, VV 821, I Zw 056 |
| NGC 5104 | 13 21 23.1 | 00 20 33 | 11.27 | 90.8 | UGC 08391 |
| MCG -03-34-064 | 13 22 24.4 | 16 43 43 | 11.28 | 82.2 | |
| NGC 5135 | 13 25 44.0 | 29 50 01 | 11.30 | 60.9 | |
| NGC 5256 | 13 38 17.5 | 48 16 37 | 11.56 | 129.0 | UGC 08632, Mrk 0266, I Zw 067 |
| NGC 5257/8 | 13 39 55.2 | 00 50 13 | 11.62 | 108.5 | Arp 240, VV 055 |
| UGC 08696 | 13 44 42.1 | 55 53 13 | 12.21 | 173.0 | Mrk 0273, VV 851, I Zw 071 |
| CGCG 247-020 | 14 19 43.2 | 49 14 12 | 11.39 | 120.0 | Mrk 1490 |
| IRAS F14348-1447 | 14 37 38.3 | 15 00 23 | 12.39 | 387.0 | |
| VV 340 | 14 57 00.4 | 24 36 44 | 11.74 | 157.0 | UGC 09618, Arp 302 |
| CGCG 049-057 | 15 13 13.1 | 07 13 32 | 11.35 | 65.4 | |
| VV 705 | 15 18 06.3 | 42 44 37 | 11.92 | 183.0 | Mrk 0848, I Zw 107 |
| IRAS F15250+3608 | 15 26 59.4 | 35 58 38 | 12.08 | 254.0 | |
| UGC 09913 | 15 34 57.1 | 23 30 11 | 12.28 | 87.9 | Arp 220, VV 540 |
| NGC 6090 | 16 11 40.7 | 52 27 24 | 11.58 | 137.0 | UGC 10267, VV 626, Mrk 0496, I Zw 135 |
| CGCG 052-037 | 16 30 56.5 | 04 04 58 | 11.45 | 116.0 | |
| NGC 6285/6 | 16 58 27.8 | 58 56 48 | 11.37 | 85.7 | Arp 293 |
| IRAS F17132+5313 | 17 14 20.0 | 53 10 30 | 11.96 | 232.0 | |
| ESO 602-G025 | 22 31 25.5 | 19 02 04 | 11.34 | 110.0 | |
| IRAS F22491-1808 | 22 51 49.2 | 17 52 23 | 12.20 | 351.0 | |
| NGC 7469/IC 5283 | 23 03 16.9 | 08 53 01 | 11.65 | 70.8 | Arp 298, UGC 12332 |
| CGCG 453-062 | 23 04 56.5 | 19 33 08 | 11.38 | 109.0 | |
| IC 5298 | 23 16 00.7 | 25 33 24 | 11.60 | 119.0 | |
| NGC 7592 | 23 18 22.2 | 04 25 01 | 11.40 | 106.0 | VV 731 |
| NGC 7674 | 23 27 57.8 | 08 46 51 | 11.56 | 125.0 | UGC 12608, Arp 182, VV 343, Mrk 0533 |
| NGC 7770/1 | 23 51 24.9 | 20 06 43 | 11.40 | 61.2 | UGC 12815, Mrk 9006 |
| MRK 0331 | 23 51 26.8 | 20 35 10 | 11.50 | 70.5 |
Note. — The column indicates infrared luminosities based on IRAS measurements only.
| Telescope | No. Obj. | Bands | Reference |
|---|---|---|---|
| 22 | 0.5-2keV, 2-10keV | Iwasawa et al. (2011) | |
| 57 | Howell et al. (2010) | ||
| UH2.2m | 64 | Ishida (2004) | |
| UH2.2m | 8 | Surace et al. (1998, 2000); Surace & Sanders (2000) | |
| UH2.2m | 46 | Mazzerella et al., in prep. | |
| 2MASS | 64 | Skrutskie et al. (2006); Jarrett et al. (2003) | |
| 64 | 3.6,4.5,5.8,8.0,24,70,160 m | Mazzarella et al., in prep. | |
| 64 | 12, 25, 60, 100 m | Sanders et al. (2003) | |
| JCMT/SCUBA | 42 | 450, 850 m | Dunne et al. (2000); Dunne & Eales (2001) |
| VLA | 64 | 1.49, 4.85 GHz | Condon et al. (1990, 1996) |
| RBGS Name | Exp. Time | Filter | Seeing | Obs. Date |
|---|---|---|---|---|
| (sec) | (Johnson) | (arcsec) | (UT) | |
| CGCG 436-030 | 180 | 2008/09/01 | ||
| IRAS F01364-1042 | 360 | 2008/08/28 | ||
| NGC 0695 | 180 | 2008/09/01 | ||
| IRAS F05189-2524 | 180 | 2008/09/01 | ||
| 180 | 2008/09/01 | |||
| IRAS F08572+3915 | 180 | 2008/02/15 | ||
| IRAS F10565+2448 | 330 | 2008/02/18-19 | ||
| 180 | 2008/02/18 | |||
| IRAS F12112+0305 | 180 | 2008/02/19 | ||
| UGC 08058 | 120 | 2008/02/16 | ||
| UGC 08696 | 120 | 2008/02/17 | ||
| IRAS F14348-1447 | 180 | 2008/02/15 | ||
| IRAS F22491-1808 | 180 | 2008/08/28 |
| RBGS Name | ||||||||||||
|---|---|---|---|---|---|---|---|---|---|---|---|---|
| 2-10 KeV | 0.5-2 KeV | 152.8 Å | 227.1 Å | 3655 Å | 4582 Å | 5377 Å | 6484 Å | 8570 Å | 1.241 m | 1.651 m | 2.165 m | |
| (2) | (3) | (4) | (5) | (6) | (7) | (8) | (9) | (10) | (11) | (12) | (13) | |
| NGC 0034 | 1.586E-08a | 2.318E-08a | 5.249E-04 | 1.262E-03 | … | 1.076E-02 | 1.629E-02 | 1.740E-02 | 2.679E-02 | 5.225E-02 | 6.529E-02 | 6.557E-02 |
| (…) | (…) | (6.480E-05) | (7.126E-05) | (…) | (5.949E-04) | (9.004E-04) | (1.122E-03) | (1.481E-03) | (1.357E-04) | (2.097E-04) | (1.783E-04) | |
| MCG -02-01-051/2 | … | … | 2.255E-03 | 3.279E-03 | … | 1.028E-02 | 1.368E-02 | … | 2.032E-02 | 3.552E-02 | 3.808E-02 | 3.247E-02 |
| (…) | (…) | (2.784E-04) | (1.851E-04) | (…) | (1.136E-03) | (1.512E-03) | (…) | (2.246E-03) | (1.287E-04) | (3.044E-04) | (2.060E-04) | |
| NGC 0232 | … | … | 2.038E-04 | 3.880E-04 | … | 1.535E-02 | 3.071E-02 | 1.461E-02 | 6.925E-02 | 6.128E-02 | 8.037E-02 | 7.487E-02 |
| (…) | (…) | (1.538E-05) | (1.637E-05) | (…) | (2.097E-03) | (2.220E-03) | (9.417E-04) | (1.148E-02) | (9.594E-04) | (1.480E-03) | (1.448E-03) | |
| IC 1623A/B | … | … | 5.624E-03 | 7.898E-03 | … | 1.871E-02 | 2.489E-02 | 3.569E-02 | 3.467E-02 | 6.292E-02 | 7.755E-02 | 7.716E-02 |
| (…) | (…) | (6.942E-04) | (4.459E-04) | (…) | (1.034E-03) | (1.375E-03) | (2.301E-03) | (1.916E-03) | (1.304E-04) | (1.906E-04) | (1.958E-04) | |
| MCG -03-04-014 | … | … | 2.402E-04 | 5.692E-04 | … | 4.093E-03 | 6.792E-03 | 8.801E-03 | 1.169E-02 | 3.336E-02 | 4.045E-02 | 3.829E-02 |
| (…) | (…) | (2.965E-05) | (3.213E-05) | (…) | (2.639E-04) | (4.379E-04) | (5.674E-04) | (6.463E-04) | (1.085E-04) | (1.456E-04) | (1.494E-04) | |
| CGCG 436-030 | … | … | 4.304E-04 | 7.831E-04 | … | 4.130E-03 | 6.310E-03 | 8.075E-03 | 1.019E-02 | 1.702E-02 | 2.365E-02 | 2.286E-02 |
| (…) | (…) | (5.313E-05) | (4.421E-05) | (…) | (3.424E-04) | (4.649E-04) | (1.487E-03) | (2.064E-03) | (9.198E-05) | (1.101E-04) | (1.610E-04) | |
| IRAS F01364-1042 | 1.961E-09 | 1.506E-09 | 2.456E-05 | 5.314E-05 | 4.786E-05 | 5.989E-04 | 1.223E-03 | 9.056E-04 | 2.239E-03 | 6.269E-03 | 7.249E-03 | 8.223E-03 |
| (…) | (…) | (2.738E-06) | (2.811E-06) | (2.047E-05) | (7.347E-05) | (8.546E-05) | (5.839E-05) | (3.013E-04) | (5.634E-05) | (7.102E-05) | (7.910E-05) | |
| III Zw 035 | … | … | 5.246E-05 | 1.132E-04 | … | 1.570E-03 | 2.911E-03 | 2.111E-03 | 5.495E-03 | 1.176E-02 | 1.484E-02 | 1.485E-02 |
| (…) | (…) | (6.476E-06) | (6.390E-06) | (…) | (1.012E-04) | (1.877E-04) | (1.361E-04) | (6.074E-04) | (5.151E-05) | (6.033E-05) | (6.564E-05) | |
| NGC 0695 | … | … | 3.526E-04 | 7.967E-04 | … | 7.727E-03 | 1.343E-02 | 1.830E-02 | 2.655E-02 | 4.630E-02 | 5.962E-02 | 5.437E-02 |
| (…) | (…) | (4.352E-05) | (4.498E-05) | (…) | (7.828E-04) | (3.710E-04) | (3.370E-03) | (7.335E-04) | (1.001E-04) | (1.188E-04) | (1.226E-04) | |
| NGC 0958 | … | … | 1.084E-03a | 2.079E-03 | 1.959E-02 | 2.128E-02 | 3.837E-02 | … | 8.318E-02 | 1.798E-01 | 2.335E-01 | 2.013E-01 |
| (…) | (…) | (7.689E-06) | (6.549E-06) | (2.526E-03) | (1.176E-03) | (2.120E-03) | (…) | (3.830E-03) | (1.988E-03) | (3.226E-03) | (3.709E-03) | |
| UGC 02238 | … | … | 1.092E-04 | 2.096E-04 | … | 3.873E-03 | 7.311E-03 | … | 1.660E-02 | 3.430E-02 | 4.897E-02 | 5.267E-02 |
| (…) | (…) | (5.382E-06) | (4.912E-06) | (…) | (1.427E-04) | (2.020E-04) | (…) | (4.586E-04) | (8.845E-04) | (1.037E-03) | (1.407E-03) | |
| UGC 02369 | … | … | … | … | … | 5.058E-03 | 1.138E-02 | 1.344E-02 | 2.704E-02 | 5.274E-02 | 6.806E-02 | 6.325E-02 |
| (…) | (…) | (…) | (…) | (…) | (1.398E-04) | (2.096E-04) | (8.668E-04) | (1.245E-03) | (1.330E-04) | (2.199E-04) | (1.806E-04) | |
| IRAS F03359+1523 | … | … | 1.054E-04 | 1.905E-04 | … | 1.019E-03 | 1.770E-03 | … | 3.404E-03 | 7.850E-03 | 1.001E-02 | … |
| (…) | (…) | (1.302E-05) | (1.075E-05) | (…) | (8.443E-05) | (1.630E-04) | (…) | (2.195E-04) | (4.966E-05) | (5.567E-05) | (…) | |
| UGC 02982 | … | … | 3.468E-05 | 4.028E-05 | … | 1.690E-03 | 4.699E-03 | 9.651E-03 | 1.259E-02 | 5.635E-02 | 7.398E-02 | 7.920E-02 |
| (…) | (…) | (3.076E-05) | (1.637E-05) | (…) | (1.090E-04) | (1.731E-04) | (6.222E-04) | (4.638E-04) | (1.349E-03) | (1.976E-03) | (2.261E-03) | |
| ESO 550-IG025 | … | … | 1.992E-04 | 4.222E-04 | … | 3.873E-03 | 7.178E-03 | 7.187E-03 | 1.445E-02 | 3.564E-02 | 4.766E-02 | 3.978E-02 |
| (…) | (…) | (2.459E-05) | (2.384E-05) | (…) | (2.140E-04) | (3.967E-04) | (4.634E-04) | (7.988E-04) | (1.120E-04) | (3.408E-04) | (1.785E-04) | |
| NGC 1614 | … | … | … | … | 1.307E-02a | 1.330E-02 | 2.188E-02 | 3.255E-02a | 4.246E-02 | 9.204E-02 | 1.173E-01 | 1.127E-01 |
| (…) | (…) | (…) | (…) | (1.686E-04) | (9.803E-04) | (1.209E-03) | (5.996E-04) | (2.347E-03) | (1.678E-04) | (2.079E-04) | (2.372E-04) | |
| IRAS F05189-2524 | 2.143E-07 | 2.691E-08 | 8.816E-05 | 2.079E-04 | 1.905E-03b | 2.291E-03b | 2.589E-03 | 5.065E-03 | 7.805E-03 | 1.698E-02 | 2.655E-02 | 4.770E-02 |
| (…) | (…) | (1.088E-05) | (1.174E-05) | (3.510E-04) | (4.220E-04) | (4.770E-04) | (3.265E-04) | (3.595E-03) | (8.018E-05) | (1.383E-04) | (1.273E-04) | |
| NGC 2623 | … | … | 3.904E-04 | 7.948E-04 | 5.592E-03a | 7.656E-03 | 1.282E-02 | 1.797E-02a | 2.188E-02 | 3.795E-02 | 5.127E-02 | 4.667E-02 |
| (…) | (…) | (4.820E-05) | (4.487E-05) | (1.082E-04) | (2.115E-04) | (3.543E-04) | (3.476E-04) | (4.030E-04) | (1.127E-04) | (2.758E-04) | (1.670E-04) | |
| IRAS F08572+3915 | 1.654E-09 | 3.177E-09 | 8.223E-05 | 1.269E-04 | 6.918E-04b | 6.710E-04b | 8.158E-04 | 9.651E-04 | 1.710E-03a | 3.113E-03 | 3.342E-03 | 4.581E-03 |
| (…) | (…) | (1.015E-05) | (7.164E-06) | (1.274E-04) | (1.233E-05) | (2.254E-04) | (6.222E-05) | (1.353E-05) | (3.883E-05) | (5.757E-05) | (5.571E-05) | |
| UGC 04881 | 9.824E-10 | 4.542E-09 | 2.150E-04 | 4.792E-04 | … | 4.325E-03 | 7.586E-03 | … | 1.486E-02 | 3.011E-02 | 3.465E-02 | 3.689E-02 |
| (…) | (…) | (2.654E-05) | (2.705E-05) | (…) | (2.390E-04) | (4.891E-04) | (…) | (8.212E-04) | (1.041E-04) | (1.203E-04) | (1.406E-04) | |
| UGC 05101 | 8.647E-09 | 6.183E-09 | 5.977E-05 | 1.800E-04 | 1.586E-03a | 2.874E-03a | 5.124E-03a | 1.434E-02 | 1.0547E-02a | 2.233E-02 | 3.087E-02 | 3.960E-02 |
| (…) | (…) | (7.378E-06) | (1.016E-05) | (5.990E-05) | (4.9097E-05) | (1.463E-04) | (9.245E-04) | (9.7144E-05) | (9.444E-05) | (1.312E-04) | (1.357E-04) | |
| MCG +08-18-013 | … | … | 7.505E-04 | 1.063E-03 | … | 5.808E-03 | 8.954E-03 | … | 1.675E-02 | 2.152E-03 | 3.133E-03 | 2.288E-03 |
| (…) | (…) | (3.076E-05) | (1.637E-05) | (…) | (5.349E-04) | (6.597E-04) | (…) | (1.388E-03) | (2.696E-04) | (4.414E-04) | (4.342E-04) | |
| IC 0563/4 | … | … | 3.575E-04 | 6.942E-04 | … | 1.247E-02 | 2.148E-02 | 3.1685E-02 | 4.571E-02 | 8.131E-02 | 1.042E-01 | 9.629E-02 |
| (…) | (…) | (2.307E-05) | (1.637E-05) | (…) | (8.042E-04) | (1.187E-03) | (5.837E-04) | (2.526E-03) | (3.162E-04) | (4.702E-04) | (3.714E-04) | |
| NGC 3110 | … | … | 1.384E-03 | 2.734E-03 | … | 1.794E-02 | 2.731E-02 | 1.517E-02a | 5.077E-02 | 9.130E-02 | 1.142E-01 | 1.031E-01 |
| (…) | (…) | (4.613E-05) | (3.275E-05) | (…) | (3.605E-03) | (3.018E-03) | (1.397E-03) | (5.423E-03) | (1.850E-03) | (2.418E-03) | (2.943E-03) | |
| IRAS F10173+0828 | 7.582E-11 | 6.067E-10 | 1.678E-06 | 8.517E-06 | … | 4.406E-04 | 1.009E-03 | 2.758E-03 | 2.249E-03 | 3.817E-03 | 4.703E-03 | 3.315E-03 |
| (…) | (…) | (2.072E-07) | (4.809E-07) | (…) | (2.840E-05) | (5.577E-05) | (1.778E-04) | (1.036E-04) | (4.416E-05) | (5.791E-05) | (6.045E-05) | |
| IRAS F10565+2448 | 2.376E-09 | 8.557E-09 | … | … | 2.160E-03 | 3.862E-03a | 5.541E-03 | 8.483E-03 | 1.319E-02a | 1.949E-02 | 2.313E-02 | 2.584E-02 |
| (…) | (…) | (…) | (…) | (5.968E-04) | (1.067E-03) | (1.531E-03) | (5.469E-04) | (3.646E-03) | (9.129E-05) | (1.236E-04) | (1.211E-04) | |
| MCG +07-23-019 | … | … | 4.708E-04 | 7.601E-04 | … | 5.861E-03 | 8.472E-03 | 8.801E-03 | 1.542E-02 | 1.508E-02 | 1.931E-02 | 1.971E-02 |
| (…) | (…) | (5.812E-05) | (4.291E-05) | (…) | (3.239E-04) | (4.682E-04) | (5.674E-04) | (8.520E-04) | (6.866E-05) | (1.031E-04) | (8.964E-05) | |
| CGCG 011-076 | … | … | 4.537E-05 | 1.541E-04 | … | 3.311E-03 | 7.112E-03 | 9.921E-03 | 1.871E-02 | 3.645E-02 | 4.807E-02 | 4.524E-02 |
| (…) | (…) | (7.689E-06) | (9.824E-06) | (…) | (1.220E-04) | (1.965E-04) | (6.396E-04) | (5.169E-04) | (6.378E-04) | (9.741E-04) | (1.208E-03) | |
| IC 2810 | … | … | 1.164E-04 | 3.110E-04 | … | 4.325E-03 | 9.036E-03 | 2.151E-02 | 1.837E-02 | 3.454E-02 | 4.451E-02 | 3.866E-02 |
| (…) | (…) | (1.437E-05) | (1.756E-05) | (…) | (5.179E-04) | (1.082E-03) | (1.387E-03) | (2.030E-03) | (8.969E-05) | (1.505E-04) | (1.220E-04) | |
| NGC 3690/IC 694 | 5.830E-08 | 2.047E-07 | 8.798E-03 | 1.373E-02 | … | 4.966E-02 | 7.244E-02 | 7.056E-02 | 1.294E-01 | 2.170E-01 | 3.064E-01 | 2.810E-01 |
| (…) | (…) | (1.086E-03) | (7.750E-04) | (…) | (9.148E-04) | (1.334E-03) | (4.549E-03) | (2.384E-03) | (2.525E-04) | (3.995E-04) | (3.149E-04) | |
| IRAS F12112+0305 | 1.994E-09 | 3.112E-09 | … | … | 8.318E-04b | 8.250E-04b | 1.133E-03 | 2.211E-03 | 2.398E-03b | 4.835E-03 | 5.941E-03 | 5.278E-03 |
| (…) | (…) | (…) | (…) | (1.532E-04) | (1.520E-05) | (3.132E-04) | (1.425E-04) | (2.398E-05) | (5.406E-05) | (6.844E-05) | (8.116E-05) | |
| IRAS F12224-0624 | … | … | … | … | … | 8.166E-04 | 1.660E-03 | 3.024E-03 | 3.162E-03 | 5.045E-03 | 6.431E-03 | 5.474E-03 |
| (…) | (…) | (…) | (…) | (…) | (4.513E-05) | (7.643E-05) | (1.950E-04) | (1.165E-04) | (4.507E-04) | (4.620E-04) | (5.950E-04) | |
| UGC 08058 | 4.691E-08 | 2.928E-08 | … | … | 7.586E-03b | 1.202E-02b | 1.282E-02a | 1.616E-02 | 2.585E-02 | 6.412E-02 | 1.147E-01 | 1.991E-01 |
| (…) | (…) | (…) | (…) | (1.397E-03) | (2.215E-03) | (2.008E-03) | (1.042E-03) | (1.190E-02) | (1.214E-04) | (1.747E-04) | (1.944E-04) | |
| NGC 4922 | … | … | 1.076E-04 | 3.586E-04 | … | 1.213E-02 | 2.377E-02 | … | 1.038E-01 | 7.266E-02 | 9.356E-02 | 7.761E-02 |
| (…) | (…) | (3.845E-06) | (3.275E-06) | (…) | (4.470E-04) | (8.757E-04) | (…) | (2.867E-03) | (1.205E-03) | (1.982E-03) | (1.859E-03) | |
| ESO 507-G070 | … | … | 1.360E-04 | 2.331E-04 | … | 4.571E-03 | 9.204E-03 | 1.558E-02a | 2.148E-02 | 4.512E-02 | 6.025E-02 | 5.426E-02 |
| (…) | (…) | (1.679E-05) | (1.316E-05) | (…) | (3.368E-04) | (5.087E-04) | (1.291E-03) | (1.187E-03) | (1.472E-04) | (2.671E-04) | (2.081E-04) | |
| IC 0860 | … | … | … | … | … | 6.368E-03 | 1.180E-02 | 1.740E-02 | 2.228E-02 | 3.778E-02 | 4.856E-02 | 3.865E-02 |
| (…) | (…) | (…) | (…) | (…) | (1.760E-04) | (3.261E-04) | (1.122E-03) | (4.105E-04) | (6.264E-04) | (8.946E-04) | (9.967E-04) | |
| VV 250a | 8.933E-09 | 1.825E-08 | 6.253E-04 | 1.051E-03 | … | 6.310E-03 | 8.954E-03 | … | 1.486E-02 | 2.408E-02 | 3.223E-02 | … |
| (…) | (…) | (7.719E-05) | (5.931E-05) | (…) | (5.811E-04) | (6.597E-04) | (…) | (8.212E-04) | (8.872E-05) | (1.484E-04) | (…) | |
| UGC 08387 | 3.049E-09 | 1.235-08 | 3.117E-04 | 6.781E-04 | … | 6.792E-03 | 9.908E-03 | 1.068E-02 | 1.941E-02 | 3.084E-02 | 3.846E-02 | 3.581E-02 |
| (…) | (…) | (3.847E-05) | (3.829E-05) | (…) | (3.128E-04) | (2.738E-04) | (6.885E-04) | (5.363E-04) | (1.035E-04) | (1.231E-04) | (1.431E-04) | |
| NGC 5104 | … | … | 2.284E-04 | 4.732E-04 | … | 7.727E-03 | 1.500E-02 | … | 3.631E-02 | 7.153E-02 | 8.935E-02 | 8.440E-02 |
| (…) | (…) | (1.538E-05) | (1.637E-05) | (…) | (2.135E-04) | (4.144E-04) | (…) | (1.003E-03) | (1.976E-03) | (2.963E-03) | (2.177E-03) | |
| MCG -03-34-064 | 1.448E-07a | 1.192E-07a | 2.337E-04 | 4.011E-04 | … | 1.330E-02 | 2.704E-02 | … | 5.702E-02 | 7.650E-02 | 9.689E-02 | 8.401E-02 |
| (…) | (…) | (2.307E-05) | (1.637E-05) | (…) | (1.470E-03) | (2.989E-03) | (…) | (6.302E-03) | (1.409E-03) | (1.785E-03) | (2.089E-03) | |
| NGC 5135 | 3.840E-08a | 1.775E-07a | 1.384E-03 | 3.209E-03 | 2.070E-02a | 2.858E-02 | 5.445E-02 | … | 1.202E-01 | 1.797E-01 | 2.615E-01 | 1.959E-01 |
| (…) | (…) | (4.613E-05) | (3.275E-05) | (2.669E-03) | (7.896E-04) | (1.505E-03) | (…) | (2.215E-03) | (3.641E-03) | (5.058E-03) | (5.772E-03) | |
| NGC 5256 | 2.483E-08a | 9.934E-09a | 8.090E-04 | 1.419E-03 | … | 1.038E-02 | 1.871E-02 | 2.538E-02a | 3.311E-02 | 5.266E-02 | 6.512E-02 | 6.266E-02 |
| (…) | (…) | (9.987E-05) | (8.014E-05) | (…) | (1.911E-04) | (3.446E-04) | (4.676E-04) | (6.100E-04) | (1.486E-04) | (2.356E-04) | (2.117E-04) | |
| NGC 5257/8 | … | … | 3.319E-03 | 5.743E-03 | … | 2.679E-02 | 4.325E-02 | 5.978E-02 | 7.447E-02 | 1.314E-01 | 1.680E-01 | 1.477E-01 |
| (…) | (…) | (4.097E-04) | (3.243E-04) | (…) | (2.961E-03) | (4.780E-03) | (3.854E-03) | (8.231E-03) | (2.502E-04) | (3.197E-04) | (3.580E-04) | |
| UGC 08696 | 4.815E-08 | 2.866E-07 | 2.039E-04 | 4.057E-04 | 3.020E-03b | 5.297E-03b | 9.036E-03 | 9.301E-03 | 1.380E-02b | 3.042E-02 | 3.385E-02 | 3.581E-02 |
| (…) | (…) | (2.517E-05) | (2.291E-05) | (5.563E-04) | (3.415E-04) | (2.497E-03) | (5.997E-04) | (8.900E-04) | (1.055E-04) | (1.462E-04) | (1.410E-04) | |
| CGCG 247-020 | … | … | 3.591E-05 | 5.878E-05 | … | 1.941E-03 | 3.664E-03 | … | 7.727E-03 | 1.518E-02 | 2.097E-02 | 2.010E-02 |
| (…) | (…) | (1.538E-05) | (1.146E-05) | (…) | (7.150E-05) | (4.388E-04) | (…) | (7.828E-04) | (4.754E-04) | (7.145E-04) | (8.144E-04) | |
| IRAS F14348-1447 | 2.886E-09 | 5.359E-09 | 6.417E-05 | 1.288E-04 | 5.754E-04b | 7.922E-04b | 1.265E-03 | 2.424E-03 | 3.217E-03b | 5.621E-03 | 7.847E-03 | 9.000E-03 |
| (…) | (…) | (7.921E-06) | (7.274E-06) | (1.060E-04) | (1.678E-05) | (3.495E-04) | (1.563E-04) | (5.926E-05) | (5.092E-05) | (7.111E-05) | (8.989E-05) | |
| VV 340a | 7.015E-09 | 1.684E-08 | 4.185E-04 | 7.972E-04 | … | 7.112E-03 | 1.406E-02 | 1.369E-02 | 2.679E-02 | 6.066E-02 | 9.391E-02 | 7.571E-02 |
| (…) | (…) | (5.166E-05) | (4.501E-05) | (…) | (7.861E-04) | (1.554E-03) | (8.829E-04) | (2.961E-03) | (1.117E-04) | (2.595E-04) | (2.092E-04) | |
| CGCG 049-057 | … | … | 6.051E-05 | 1.524E-04 | … | 2.228E-03 | 4.786E-03 | … | 1.086E-02 | 2.140E-02 | 2.875E-02 | 2.366E-02 |
| (…) | (…) | (1.538E-06) | (1.474E-05) | (…) | (8.210E-05) | (1.763E-04) | (…) | (3.002E-04) | (6.703E-04) | (8.210E-04) | (1.002E-03) | |
| VV 705 | 1.308E-09 | 9.917E-09 | 3.411E-04 | 6.693E-04 | … | 4.325E-03 | 6.368E-03 | 9.651E-03 | 1.247E-02 | 1.907E-02 | 2.473E-02 | 2.244E-02 |
| (…) | (…) | (4.210E-05) | (3.779E-05) | (…) | (1.992E-04) | (1.760E-04) | (6.222E-04) | (3.447E-04) | (8.558E-05) | (1.259E-04) | (1.190E-04) | |
| IRAS F15250+3608 | 4.020E-10 | 2.660E-09 | … | … | 1.096E-03b | 1.247E-03 | 1.905E-03 | 2.707E-03 | 2.606E-03 | 5.308E-03 | 7.152E-03 | 6.044E-03 |
| (…) | (…) | (…) | (…) | (2.020E-04) | (5.744E-05) | (8.775E-05) | (1.746E-04) | (3.529E-04) | (4.821E-05) | (7.816E-05) | (7.617E-05) | |
| UGC 09913 | 5.073E-09 | 7.164E-09 | 1.313E-04 | 4.371E-04 | 6.076E-03a | 9.272E-03b | 1.893E-02a | 2.131E-02 | 3.619E-02b | 7.260E-02 | 8.793E-02 | 9.187E-02 |
| (…) | (…) | (1.620E-05) | (2.468E-05) | (1.287E-04) | (1.708E-04) | (3.261E-04) | (1.374E-03) | (3.333E-04) | (1.669E-04) | (2.400E-04) | (2.459E-04) | |
| NGC 6090 | … | … | 1.094E-03 | 1.915E-03 | … | 7.379E-03 | 1.057E-02 | 1.789E-02 | 1.820E-02 | 2.933E-02 | 3.433E-02 | 3.492E-02 |
| (…) | (…) | (1.350E-04) | (1.081E-04) | (…) | (6.796E-04) | (5.840E-04) | (1.153E-03) | (5.028E-04) | (1.180E-04) | (1.637E-04) | (1.673E-04) | |
| CGCG 052-037 | … | … | 1.192E-04 | 3.029E-04 | … | 4.966E-03 | 8.790E-03 | 1.344E-02 | 1.854E-02 | 3.655E-02 | 4.583E-02 | 4.516E-02 |
| (…) | (…) | (1.538E-05) | (1.474E-05) | (…) | (1.372E-04) | (3.238E-04) | (8.668E-04) | (5.121E-04) | (7.069E-04) | (1.266E-04) | (1.206E-03) | |
| NGC 6286 | … | … | 5.628E-04 | 1.058E-03 | … | 1.542E-02 | 2.443E-02 | 6.260E-02 | 5.058E-02 | 5.687E-02 | 8.224E-02 | 8.301E-02 |
| (…) | (…) | (2.307E-05) | (1.637E-05) | (…) | (1.988E-03) | (3.151E-03) | (4.036E-03) | (6.056E-03) | (8.381E-04) | (1.363E-03) | (3.364E-03) | |
| IRAS F17132+5313 | 9.210E-10 | 4.268E-09 | 3.538E-05 | 9.769E-05 | … | 7.311E-04 | 1.486E-03 | 2.941E-03 | 2.679E-03 | 1.168E-02 | 1.593E-02 | 1.576E-02 |
| (…) | (…) | (4.367E-06) | (5.515E-06) | (…) | (3.367E-05) | (5.474E-05) | (1.896E-04) | (9.870E-05) | (5.672E-05) | (7.121E-05) | (7.730E-05) | |
| ESO 602-G025 | … | … | 2.791E-04 | 5.534E-04 | … | 6.668E-03 | 1.159E-02 | 1.772E-02 | 2.400E-02 | 4.930E-02 | 6.419E-02 | 5.785E-02 |
| (…) | (…) | (3.076E-05) | (3.275E-05) | (…) | (1.842E-04) | (3.202E-04) | (1.143E-03) | (1.547E-03) | (1.135E-03) | (1.774E-03) | (1.865E-03) | |
| IRAS F22491-1808 | 2.807E-10 | 2.920E-09 | 1.673E-04 | 2.348E-04 | 4.365E-04b | 9.543E-04b | 8.551E-04 | 2.131E-03 | 2.399E-03b | 3.972E-03 | 4.923E-03 | 4.808E-03 |
| (…) | (…) | (2.066E-05) | (1.326E-05) | (8.041E-05) | (1.758E-05) | (1.575E-04) | (1.374E-04) | (1.547E-04) | (3.651E-05) | (5.112E-05) | (5.686E-05) | |
| NGC 7469 | 1.906E-06a | … | 4.322E-03 | 5.948E-03 | 3.020E-02b | 2.890E-02 | 4.713E-02 | 6.202E-02 | 9.290E-02 | 1.915E-01 | 2.369E-01 | 2.356E-01 |
| (…) | (…) | (5.335E-04) | (3.358E-04) | (5.563E-03) | (1.863E-03) | (2.605E-03) | (3.999E-03) | (3.422E-03) | (2.486E-04) | (3.390E-04) | (3.269E-04) | |
| CGCG 453-062 | … | … | 5.774E-05 | 2.112E-04 | … | 3.436E-03 | 6.427E-03 | … | 1.330E-02 | 3.219E-02 | 4.111E-02 | 3.861E-02 |
| (…) | (…) | (1.538E-05) | (1.474E-05) | (…) | (1.266E-04) | (1.776E-04) | (…) | (3.676E-04) | (6.522E-04) | (8.708E-04) | (1.174E-03) | |
| IC 5298 | … | … | 1.220E-04 | 2.934E-04 | … | 3.597E-03 | 8.166E-03 | 1.182E-02 | 1.854E-02 | 3.481E-02 | 4.963E-02 | 4.860E-02 |
| (…) | (…) | (1.506E-05) | (1.656E-05) | (…) | (1.325E-04) | (2.256E-04) | (7.619E-04) | (6.829E-04) | (1.130E-04) | (1.563E-04) | (1.678E-04) | |
| NGC 7592 | … | … | 1.784E-03 | 2.259E-03 | … | 9.638E-03 | 1.393E-02 | 1.926E-02 | 2.606E-02 | 4.509E-02 | 5.325E-02 | 3.351E-02 |
| (…) | (…) | (4.613E-05) | (3.275E-05) | (…) | (3.551E-04) | (3.849E-04) | (1.241E-03) | (7.201E-04) | (6.645E-04) | (1.275E-03) | (1.142E-03) | |
| NGC 7674 | 4.828E-08a | 7.430E-08a | 1.325E-03 | 1.937E-03 | 9.638E-03a | 1.228E-02 | 2.109E-02 | 3.196E-02 | 3.908E-02 | 7.315E-02 | 1.114E-01 | 8.746E-02 |
| (…) | (…) | (1.636E-04) | (1.094E-04) | (9.765E-04) | (6.783E-04) | (5.826E-04) | (2.060E-03) | (7.200E-04) | (1.672E-04) | (2.620E-04) | (2.150E-04) | |
| NGC 7770/1 | … | … | 2.607E-03 | 3.848E-03 | 1.419E-02a | 3.076E-02 | 6.194E-02 | 9.562E-02 | 1.486E-01 | 2.609E-01 | 3.335E-01 | 3.053E-01 |
| (…) | (…) | (6.151E-06) | (3.275E-06) | (1.307E-03) | (8.500E-04) | (1.141E-03) | (6.165E-03) | (2.737E-03) | (2.643E-03) | (4.300E-03) | (4.780E-03) | |
| MRK 0331 | … | 4.000E-08a | 6.128E-05 | 2.691E-04 | … | 5.740E-03 | 1.110E-02 | 1.732E-02 | 2.584E-02 | 6.500E-02 | 8.684E-02 | 8.355E-02 |
| (…) | (…) | (4.215E-06) | (8.629E-06) | (…) | (4.170E-04) | (8.060E-04) | (1.117E-03) | (7.650E-04) | (1.197E-04) | (1.600E-04) | (1.539E-04) |
Note. — The photometry values have been measured with a uniform mask for each object.
Exceptions in each column are marked by superscripted letters indicating literature or NED reference.
Columns (2-3) X-ray Chandra-ACIS photometry (Iwasawa et al., 2011)
Columns (4-5) NUV-FUV photometry measured from image data in Howell et al. (2010)
Column (6) UV photometry from Surace et al. (2000) and this paper
Column (7-8) B,V-band photometry from Ishida (2004); Surace et al. (1998); Surace & Sanders (2000)
Column (9) R-band photometry from Kim et al. (in preparation)
Column (10) I-band photometry from Ishida (2004); Surace et al. (1998); Surace & Sanders (2000)
Columns (11-13) photometry from 2MASS
a NED; b Surace et al. (1998, 2000); Surace & Sanders (2000)
| Object | IRAC1 | IRAC2 | IRAC3 | IRAC4 | IRAS1 | MIPS1 | IRAS2 | IRAS3 | MIPS2 | IRAS4 | MIPS3 | SCUBA1 | SCUBA2 | VLA1 | VLA2 |
|---|---|---|---|---|---|---|---|---|---|---|---|---|---|---|---|
| 3.6m | 4.5m | 5.8m | 8.0m | 12m | 24m | 25m | 60m | 70m | 100m | 160m | 450m | 850m | 4.85GHz | 1.49GHz | |
| (2) | (3) | (4) | (5) | (6) | (7) | (8) | (9) | (10) | (11) | (12) | (13) | (14) | (15) | (16) | |
| NGC 0034 | 0.050 | 0.053 | 0.119 | 0.314 | 0.350 | 1.999 | 2.390 | 17.050 | 13.285 | 16.860 | 12.867 | … | … | … | 0.061 |
| (0.005) | (0.005) | (0.005) | (0.005) | (0.032) | (0.100) | (0.055) | (0.045) | (1.993) | (0.135) | (3.860) | (…) | (…) | (…) | (0.001) | |
| MCG -02-01-051/2 | 0.040 | 0.029 | 0.081 | 0.225 | 0.280 | 1.120 | 1.200 | 7.480 | 7.472 | 9.660 | 9.120 | … | … | … | 0.041 |
| (0.004) | (0.003) | (0.004) | (0.004) | (0.034) | (0.056) | (0.055) | (0.048) | (1.121) | (0.138) | (2.736) | (…) | (…) | (…) | (0.001) | |
| NGC 0232 | 0.098 | 0.071 | 0.129 | 0.276 | 0.360 | 1.223 | 1.280 | 10.050 | 12.341 | 17.140 | 16.965 | … | … | … | 0.052 |
| (0.010) | (0.007) | (0.010) | (0.010) | (0.034) | (0.061) | (0.039) | (0.037) | (1.851) | (0.094) | (5.090) | (…) | (…) | (…) | (0.001) | |
| IC 1623A/B | 0.092 | 0.099 | 0.241 | 0.542 | 1.030 | 3.014 | 3.650 | 22.930 | … | 31.550 | … | … | … | 0.096 | 0.221 |
| (0.009) | (0.010) | (0.009) | (0.009) | (0.030) | (0.151) | (0.050) | (0.062) | (…) | (0.113) | (…) | (…) | (…) | (0.012) | (0.001) | |
| MCG -03-04-014 | 0.032 | 0.023 | 0.072 | 0.209 | 0.340 | 0.742 | 0.900 | 7.250 | 7.440 | 10.330 | 9.626 | … | … | … | 0.040 |
| (0.003) | (0.002) | (0.003) | (0.003) | (0.043) | (0.037) | (0.036) | (0.060) | (1.116) | (0.136) | (2.888) | (…) | (…) | (…) | (0.001) | |
| CGCG 436-030 | 0.044 | 0.039 | 0.080 | 0.174 | 0.210 | 1.230 | 1.540 | 10.710 | 8.711 | 9.670 | 6.828 | … | 0.039 | … | 0.049 |
| (0.004) | (0.004) | (0.004) | (0.004) | (0.043) | (0.062) | (0.048) | (0.038) | (1.307) | (0.188) | (2.048) | (…) | (0.008) | (…) | (0.001) | |
| IRAS F01364-1042 | 0.003 | 0.004 | 0.007 | 0.021 | 0.16 | 0.255 | 0.440 | 6.620 | 5.986 | 6.880 | 3.660 | … | … | 0.012 | 0.015 |
| (0.000) | (0.000) | (0.000) | (0.000) | (…) | (0.013) | (0.036) | (0.042) | (0.898) | (0.114) | (1.098) | (…) | (…) | (…) | (0.001) | |
| III Zw 035 | 0.018 | 0.013 | 0.026 | 0.062 | 0.06 | 0.761 | 1.030 | 13.250 | 10.962 | 14.300 | 7.317 | … | 0.076 | … | 0.041 |
| (0.002) | (0.001) | (0.002) | (0.002) | (…) | (0.038) | (0.059) | (0.050) | (1.644) | (0.155) | (2.195) | (…) | (0.015) | (…) | (0.001) | |
| NGC 0695 | 0.058 | 0.042 | 0.125 | 0.362 | 0.500 | 0.722 | 0.830 | 7.590 | 8.828 | 13.560 | 11.200 | … | 0.136 | … | 0.066 |
| (0.006) | (0.004) | (0.006) | (0.006) | (0.023) | (0.036) | (0.041) | (0.031) | (1.324) | (0.167) | (3.360) | (…) | (0.021) | (…) | (0.001) | |
| NGC 0958 | 0.128 | 0.082 | 0.189 | 0.421 | 0.620 | 0.516 | 0.940 | 5.850 | 7.846 | 15.080 | 19.138 | 2.251 | 0.262 | … | 0.058 |
| (0.013) | (0.008) | (0.013) | (0.013) | (0.030) | (0.026) | (0.035) | (0.040) | (1.177) | (0.198) | (5.741) | (0.428) | (0.034) | (…) | (0.001) | |
| UGC 02238 | 0.050 | 0.038 | 0.142 | 0.383 | 0.360 | 0.524 | 0.650 | 8.170 | 9.526 | 15.670 | 13.240 | … | 0.104 | … | 0.067 |
| (0.005) | (0.004) | (0.005) | (0.005) | (0.030) | (0.026) | (0.042) | (0.036) | (1.429) | (0.128) | (3.972) | (…) | (0.014) | (…) | (0.001) | |
| UGC 02369 | 0.042 | 0.030 | 0.063 | 0.149 | 0.230 | 1.160 | 1.880 | 8.070 | 7.823 | 11.180 | 8.717 | 0.523 | 0.072 | … | 0.050 |
| (0.004) | (0.003) | (0.004) | (0.004) | (0.022) | (0.058) | (0.042) | (0.043) | (1.173) | (0.190) | (2.615) | (0.120) | (0.013) | (…) | (0.001) | |
| IRAS F03359+1523 | 0.010 | 0.008 | 0.020 | 0.053 | 0.07 | 0.428 | 0.650 | 5.970 | 6.409 | 7.270 | 3.652 | … | 0.044 | … | 0.019 |
| (0.001) | (0.001) | (0.001) | (0.001) | (…) | (0.021) | (0.043) | (0.041) | (0.961) | (0.128) | (1.096) | (…) | (0.009) | (…) | (0.001) | |
| UGC 02982 | 0.076 | 0.053 | 0.186 | 0.481 | 0.570 | 0.673 | 0.830 | 8.390 | 9.862 | 16.820 | 15.831 | … | 0.176 | … | 0.082 |
| (0.008) | (0.005) | (0.008) | (0.008) | (0.014) | (0.034) | (0.019) | (0.043) | (1.479) | (0.287) | (4.749) | (…) | (0.034) | (…) | (0.001) | |
| ESO 550-IG025 | 0.029 | 0.021 | 0.045 | 0.131 | 0.220 | 0.392 | 0.510 | 5.690 | 6.456 | 9.470 | 7.724 | … | … | … | 0.038 |
| (0.003) | (0.002) | (0.003) | (0.003) | (0.024) | (0.020) | (0.034) | (0.030) | (0.968) | (0.115) | (2.317) | (…) | (…) | (…) | (0.001) | |
| NGC 1614 | 0.101 | 0.076 | 0.279 | 0.742 | 1.380 | 6.552 | 7.500 | 32.120 | 26.535 | 34.320 | 18.674 | 0.981 | 0.140 | 0.063 | 0.123 |
| (0.010) | (0.008) | (0.010) | (0.010) | (0.023) | (0.328) | (0.025) | (0.083) | (3.980) | (0.430) | (5.602) | (0.167) | (0.020) | (…) | (0.001) | |
| IRAS F05189-2524 | 0.100 | 0.129 | 0.227 | 0.290 | 0.740 | 2.546 | 3.470 | 13.250 | … | 11.840 | … | … | … | … | 0.028 |
| (0.010) | (0.013) | (0.010) | (0.010) | (0.016) | (0.127) | (0.018) | (0.029) | (…) | (0.077) | (…) | (…) | (…) | (…) | (0.001) | |
| NGC 2623 | 0.031 | 0.027 | 0.056 | 0.140 | 0.210 | 1.399 | 1.810 | 23.740 | 20.912 | 25.880 | 14.424 | … | 0.091 | 0.057 | 0.099 |
| (0.003) | (0.003) | (0.003) | (0.003) | (0.023) | (0.070) | (0.041) | (0.028) | (3.137) | (0.111) | (4.327) | (…) | (0.014) | (0.009) | (0.001) | |
| IRAS F08572+3915 | 0.041 | 0.101 | 0.297 | 0.314 | 0.330 | 1.444 | 1.760 | 7.300 | 5.613 | 4.770 | 2.442 | … | 0.017 | … | 0.005 |
| (0.004) | (0.004) | (0.004) | (0.004) | (0.031) | (0.072) | (0.033) | (0.028) | (0.842) | (0.152) | (0.733) | (…) | (0.007) | (…) | (0.001) | |
| UGC 04881 | 0.017 | 0.009 | 0.008 | 0.004 | 0.140 | 0.435 | 0.610 | 6.070 | 6.995 | 10.330 | 8.447 | … | 0.065 | … | 0.032 |
| (0.002) | (0.001) | (0.002) | (0.002) | (0.037) | (0.022) | (0.034) | (0.048) | (1.049) | (0.109) | (2.534) | (…) | (0.013) | (…) | (0.001) | |
| UGC 05101 | 0.046 | 0.078 | 0.096 | 0.144 | 0.250 | 0.808 | 1.020 | 11.680 | 13.195 | 19.910 | 13.393 | … | … | 0.076 | 0.150 |
| (0.005) | (0.008) | (0.005) | (0.005) | (0.027) | (0.040) | (0.027) | (0.034) | (1.979) | (0.137) | (4.018) | (…) | (…) | (0.011) | (0.001) | |
| MCG +08-18-013 | 0.024 | 0.017 | 0.047 | 0.126 | 0.100 | 0.587 | 0.750 | 5.680 | 7.316 | 8.420 | 6.722 | … | 0.042 | … | 0.022 |
| (0.002) | (0.002) | (0.002) | (0.002) | (0.019) | (0.029) | (0.028) | (0.028) | (1.097) | (0.143) | (2.017) | (…) | (0.010) | (…) | (0.001) | |
| IC 0563/4 | 0.069 | 0.046 | 0.123 | 0.307 | 0.460 | 0.490 | 0.540 | 5.260 | 7.237 | 12.180 | 18.104 | … | 0.228 | … | 0.060 |
| (0.007) | (0.005) | (0.007) | (0.007) | (0.021) | (0.025) | (0.039) | (0.026) | (1.086) | (0.058) | (5.431) | (…) | (0.035) | (…) | (0.001) | |
| NGC 3110 | 0.101 | 0.069 | 0.219 | 0.555 | 0.590 | 1.016 | 1.130 | 11.280 | 11.779 | 22.270 | 17.168 | … | 0.188 | … | 0.109 |
| (0.010) | (0.007) | (0.010) | (0.010) | (0.035) | (0.051) | (0.048) | (0.033) | (1.767) | (0.085) | (5.150) | (…) | (0.028) | (…) | (0.001) | |
| IRAS F10173+0828 | 0.011 | 0.006 | 0.013 | 0.014 | 0.190 | 0.276 | 0.550 | 5.610 | 5.241 | 5.860 | 3.264 | … | 0.036 | … | 0.009 |
| (0.001) | (0.001) | (0.001) | (0.001) | (0.029) | (0.014) | (0.049) | (0.025) | (0.786) | (0.100) | (0.979) | (…) | (0.006) | (…) | (0.001) | |
| IRAS F10565+2448 | 0.021 | 0.018 | 0.039 | 0.127 | 0.200 | 0.976 | 1.270 | 12.100 | 11.259 | 15.010 | 9.174 | 0.533 | 0.061 | … | 0.051 |
| (0.002) | (0.002) | (0.002) | (0.002) | (0.030) | (0.049) | (0.031) | (0.025) | (1.689) | (0.122) | (2.752) | (…) | (0.013) | (…) | (0.001) | |
| MCG +07-23-019 | 0.016 | 0.012 | 0.034 | 0.093 | 0.200 | 0.245 | 0.710 | 6.380 | 7.172 | 10.300 | 7.284 | 0.646 | 0.092 | … | 0.031 |
| (0.002) | (0.001) | (0.002) | (0.002) | (0.019) | (0.012) | (0.022) | (0.034) | (1.076) | (0.106) | (2.185) | (0.156) | (0.020) | (…) | (0.001) | |
| CGCG 011-076 | 0.040 | 0.034 | 0.075 | 0.192 | 0.480 | 0.680 | 0.760 | 5.850 | 6.328 | 9.180 | 8.364 | 0.571 | 0.084 | … | 0.032 |
| (0.004) | (0.003) | (0.004) | (0.004) | (0.039) | (0.034) | (0.050) | (0.057) | (0.949) | (0.253) | (2.509) | (0.166) | (0.013) | (…) | (0.001) | |
| IC 2810 | 0.026 | 0.019 | 0.047 | 0.113 | 0.140 | 0.492 | 0.620 | 6.200 | 8.771 | 10.390 | 12.389 | … | 0.106 | … | 0.026 |
| (0.003) | (0.002) | (0.003) | (0.003) | (0.034) | (0.025) | (0.062) | (0.038) | (1.316) | (0.136) | (3.717) | (…) | (0.018) | (…) | (0.001) | |
| NGC 3690/IC 694 | 0.313 | 0.340 | 1.049 | 2.157 | 3.970 | … | 24.510 | 113.050 | 79.355 | 111.420 | … | … | … | … | 0.658 |
| (0.031) | (0.034) | (0.031) | (0.031) | (0.020) | (…) | (0.031) | (0.052) | (11.903) | (0.133) | (…) | (…) | (…) | (…) | (0.001) | |
| IRAS F12112+0305 | 0.009 | 0.006 | 0.009 | 0.050 | 0.11 | 0.364 | 0.660 | 8.180 | … | 9.460 | … | 0.429 | 0.049 | … | 0.024 |
| (0.001) | (0.001) | (0.001) | (0.001) | (…) | (0.018) | (0.054) | (0.032) | (…) | (0.123) | (…) | (…) | (0.010) | (…) | (0.001) | |
| IRAS F12224-0624 | 0.007 | 0.004 | 0.008 | 0.016 | 0.11 | 0.159 | 0.200 | 5.990 | 5.832 | 8.130 | 4.798 | … | 0.074 | … | 0.009 |
| (0.001) | (0.000) | (0.001) | (0.001) | (…) | (0.008) | (0.044) | (0.044) | (0.875) | (0.139) | (1.439) | (…) | (0.015) | (…) | (0.001) | |
| UGC 08058 | 0.206 | 0.280 | 1.394 | 0.907 | 1.830 | 4.337 | 8.840 | 30.800 | … | 29.740 | … | … | … | 0.414 | 0.296 |
| (0.021) | (0.028) | (0.021) | (0.021) | (0.017) | (0.217) | (0.028) | (0.042) | (…) | (0.108) | (…) | (…) | (…) | (0.062) | (0.001) | |
| NGC 4922 | 0.059 | 0.051 | 0.068 | 0.132 | 0.270 | 1.171 | 1.480 | 6.210 | 5.740 | 7.330 | 5.256 | … | 0.053 | … | 0.038 |
| (0.006) | (0.005) | (0.006) | (0.006) | (0.035) | (0.059) | (0.030) | (0.040) | (0.861) | (0.093) | (1.577) | (…) | (0.012) | (…) | (0.001) | |
| ESO 507-G070 | 0.037 | 0.026 | 0.047 | 0.099 | 0.250 | 0.643 | 0.800 | 13.040 | 13.102 | 15.710 | 9.489 | … | … | … | 0.060c |
| (0.004) | (0.003) | (0.004) | (0.004) | (0.020) | (0.032) | (0.046) | (0.051) | (1.965) | (0.159) | (2.847) | (…) | ||||
| IC 0860 | 0.023 | 0.014 | 0.018 | 0.036 | 0.14 | 0.901 | 1.340 | 18.610 | 15.379 | 18.660 | 9.336 | … | 0.118 | … | 0.033 |
| (0.002) | (0.001) | (0.002) | (0.002) | (…) | (0.045) | (0.044) | (0.071) | (2.307) | (0.900) | (2.801) | (…) | (0.020) | (…) | (0.001) | |
| VV 250a | 0.033 | 0.026 | 0.085 | 0.213 | 0.350 | … | 1.950 | 11.390 | … | 12.410 | … | … | … | … | 0.050 |
| (0.003) | (0.003) | (0.003) | (0.003) | (0.022) | (…) | (0.020) | (0.035) | (…) | (0.093) | (…) | (…) | (…) | (…) | (0.001) | |
| UGC 08387 | 0.032 | 0.025 | 0.083 | 0.219 | 0.250 | 1.070 | 1.420 | 17.040 | 17.681 | 24.380 | 14.213 | … | 0.113 | 0.053 | 0.101 |
| (0.003) | (0.003) | (0.003) | (0.003) | (0.029) | (0.054) | (0.040) | (0.088) | (2.652) | (0.120) | (4.264) | (…) | (0.015) | (0.008) | (0.001) | |
| NGC 5104 | 0.055 | 0.038 | 0.076 | 0.179 | 0.390 | 0.554 | 0.740 | 6.780 | 7.461 | 13.370 | 11.508 | … | 0.091 | … | 0.035 |
| (0.006) | (0.004) | (0.006) | (0.006) | (0.034) | (0.028) | (0.091) | (0.049) | (1.119) | (0.103) | (3.452) | (…) | (0.020) | (…) | (0.001) | |
| MCG -03-34-064 | 0.093 | 0.105 | 0.214 | 0.328 | 0.940 | 2.253 | 2.970 | 6.200 | 1.292 | 6.200 | 2.499 | … | … | … | 0.267c |
| (0.009) | (0.011) | (0.009) | (0.009) | (0.040) | (0.113) | (0.045) | (0.040) | (0.194) | (0.143) | (0.750) | (…) | (…) | (…) | (…) | |
| NGC 5135 | 0.132 | 0.104 | 0.220 | 0.459 | 0.630 | … | 2.380 | 16.860 | … | 30.970 | 23.012 | … | … | … | 0.194c |
| (0.013) | (0.010) | (0.013) | (0.013) | (0.035) | (…) | (0.058) | (0.046) | (…) | (0.177) | (6.904) | (…) | (…) | (…) | (…) | |
| NGC 5256 | 0.043 | 0.033 | 0.067 | 0.161 | 0.320 | 0.873 | 1.070 | 7.250 | 7.746 | 10.110 | 7.021 | … | 0.082 | 0.047 | 0.113 |
| (0.004) | (0.003) | (0.004) | (0.004) | (0.018) | (0.044) | (0.028) | (0.033) | (1.162) | (0.135) | (2.106) | (…) | (0.017) | (0.007) | (0.001) | |
| NGC 5257/8 | 0.088 | 0.060 | 0.171 | 0.441 | 0.570 | 1.180 | 1.340 | 10.730 | 14.015 | 19.970 | 22.598 | … | 0.283 | … | 0.076 |
| (0.009) | (0.006) | (0.009) | (0.009) | (0.031) | (0.059) | (0.069) | (0.059) | (2.102) | (0.050) | (6.779) | (…) | (0.039) | (…) | (0.001) | |
| UGC 08696 | 0.032 | 0.039 | 0.073 | 0.143 | 0.240 | 1.864 | 2.360 | 22.510 | 20.206 | 22.530 | 11.661 | … | … | 0.099 | 0.143 |
| (0.003) | (0.004) | (0.003) | (0.003) | (0.017) | (0.093) | (0.021) | (0.042) | (3.031) | (0.070) | (3.498) | (…) | (…) | (0.015) | (0.001) | |
| CGCG 247-020 | 0.017 | 0.013 | 0.034 | 0.088 | 0.150 | 0.705 | 0.840 | 6.010 | 6.222 | 8.470 | 5.403 | 0.284 | 0.036 | … | 0.021 |
| (0.002) | (0.001) | (0.002) | (0.002) | (0.022) | (0.035) | (0.019) | (0.035) | (0.933) | (0.155) | (1.621) | (0.111) | (0.008) | (…) | (0.001) | |
| IRAS F14348-1447 | 0.012 | 0.011 | 0.011 | 0.049 | 0.10 | 0.393 | 0.550 | 6.820 | … | 7.310 | … | … | … | … | 0.037 |
| (0.001) | (0.001) | (0.001) | (0.001) | (…) | (0.020) | (0.062) | (0.040) | (…) | (0.151) | (…) | (…) | (…) | (…) | (0.001) | |
| VV 340a | 0.056 | 0.042 | 0.100 | 0.274 | 0.360 | 0.424 | 0.410 | 6.950 | 8.896 | 15.160 | 14.563 | … | 0.215 | 0.039 | 0.075 |
| (0.006) | (0.004) | (0.006) | (0.006) | (0.016) | (0.021) | (0.031) | (0.029) | (1.334) | (0.169) | (4.369) | (…) | (0.031) | (0.006) | (0.001) | |
| CGCG 049-057 | 0.018 | 0.013 | 0.027 | 0.056 | 0.05 | 0.555 | 0.950 | 21.890 | 20.487 | 31.530 | … | … | 0.200 | … | 0.046 |
| (0.002) | (0.001) | (0.002) | (0.002) | (…) | (0.028) | (0.029) | (0.072) | (3.073) | (0.158) | (…) | (…) | (0.027) | (…) | (0.001) | |
| VV 705 | 0.028 | 0.022 | 0.065 | 0.130 | 0.290 | 1.196 | 1.420 | 9.020 | 8.479 | 10.000 | 6.308 | 0.423 | 0.060 | 0.031 | 0.048 |
| (0.003) | (0.002) | (0.003) | (0.003) | (0.019) | (0.060) | (0.016) | (0.021) | (1.272) | (0.091) | (1.892) | (0.093) | (0.014) | (0.005) | (0.001) | |
| IRAS F15250+3608 | 0.010 | 0.010 | 0.038 | 0.122 | 0.160 | 1.065 | 1.310 | 7.100 | 6.309 | 5.930 | 3.214 | 0.252 | 0.033 | … | 0.014 |
| (0.001) | (0.001) | (0.001) | (0.001) | (0.030) | (0.053) | (0.025) | (0.043) | (0.946) | (0.098) | (0.964) | (0.070) | (0.008) | (…) | (0.001) | |
| UGC 09913 | 0.054 | 0.045 | 0.137 | 0.251 | 0.610 | 4.010 | 8.000 | 104.090 | 80.771 | 115.290 | … | … | 0.832 | 0.208 | 0.324 |
| (0.005) | (0.005) | (0.005) | (0.005) | (0.021) | (0.201) | (0.034) | (0.112) | (12.116) | (0.138) | (…) | (…) | (0.086) | (0.031) | (0.001) | |
| NGC 6090 | 0.033 | 0.023 | 0.061 | 0.177 | 0.260 | 0.954 | 1.240 | 6.480 | 6.762 | 9.410 | 7.233 | … | … | … | 0.046 |
| (0.003) | (0.002) | (0.003) | (0.003) | (0.020) | (0.048) | (0.021) | (0.030) | (1.014) | (0.102) | (2.170) | (…) | (…) | (…) | (0.001) | |
| CGCG 052-037 | 0.041 | 0.030 | 0.082 | 0.222 | 0.250 | 0.786 | 0.810 | 7.000 | 7.559 | 11.230 | 9.288 | … | 0.095 | … | 0.031 |
| (0.004) | (0.003) | (0.004) | (0.004) | (0.030) | (0.039) | (0.031) | (0.022) | (1.134) | (0.133) | (2.786) | (…) | (0.018) | (…) | (0.001) | |
| NGC 6286 | 0.065 | 0.047 | 0.134 | 0.329 | 0.470 | 0.581 | 0.620 | 9.240 | 13.129 | 23.110 | 21.270 | … | … | … | 0.156 |
| (0.007) | (0.005) | (0.007) | (0.007) | (0.015) | (0.029) | (0.017) | (0.043) | (1.969) | (0.048) | (6.381) | (…) | (…) | (…) | (0.001) | |
| IRAS F17132+5313 | 0.017 | 0.014 | 0.030 | 0.105 | 0.240 | 0.493 | 0.650 | 6.070 | 6.115 | 7.900 | 5.576 | … | … | … | 0.026 |
| (0.002) | (0.001) | (0.002) | (0.002) | (0.021) | (0.025) | (0.024) | (0.034) | (0.917) | (0.105) | (1.673) | (…) | (…) | (…) | (0.001) | |
| ESO 602-G025 | 0.043 | 0.037 | 0.098 | 0.229 | 0.270 | 0.608 | 0.910 | 5.420 | 6.359 | 9.640 | 7.844 | … | … | … | 0.041 |
| (0.004) | (0.004) | (0.004) | (0.004) | (0.029) | (0.030) | (0.045) | (0.044) | (0.954) | (0.082) | (2.353) | (…) | (…) | (…) | (0.001) | |
| IRAS F22491-1808 | 0.009 | 0.004 | 0.003 | 0.028 | 0.09 | 0.433 | 0.540 | 5.540 | 4.744 | 4.640 | 3.014 | … | … | … | 0.006 |
| (0.001) | (0.000) | (0.001) | (0.001) | (…) | (0.022) | (0.067) | (0.036) | (0.712) | (0.095) | (0.904) | (…) | (…) | (…) | (0.001) | |
| NGC 7469 | 0.209 | 0.187 | 0.665 | 0.771 | 1.590 | 4.080 | 5.960 | 27.330 | 25.034 | 35.160 | … | … | 0.264 | 0.071 | 0.169 |
| (0.021) | (0.019) | (0.021) | (0.021) | (0.039) | (0.204) | (0.032) | (0.040) | (3.755) | (0.599) | (…) | (…) | (0.030) | (0.011) | (0.001) | |
| CGCG 453-062 | 0.032 | 0.022 | 0.056 | 0.136 | 0.190 | 0.411 | 0.540 | 7.190 | 7.619 | 11.730 | 10.317 | … | 0.069 | … | 0.037 |
| (0.003) | (0.002) | (0.003) | (0.003) | (0.038) | (0.021) | (0.038) | (0.047) | (1.143) | (0.163) | (3.095) | (…) | (0.014) | (…) | (0.001) | |
| IC 5298 | 0.037 | 0.045 | 0.048 | 0.132 | 0.340 | 1.427 | 1.950 | 9.060 | 8.424 | 11.990 | 6.774 | … | 0.077 | … | 0.034 |
| (0.004) | (0.005) | (0.004) | (0.004) | (0.024) | (0.071) | (0.053) | (0.051) | (1.264) | (0.097) | (2.032) | (…) | (0.015) | (…) | (0.001) | |
| NGC 7592 | 0.044 | 0.037 | 0.091 | 0.214 | 0.260 | 0.868 | 0.970 | 8.050 | 7.445 | 10.580 | 8.833 | … | 0.108 | … | 0.062 |
| (0.004) | (0.004) | (0.004) | (0.004) | (0.031) | (0.043) | (0.056) | (0.049) | (1.117) | (0.137) | (2.650) | (…) | (0.019) | (…) | (0.001) | |
| NGC 7674 | 0.090 | 0.093 | 0.202 | 0.295 | 0.680 | 1.600 | 1.920 | 5.360 | 5.881 | 8.330 | 7.966 | … | 0.108 | 0.086 | 0.209 |
| (0.009) | (0.009) | (0.009) | (0.009) | (0.037) | (0.080) | (0.034) | (0.042) | (0.882) | (0.141) | (2.390) | (…) | (0.020) | (0.013) | (0.001) | |
| NGC 7770/1 | 0.321 | 0.213 | 0.447 | 0.958 | 0.990 | 1.773 | 2.170 | 19.670 | 23.341 | 40.120 | … | … | 0.377 | … | 0.124 |
| (0.032) | (0.021) | (0.032) | (0.032) | (0.036) | (0.089) | (0.036) | (0.135) | (3.501) | (0.839) | (…) | (…) | (0.042) | (…) | (0.001) | |
| MRK 0331 | 0.054 | 0.039 | 0.133 | 0.320 | 0.520 | … | 2.540 | 18.000 | … | 22.700 | … | … | 0.132 | 0.028 | 0.068 |
| (0.005) | (0.004) | (0.005) | (0.005) | (0.035) | (…) | (0.026) | (0.046) | (…) | (0.194) | (…) | (…) | (0.025) | (0.006) | (0.001) |
Note. — The photometry values have been measured with a uniform mask for each object. Exceptions in each column are marked by superscripted letters indicating literature or NED reference.
Columns (2-5) -IRAC photometry from images in Mazzarella et al., in prep.
Columns (6) photometry from Sanders et al. (2003)
Column (7) -MIPS24 photometry from images in Mazzarella et al., in prep.
Column (8-9) photmetry from Sanders et al. (2003)
Column (10) -MIPS70 photometry from images in Mazzarella et al., in prep.
Column (11) photometry from Sanders et al. (2003)
Column (12) -MIPS160 photometry from images in Mazzarella et al., in prep.
Columns (13-14) JCMT/SCUBA submillimeter photometry from Dunne et al. (2000); Dunne & Eales (2001)
Columns (15-16) VLA photometry from Condon et al. (1990, 1991)
c at 1.425 GHz – photometry from Condon et al. (1996)
| log | Band | log | log | |
|---|---|---|---|---|
| (Hz) | (m) | (Name) | () | () |
| (ULIRGs) | (LIRGs) | |||
| 18.16 | 2.07E-04 | HX | 8.20 | 7.68 |
| 17.48 | 9.93E-04 | SX | 7.86 | 7.39 |
| 15.29 | 0.15 | FUV | 9.72 | 9.68 |
| 15.11 | 0.23 | NUV | 9.76 | 9.72 |
| 14.91 | 0.37 | U | 9.97 | 9.94 |
| 14.82 | 0.46 | B | 10.38 | 10.32 |
| 14.75 | 0.54 | V | 10.52 | 10.42 |
| 14.67 | 0.65 | R | 10.64 | 10.51 |
| 14.54 | 0.86 | I | 10.77 | 10.61 |
| 14.38 | 1.24 | J | 10.85 | 10.64 |
| 14.26 | 1.65 | H | 10.86 | 10.63 |
| 14.14 | 2.17 | K | 10.73 | 10.47 |
| 13.93 | 3.56 | IRAC1 | 10.80 | 10.25 |
| 13.82 | 4.51 | IRAC2 | 10.89 | 10.33 |
| 13.72 | 5.76 | IRAC3 | 10.98 | 10.40 |
| 13.58 | 7.96 | IRAC4 | 11.11 | 10.50 |
| 13.41 | 11.60 | IRAS1 | 11.24 | 10.62 |
| 13.10 | 23.84 | MIPS1 | 11.62 | 10.86 |
| 13.10 | 23.88 | IRAS2 | 11.62 | 10.86 |
| 12.69 | 61.49 | IRAS3 | 12.04 | 11.33 |
| 12.62 | 72.56 | MIPS2 | 11.99 | 11.32 |
| 12.47 | 101.98 | IRAS4 | 11.80 | 11.21 |
| 12.28 | 156.96 | MIPS3 | 11.39 | 10.86 |
| 11.82 | 449.57 | SCUBA1 | 9.89 | 9.33 |
| 11.54 | 866.77 | SCUBA2 | 8.82 | 8.15 |
| 9.15 | 2.14E05 | VLA | 6.19 | 5.57 |
| range | ||||
|---|---|---|---|---|
| (m) | (index) | (LIRGs) | (ULIRGs) | |
| log | Band | ||||
|---|---|---|---|---|---|
| (Hz) | (m) | (Name) | |||
| 18.16 | 2.07E-04 | HX | -3.10 | 0.81 | 3.73 |
| 17.48 | 9.93E-04 | SX | -3.69 | 0.54 | 2.24 |
| 15.23 | 0.15 | FUV | -1.88 | 0.61 | 3.18 |
| 15.11 | 0.23 | NUV | -1.83 | 0.56 | 2.88 |
| 14.91 | 0.37 | U | -1.62 | 0.48 | 1.70 |
| 14.82 | 0.46 | B | -1.23 | 0.47 | 1.68 |
| 14.75 | 0.54 | V | -1.12 | 0.45 | 1.72 |
| 14.67 | 0.65 | R | -1.03 | 0.44 | 1.76 |
| 14.54 | 0.86 | I | -0.92 | 0.44 | 1.82 |
| 14.38 | 1.24 | J | -0.88 | 0.43 | 1.82 |
| 14.26 | 1.65 | H | -0.88 | 0.44 | 1.82 |
| 14.14 | 2.17 | K | -1.04 | 0.43 | 1.80 |
| 13.93 | 3.56 | IRAC1 | -1.15 | 0.50 | 2.45 |
| 13.82 | 4.51 | IRAC2 | -1.07 | 0.46 | 2.22 |
| 13.72 | 5.76 | IRAC3 | -0.99 | 0.42 | 1.98 |
| 13.58 | 7.96 | IRAC4 | -0.88 | 0.36 | 1.68 |
| 13.41 | 11.60 | IRAS1 | -0.75 | 0.30 | 1.34 |
| 13.10 | 23.84 | MIPS1 | -0.44 | 0.17 | 0.95 |
| 13.10 | 23.88 | IRAS2 | -0.44 | 0.17 | 0.95 |
| 12.69 | 61.49 | IRAS3 | 0.00 | 0.00 | 0.00 |
| 12.62 | 72.56 | MIPS2 | -0.02 | 0.05 | 0.19 |
| 12.47 | 101.98 | IRAS4 | -0.17 | 0.13 | 0.53 |
| 12.28 | 156.96 | MIPS3 | -0.55 | 0.19 | 0.84 |
| 11.82 | 449.57 | SCUBA1 | -2.07 | 0.25 | 1.16 |
| 11.54 | 866.77 | SCUBA2 | -3.20 | 0.29 | 1.34 |
| 9.15 | 2.14E05 | VLA | -5.81 | 0.28 | 1.75 |
| RBGS Name | log ()mBB | log () | |
|---|---|---|---|
| () | () | () | |
| NGC0034 | 11.480.01 | 37.640.40 | 6.880.06 |
| MCG-02-01-051/2 | 11.460.02 | 32.700.57 | 7.110.06 |
| NGC0232 | 11.430.01 | 28.350.18 | 7.410.06 |
| IC1623A/B | 11.660.01 | 31.450.15 | 7.420.06 |
| MCG-03-04-014 | 11.630.02 | 31.090.50 | 7.420.06 |
| CGCG436-030 | 11.680.02 | 39.050.80 | 7.140.06 |
| IRASF01364-1042 | 11.790.02 | 35.370.65 | 7.360.06 |
| IIIZw035 | 11.620.02 | 35.860.65 | 7.350.06 |
| NGC0695 | 11.690.02 | 27.900.36 | 7.540.06 |
| NGC0958 | 11.220.02 | 23.420.32 | 7.550.06 |
| UGC02238 | 11.390.01 | 26.340.24 | 7.130.06 |
| UGC02369 | 11.600.02 | 34.010.52 | 7.180.06 |
| IRASF03359+1523 | 11.510.03 | 33.620.78 | 7.120.06 |
| UGC02982 | 11.200.02 | 27.330.45 | 6.960.06 |
| ESO550-IG025 | 11.500.02 | 28.950.36 | 7.440.06 |
| NGC1614 | 11.610.01 | 42.230.15 | 6.450.06 |
| IRASF05189-2524 | 12.130.01 | 46.200.22 | 8.020.06 |
| NGC2623 | 11.580.02 | 35.780.42 | 7.350.06 |
| IRASF08572+3915 | 12.170.04 | 46.091.12 | 7.600.06 |
| UGC04881 | 11.700.02 | 28.620.42 | 7.430.06 |
| UGC05101 | 12.000.01 | 28.750.28 | 7.830.06 |
| MCG+08-18-013 | 11.330.02 | 29.830.58 | 6.860.06 |
| IC0563/4 | 11.280.01 | 24.300.21 | 7.570.06 |
| NGC3110 | 11.410.01 | 25.980.16 | 7.260.06 |
| IRASF10173+0828 | 11.790.02 | 36.780.72 | 7.430.06 |
| IRASF10565+2448 | 12.050.02 | 33.620.50 | 7.540.06 |
| MCG+07-23-019 | 11.630.02 | 29.350.42 | 7.470.06 |
| CGCG011-076 | 11.380.03 | 29.620.77 | 7.180.06 |
| IC2810 | 11.640.02 | 28.950.43 | 7.560.06 |
| NGC3690/IC694 | 11.890.01 | 41.360.05 | 7.090.06 |
| IRASF12112+0305 | 12.330.03 | 35.780.75 | 8.060.06 |
| IRASF12224-0624 | 11.320.03 | 31.230.64 | 7.320.06 |
| UGC08058 | 12.530.01 | 45.670.13 | 7.500.06 |
| NGC4922 | 11.330.02 | 37.810.67 | 6.320.06 |
| ESO507-G070 | 11.530.01 | 33.310.42 | 7.190.06 |
| IC0860 | 11.100.02 | 37.290.41 | 6.840.06 |
| VV250a | 11.770.01 | 37.810.31 | 7.150.06 |
| UGC08387 | 11.720.01 | 30.310.28 | 7.280.06 |
| NGC5104 | 11.250.01 | 26.100.29 | 7.030.06 |
| MCG-03-34-064 | 11.190.01 | 53.900.64 | 5.890.06 |
| NGC5135 | 11.290.01 | 27.260.15 | 7.350.06 |
| NGC5256 | 11.520.02 | 31.450.59 | 7.220.06 |
| NGC5257/8 | 11.630.01 | 27.140.23 | 7.700.06 |
| UGC08696 | 12.180.01 | 37.810.15 | 7.570.06 |
| CGCG247-020 | 11.350.02 | 31.160.66 | 6.720.06 |
| IRASF14348-1447 | 12.370.35 | 37.035.09 | 8.350.09 |
| VV340a | 11.790.02 | 25.800.28 | 7.920.06 |
| CGCG049-057 | 11.330.01 | 30.590.32 | 7.230.06 |
| VV705 | 11.880.01 | 37.030.38 | 7.000.06 |
| IRASF15250+3608 | 12.070.02 | 43.610.64 | 7.490.06 |
| UGC09913 | 12.240.01 | 35.690.10 | 8.000.06 |
| NGC6090 | 11.550.02 | 30.950.37 | 7.340.06 |
| CGCG052-037 | 11.450.02 | 29.150.41 | 7.220.06 |
| NGC6286 | 11.420.01 | 23.860.11 | 7.810.06 |
| IRASF17132+5313 | 11.920.02 | 33.010.53 | 7.610.06 |
| ESO602-G025 | 11.340.01 | 27.770.31 | 7.370.06 |
| IRASF22491-1808 | 12.190.02 | 40.790.88 | 7.490.06 |
| NGC7469 | 11.580.01 | 39.960.32 | 6.740.06 |
| CGCG453-062 | 11.370.02 | 28.550.45 | 7.010.06 |
| IC5298 | 11.530.01 | 32.630.46 | 6.880.06 |
| NGC7592 | 11.390.02 | 32.330.59 | 7.210.06 |
| NGC7674 | 11.510.03 | 28.420.51 | 7.440.06 |
| NGC7771 | 11.350.03 | 27.200.48 | 7.280.06 |
| MRK0331 | 11.360.01 | 32.700.41 | 6.740.06 |
| RBGS Name | log ()Sal | log ()Sal | log ()Cha | log ()Cha |
|---|---|---|---|---|
| () | () | () | () | |
| (2) | (3) | (4) | (5) | |
| NGC0034 | 10.44 | 10.58 | 10.41 | 10.07 |
| MCG-02-01-051/2 | 9.15 | 10.65 | 10.42 | 10.15 |
| NGC0232 | 10.72 | 10.84 | 11.05 | 10.34 |
| IC1623A/B | 9.07 | 10.65 | 10.56 | 10.15 |
| MCG-03-04-014 | 10.89 | 10.85 | 10.79 | 10.35 |
| CGCG436-030 | 9.97 | 10.56 | 9.74 | 10.06 |
| IRASF01364-1042 | 10.65 | 10.45 | 10.75 | 9.95 |
| IIIZw035 | 10.15 | 10.25 | 10.26 | 9.75 |
| NGC0695 | 11.04 | 11.03 | 11.29 | 10.53 |
| NGC0958 | 11.05 | 11.14 | 11.27 | 10.63 |
| UGC02238 | 10.36 | 10.55 | 10.74 | 10.04 |
| UGC02369 | 11.19 | 11.03 | 11.29 | 10.53 |
| IRASF03359+1523 | 10.73 | 10.29 | 11.09 | 9.79 |
| UGC02982 | 11.07 | 10.54 | 10.76 | 10.04 |
| ESO550-IG025 | 10.94 | 10.93 | 11.22 | 10.43 |
| NGC1614 | 10.51 | 10.63 | 10.51 | 10.13 |
| IRASF05189-2524 | 10.97 | 10.91 | 11.36 | 10.41 |
| NGC2623 | 10.31 | 10.47 | 10.38 | 9.96 |
| IRASF08572+3915 | 10.12 | 10.29 | 10.51 | 9.81 |
| UGC04881 | 11.04 | 10.97 | 10.86 | 10.47 |
| UGC05101 | 10.86 | 10.93 | 11.23 | 10.43 |
| MCG+08-18-013 | 9.86 | 9.56 | 9.27 | 9.06 |
| IC0563/4 | 10.72 | 10.87 | 10.95 | 10.36 |
| NGC3110 | 10.45 | 10.83 | 10.72 | 10.32 |
| IRASF10173+0828 | 10.81 | 10.33 | 10.55 | 9.84 |
| IRASF10565+2448 | 9.59 | 10.87 | 10.76 | 10.38 |
| MCG+07-23-019 | 10.37 | 10.63 | 10.37 | 10.14 |
| CGCG011-076 | 10.65 | 10.75 | 10.84 | 10.25 |
| IC2810 | 11.05 | 10.99 | 11.01 | 10.49 |
| NGC3690/IC694 | 10.17 | 10.76 | 10.52 | 10.26 |
| IRASF12112+0305 | 10.92 | 10.76 | 11.05 | 10.28 |
| IRASF12224-0624 | 9.95 | 9.95 | 9.99 | 9.45 |
| UGC08058 | 10.32 | 11.48 | 11.92 | 10.98 |
| NGC4922 | 11.48 | 10.97 | 11.19 | 10.47 |
| ESO507-G070 | 10.64 | 10.78 | 11.15 | 10.28 |
| IC0860 | 10.12 | 10.12 | 10.29 | 9.62 |
| VV250a | 10.24 | 10.39 | 10.31 | 10.02 |
| UGC08387 | 10.55 | 10.59 | 10.45 | 10.08 |
| NGC5104 | 10.56 | 10.81 | 10.83 | 10.29 |
| MCG-03-34-064 | 10.84 | 10.75 | 11.01 | 10.25 |
| NGC5135 | 10.65 | 10.97 | 10.82 | 10.46 |
| NGC5256 | 10.72 | 11.01 | 10.85 | 10.51 |
| NGC5257/8 | 11.01 | 11.23 | 11.21 | 10.73 |
| UGC08696 | 10.86 | 10.96 | 10.84 | 10.46 |
| CGCG247-020 | 10.36 | 10.45 | 10.76 | 9.95 |
| IRASF14348-1447 | 10.76 | 11.02 | 11.07 | 10.54 |
| VV340a | 10.82 | 10.83 | 11.07 | 10.31 |
| CGCG049-057 | 10.15 | 10.02 | 10.21 | 9.52 |
| VV705 | 10.68 | 10.86 | 10.71 | 10.37 |
| IRASF15250+3608 | 9.91 | 10.61 | 10.57 | 10.11 |
| UGC09913 | 10.71 | 10.81 | 10.88 | 10.29 |
| NGC6090 | 10.75 | 10.73 | 10.66 | 10.23 |
| CGCG052-037 | 10.65 | 10.72 | 10.75 | 10.25 |
| NGC6286 | 10.73 | 10.76 | 10.62 | 10.26 |
| IRASF17132+5313 | 11.43 | 10.89 | 11.25 | 10.39 |
| ESO602-G025 | 10.96 | 10.82 | 10.84 | 10.31 |
| IRASF22491-1808 | 10.37 | 10.71 | 10.77 | 10.23 |
| NGC7469 | 11.02 | 11.05 | 10.85 | 10.54 |
| CGCG453-062 | 10.55 | 10.62 | 10.63 | 10.12 |
| IC5298 | 10.73 | 10.76 | 10.83 | 10.26 |
| NGC7592 | 10.07 | 10.73 | 10.75 | 10.23 |
| NGC7674 | 10.85 | 11.17 | 11.23 | 10.67 |
| NGC7770/1 | 10.02 | 11.08 | 11.28 | 10.57 |
| MRK0331 | 10.21 | 9.67 | 10.19 | 9.88 |
| RBGS Name | log SFRUV | log SFRIR | log SFRUV+IR | log sSFRUV+IR |
|---|---|---|---|---|
| ( yr-1) | ( yr-1) | ( yr-1) | (yr-1) | |
| NGC0034 | 0.40 | 1.50 | 1.54 | -8.88 |
| MCG-02-01-051/2 | 0.38 | 1.50 | 1.53 | -8.89 |
| NGC0232 | 0.01 | 1.47 | 1.49 | -9.51 |
| IC1623A/B | 0.49 | 1.72 | 1.74 | -8.82 |
| MCG-03-04-014 | 0.51 | 1.68 | 1.71 | -9.10 |
| CGCG436-030 | 0.19 | 1.71 | 1.72 | -8.02 |
| IRASF01364-1042 | -0.16 | 1.80 | 1.81 | -8.91 |
| IIIZw035 | -0.29 | 1.65 | 1.66 | -8.61 |
| NGC0695 | 0.14 | 1.69 | 1.71 | -9.59 |
| NGC0958 | 0.59 | 1.21 | 1.31 | -9.97 |
| UGC02238 | -0.27 | 1.34 | 1.35 | -9.42 |
| UGC02369 | 0.09 | 1.69 | 1.70 | -9.63 |
| IRASF03359+1523 | 0.08 | 1.56 | 1.57 | -8.71 |
| UGC02982 | -0.77 | 1.21 | 1.21 | -9.48 |
| ESO550-IG025 | -0.39 | 1.54 | 1.54 | -9.67 |
| NGC1614 | 0.50 | 1.68 | 1.71 | -8.81 |
| IRASF05189-2524 | 0.28 | 2.19 | 2.19 | -9.14 |
| NGC2623 | 0.19 | 1.60 | 1.62 | -8.78 |
| IRASF08572+3915 | 0.05 | 2.21 | 2.21 | -8.29 |
| UGC04881 | 0.64 | 1.74 | 1.77 | -9.10 |
| UGC05101 | 0.19 | 2.02 | 2.03 | -9.19 |
| MCG+08-18-013 | -0.41 | 1.35 | 1.36 | -8.27 |
| IC0563/4 | 0.27 | 1.23 | 1.28 | -9.72 |
| NGC3110 | 0.71 | 1.38 | 1.47 | -9.26 |
| IRASF10173+0828 | -2.27 | 1.87 | 1.87 | -8.64 |
| IRASF10565+2448 | 0.59 | 2.11 | 2.12 | -8.68 |
| MCG+07-23-019 | 0.72 | 1.64 | 1.69 | -8.71 |
| CGCG011-076 | -0.15 | 1.46 | 1.47 | -9.37 |
| IC2810 | 0.36 | 1.66 | 1.68 | -9.32 |
| NGC3690/IC694 | 0.95 | 1.95 | 1.99 | -8.54 |
| IRASF12112+0305 | 0.33 | 2.35 | 2.36 | -8.61 |
| IRASF12224-0624 | -2.44 | 1.37 | 1.37 | -8.63 |
| UGC08058 | 0.56 | 2.58 | 2.58 | -9.33 |
| NGC4922 | -0.55 | 1.39 | 1.40 | -9.80 |
| ESO507-G070 | -0.10 | 1.56 | 1.57 | -9.58 |
| IC0860 | -0.71 | 1.11 | 1.12 | -9.18 |
| VV250a | 0.40 | 1.79 | 1.81 | -9.03 |
| UGC08387 | 0.36 | 1.73 | 1.75 | -8.75 |
| NGC5104 | 0.07 | 1.25 | 1.28 | -9.55 |
| MCG-03-34-064 | -0.98 | 1.32 | 1.32 | -9.68 |
| NGC5135 | 0.51 | 1.33 | 1.39 | -9.39 |
| NGC5256 | 0.82 | 1.59 | 1.65 | -9.20 |
| NGC5257/8 | 0.91 | 1.63 | 1.71 | -9.49 |
| UGC08696 | 0.60 | 2.21 | 2.22 | -8.61 |
| CGCG247-020 | -1.33 | 1.39 | 1.40 | -9.33 |
| IRASF14348-1447 | 0.77 | 2.39 | 2.40 | -8.73 |
| VV340a | 0.75 | 1.77 | 1.81 | -9.60 |
| CGCG049-057 | -0.83 | 1.36 | 1.36 | -8.85 |
| VV705 | 0.80 | 1.92 | 1.95 | -8.75 |
| IRASF15250+3608 | 0.12 | 2.09 | 2.09 | -8.54 |
| UGC09913 | -0.01 | 2.26 | 2.27 | -8.64 |
| NGC6090 | 0.63 | 1.59 | 1.63 | -9.04 |
| CGCG052-037 | 0.05 | 1.47 | 1.49 | -9.26 |
| NGC6286 | 0.35 | 1.38 | 1.42 | -9.15 |
| IRASF17132+5313 | 0.11 | 1.97 | 1.98 | -9.16 |
| ESO602-G025 | -0.09 | 1.35 | 1.36 | -9.50 |
| IRASF22491-1808 | 0.22 | 2.21 | 2.22 | -8.47 |
| NGC7469 | 0.62 | 1.68 | 1.71 | -9.49 |
| CGCG453-062 | -0.14 | 1.39 | 1.40 | -9.22 |
| IC5298 | 0.05 | 1.62 | 1.63 | -9.20 |
| NGC7592 | 0.17 | 1.40 | 1.42 | -9.33 |
| NGC7674 | 0.57 | 1.59 | 1.63 | -9.60 |
| NGC7771 | 0.25 | 1.40 | 1.43 | -9.83 |
| MRK0331 | 0.04 | 1.52 | 1.54 | -9.24 |