Electromagnetic properties of baryon resonances
Abstract
Longitudinal and transverse transition form factors for most of the four-star nucleon resonances have been obtained from high-quality cross section data and polarization observables measured at MAMI, ELSA, BATES, GRAAL and CEBAF. As an application, we further show how the transition form factors can be used to obtain empirical transverse charge densities. Contour plots of the thus derived densities are shown and compared for the Roper and nucleon resonances.
Keywords:
Baryon resonances, transition form factors:
14.20.Gk, 13.75.Gx, 13.60.Le1 Introduction
During the last decade, significant progress on the electromagnetic excitation of nucleon resonances has been obtained. For pion and eta photoproduction very precise data of unpolarized cross sections and photon asymmetries were measured at MAMI@Mainz, ELSA@Bonn, LEGS@Brookhaven and GRAAL@Grenoble. For electroproduction, at Mainz, Bonn and Bates measurements for the excitation were performed at low , and for higher up to about GeV2, at JLab a very large amount of data was collected in an energy range up to the third nucleon resonance region.
In parallel with the ongoing experiments, several theoretical groups developed models and analysis techniques, which were applied to the data. The model-independent GWU/SAID analysis Workman:2011vb mostly analyzed the pion photoproduction data and improved the values of the photon couplings over the years. Coupled channels analyses were performed by the Giessen group Shklyar:2006xw and by the Bonn-Gatchina group Anisovich:2009zy . Transition amplitudes were also determined in the framework of dynamically generated resonances by coupling to meson-baryon channels by the Jülich Doring:2009uc and EBAC Suzuki:2010yn groups.
However, most successful concerning the general applicability to the higher resonances, were the unitary isobar models of the Mainz group (MAID model) Maid98 ; MAID07 ; Tiator:2011pw and of the JLab group Aznauryan:2011qj who used dispersion relations as an additional constraint to reduce the model dependence due to incomplete experimental input.
With our unitary isobar model MAID, we analyzed all available electroproduction data in order to determine the transition form factors for all four-star resonances below GeV. In most cases we could obtain both single- and dependent transition form factors for the proton target. In the case of the neutron, the parametrization of the dependence had to take a simpler form because of the much smaller world database.
Single- data points for longitudinal and transverse form factors have been obtained for transitions from the proton to the and , which can be downloaded from the MAID website MAID . Here only results for the , and the are shown. Full results and details of the parameterizations are given in our recent review article, Ref. Tiator:2011pw .
The main motivation for exploring the nucleon transition form factors is to obtain a precise knowledge of the nucleon excitation spectrum, which provides – together with the elastic form factors – a complete description of the nucleon’s electromagnetic structure. This structure can be compared with QCD inspired quark models and, in recent years, more and more also with lattice QCD calculations.
1.1 First resonance region
The is the only nucleon resonance with a well-defined Breit-Wigner resonance position, MeV. It is an ideal single-channel resonance, the Watson theorem applies, and the Breit-Wigner position coincides with the K-matrix pole position. For these reasons, the form factors can be determined in an essentially model independent way. The magnetic form factor shown in Fig. 1 is very well known already from inelastic electron scattering up to high momentum transfer, GeV2, and can be parameterized in a surprisingly simple form found in our previous MAID analysis,
| (1) |
with the standard dipole form factor of the nucleon.
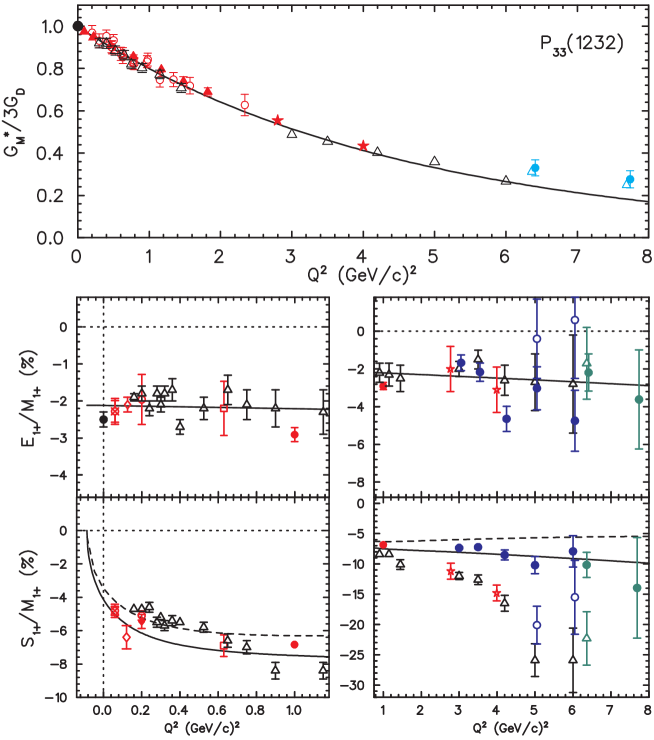
The electric and Coulomb form factors are much smaller and are usually given as ratios of and to the magnetic form factor in percent. Figure 1 also compares the MAID2007 solutions (solid lines) for the ratios and with other analyses. The ratio from MAID2007 stays always below the zero line, in agreement with the original analysis of the data Ung06 ; Fro99 and also with the dynamical model of Sato and Lee SL01 who concluded that remains negative and tends towards more negative values with increasing instead of an uprise towards unity. This indicates that the predicted helicity conservation at the quark level is irrelevant for the present experimental range. For the ratio our dependent fit approaches a negative constant for large in good agreement with the predictions of Ji et al. Ji:2003fw , Buchmann Buchmann:2004ia and Ramalho et al. Ramalho:2008dp , who use a relation between the ratio and the ratio of the electric and magnetic neutron form factors. For our Maid2007 single- analysis for disagrees with the JLab analysis of Aznauryan et al. Azn09 . Whereas our analysis stays almost constant, the JLab analysis suggests a much larger negative slope. By repeating our data analysis at and GeV2 in different energy ranges, we found a strong dependence of the fit on the energy interval used. Our results of 2007 were obtained with the full energy range of the measured data, MeV.
Figure 1 also shows an analysis (blue open circles) in the energy range of MeV, much closer to the resonance position. If we choose the energy interval even closer to resonance, MeV, the errors increase further by a factor of 2 and the ratio becomes large and positive, while the ratio remains the same. We conclude that the analysis in this range strongly depends on the energy interval and the parametrization of the background used in the analysis and requires further studies.
1.2 Results for the second resonance region
The helicity amplitudes for the Roper resonance are displayed in the upper panel of Fig. 2. Our latest dependent solution (solid lines) is in reasonable agreement with the single- analysis (red circles). The figure shows a zero crossing of the transverse helicity amplitude at GeV2 and a maximum at the relatively large momentum transfer GeV2. The longitudinal Roper excitation rises to large values around GeV2 and produces one of the strongest longitudinal amplitudes that we find in our analyses.
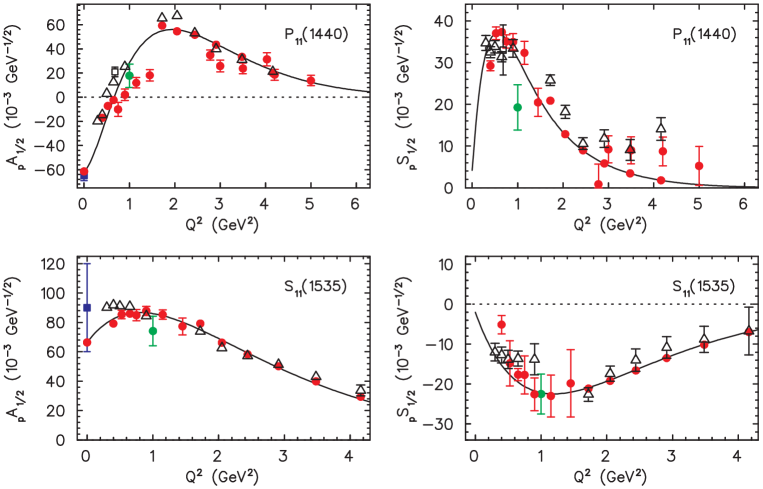
The lower panel in Fig. 2 displays the results for the resonance. The red single- data points show our results of 2007, which are in good agreement with our dependent analysis (solid lines). The black triangles are the 2009 results of Ref. Azn09 . The blue data point at represents the PDG average over several and analyses. While we find values around 65 in all MAID analyses, the JLab analysis obtains values around 90 for and 110 for Aznauryan:2011qj . Also the SAID and Bonn-Gatchina groups extract values around 100, but in a very recent analysis, based on pion photoproduction, Shrestha and Manley report, however, also a small coupling of Shrestha:2012ep .
From the dependent parametrization of the transition form factors we can calculate transverse charge transition densities, as viewed from a light front moving towards the baryon Tiator2009 . For that we first have to transform the helicity form factors to the Dirac-like form factors and , which results in simple linear relations. The transverse densities are then obtained by a 2-dim Fourier-Bessel transformation. The densities relating to appear as fully symmetrical monopole patterns, while the form factors transform to additional dipole patterns (further details in Ref. Tiator:2011pw ).
As an example, in Fig. 3 we show the polarized quark transverse charge densities from the proton to the Roper and to the resonances. Comparing these results, we find that the dipole contribution of the up and down quarks to the polarized densities is much less pronounced for the due to the much smaller form factor ratio.


References
-
(1)
R. L. Workman, W. J. Briscoe, M. W. Paris and I. I. Strakovsky,
Phys. Rev. C 85, 025201 (2012).
http://gwdac.phys.gwu.edu - (2) V. Shklyar, H. Lenske and U. Mosel, Phys. Lett. B650, 172 (2007).
-
(3)
A. V. Anisovich et al.,
Eur. Phys. J. A44, 203 (2010).
http://pwa.hiskp.uni-bonn.de - (4) M. Döring and K. Nakayama, Eur. Phys. J. A43, 83 (2010).
- (5) N. Suzuki, T. Sato and T. -S. H. Lee, Phys. Rev. C 82, 045206 (2010).
- (6) D. Drechsel, O. Hanstein, S. S. Kamalov and L. Tiator, Nucl. Phys. A 645, 145 (1999).
- (7) D. Drechsel, S. S. Kamalov and L. Tiator, Eur. Phys. J. A 34, 69 (2007).
- (8) L. Tiator, D. Drechsel, S. S. Kamalov and M. Vanderhaeghen, Eur. Phys. J. ST 198, 141 (2011).
- (9) I. G. Aznauryan and V. D. Burkert, Prog. Part. Nucl. Phys. 67, 1 (2012).
-
(10)
MAID website:
http://kph.uni-mainz.de/MAID/,
amplitude data:http://kph.uni-mainz.de/MAID/maid2007/data.html - (11) M. Ungaro et al. [ CLAS Collaboration ], Phys. Rev. Lett. 97, 112003 (2006).
- (12) V. V. Frolov et al., Phys. Rev. Lett. 82, 45 (1999).
- (13) T. Sato and T.-S. H. Lee, Phys. Rev. C 63, 055201 (2001).
- (14) X.-d. Ji, J.-P. Ma and F. Yuan, Phys. Rev. Lett. 90, 241601 (2003).
- (15) A. J. Buchmann, Phys. Rev. Lett. 93, 212301 (2004).
- (16) G. Ramalho, M. T. Pena and F. Gross, Phys. Rev. D 78, 114017 (2008).
- (17) A. N. Villano et al., Phys. Rev. C80, 035203 (2009).
- (18) I. G. Aznauryan et al. [ CLAS Collaboration ], Phys. Rev. C80, 055203 (2009).
- (19) M. Shrestha and D. M. Manley, arXiv:1208.2710 [hep-ph].
- (20) L. Tiator and M. Vanderhaeghen, Phys. Lett. B 642, 344 (2009).