Deep slitless infrared spectroscopic surveys with HST/WFC3
a white paper for the working group on deep fields and large HST programs
August 31, 2012
Benjamin J. Weiner (Steward Observatory), bjw@as.arizona.edu
Summary: HST is commonly thought of as an optical-IR imaging or UV-spectroscopy observatory. However, the advent of WFC3-IR made it possible to do slitless infrared spectroscopic surveys over an area significant for galaxy evolution studies (). Slitless infrared spectroscopy is uniquely possible from space due to the reduced background. Redshift surveys with WFC3-IR offer probes of the astrophysics of the galaxy population at z=1-3 from line features, and the true redshift and spatial distribution of galaxies, that cannot be done with photometric surveys alone. While HST slitless spectroscopy is low spectral resolution, its high multiplex advantage makes it competitive with future ground based IR spectrographs, its flux calibration is stable, and its high spatial resolution allows measuring the spatial extent of emission lines, which only HST can do currently for large numbers of objects. A deeper slitless IR spectroscopic survey over hundreds of arcmin2 (eg one or more GOODS fields) is one of the remaining niches for large galaxy evolution studies with HST, and would produce a sample of thousands of spectroscopically confirmed galaxies at to and beyond, of great interest to a large community of investigators. Finally, although JWST multislit spectroscopy will outstrip HST in resolution and sensitivity, I believe it is critical to have a spectroscopic sample in hand before JWST flies. This applies scientifically, to be prepared for the questions we want to answer with JWST, and observationally, because JWST’s lifetime is limited and a classic problem in targeted spectroscopy has been the turn-around time for designing surveys and for deciding which classes of objects to target. This white paper is released publicly to stimulate open discussion of future large HST programs.
1 Existing spectroscopic IR surveys and future niches
Slitless spectroscopy with the WFC3-IR grisms on HST has a greatly increased survey speed over what was attainable with NICMOS, and produces cosmetically clean data that can be processed through pipelines in large quantity. This has enabled surveys covering most of several deep imaging fields (the CANDELS111http://candels.ucolick.org , PI S. Faber and H. Ferguson; Grogin et al. 2011 fields): AGHAST222http://mingus.as.arizona.edu/bjw/aghast/ in one field (PI B. Weiner) and 3D-HST333http://3dhst.research.yale.edu/ , Brammer et al. 2012 in four fields (PI P. van Dokkum). Together these cover about 0.16 deg2 with the G141 grism, wavelength range 1.1-1.65 m, at a depth of 2 orbits/pointing, with an area of about 150 pointings of 2 x 2 arcmin. There is also a large parallel IR grism survey in effectively random fields, WISP444http://web.ipac.caltech.edu/staff/colbert/WISP/Home.html , Atek et al. 2010 (PI M. Malkan) and individual deeper grism pointings typically 6-8 orbit depth within the CANDELS fields as part of supernova followup (PI A. Riess).
Extragalactic blank-field surveys have found a layer cake approach useful, with steps between wide, deep, and ultra-deep layers of order 1/4 the area and 4-10x the exposure time. The 3D-HST + AGHAST surveys roughly correspond to the shallower, 2-orbit depth, “wide” layer of CANDELS, although they cover marginally less area and provide usable spectra only down to a limit 1-2 magnitudes brighter than the CANDELS-wide detection limit, since 2 orbits/pointing of spectroscopy does not go as deep as the CANDELS 2 orbits/pointing of imaging.
In the context of large community survey projects that might be carried out with either an allocation of director’s discretionary time, future Treasury programs, or some combination, here I suggest the utility of a “deep” layer of grism IR spectroscopy. This could cover of order 1-2 GOODS fields, or the CANDELS-deep parts of each GOODS, of order 100-200 arcmin2: about 40 pointings at depths of order 8 orbits/pointing in each of G102 and G141 grisms, providing spectral coverage from 0.8-1.65 m, with HST’s spatial resolution and good flux calibration.
Another obvious candidate for a large survey project is further deep field optical and IR imaging. In my opinion only, the niche for more blank-field imaging is not clear, since at any layer (CANDELS-wide, CANDELS-deep, HUDF/HUDF09) the expense of many hundreds of orbits would only increase area by a factor of 2 or 3 at most. Extremely deep exposure on small fields to detect high redshift galaxies is scientifically cutting-edge but also serves a small number of objects to a relatively small community of investigators. Other less well-trod niches include imaging or spectroscopy behind lensing clusters for high-z galaxies; deep grism spectroscopy in one or a few fields for high-z line emission; and large UV spectroscopy programs. I expect these to be discussed in other white papers.
2 What can be done with IR grism surveys
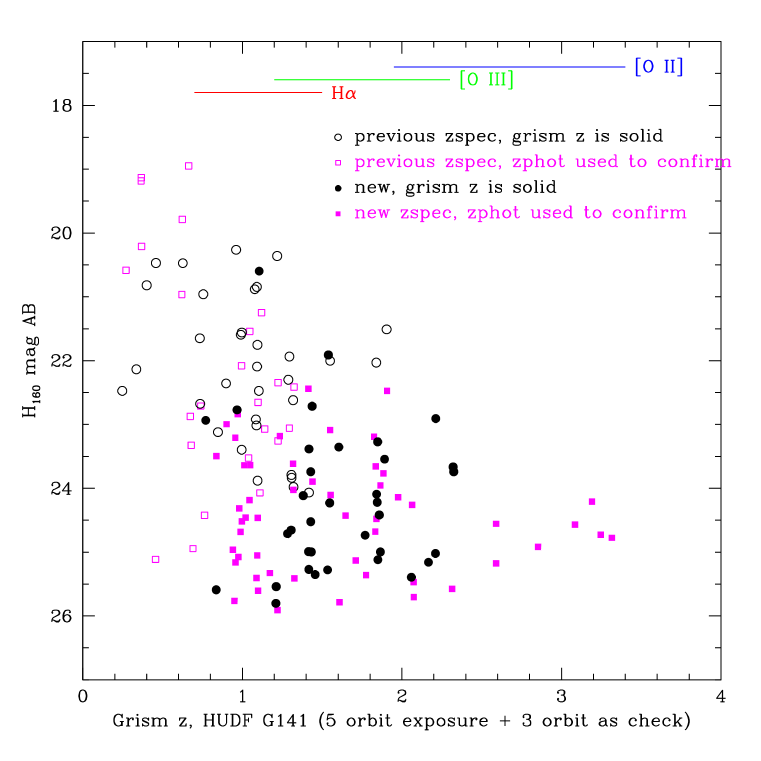
WFC3-IR G102 and G141 spectra cover 0.8-1.13 and 1.1-1.65 m, and in a deep-layer extragalactic survey, their chief yields are emission line detections, out to z=1.5 for H, z=2.3 for [O III], and z=3.4 for [O II]. Absorption lines can be measured in grism spectra but due to the low resolution, detections of strong Balmer absorption in bright post-starbursts are favored (eg van Dokkum & Brammer 2010), and these are interesting but rare - we expect only of order 1/pointing. The slitless spectroscopy yields many emission line spectra per pointing, up to redshifts in 2x2′, and can produce redshifts for very faint galaxies.
In 2-orbit data in low background fields, a moderately spatially extended line is detected at 5 at flux of 5e-17 erg cm-2 sec-1, and 8-12 orbit exposures increase S/N without reaching a systematic floor or confusion limit, although multiple roll angles are needed to resolve inter-object contamination. The practical yield of similar data is shown in Figures 1 and 2. A new generation of ground based IR spectrographs such as MOSFIRE are beginning to approach or better these limits in clean spectral regions, but still with lower multiplex and issues of sky subtraction and flux calibration. HST IR spectroscopy covers some wavelength ranges inaccessible from the ground, and yields accurate line and continuum flux calibrations; line fluxes from ground based IR slit spectroscopy have been hard to calibrate to better than a factor of 2 even in good conditions.
Science applications for IR spectroscopy, focusing on studying galaxies and AGN at z=1-3, include:
Star formation rates from H measurements, a missing link between SFRs from far-IR and from the UV. With H and H, enabled by G102+G141 coverage at , extinction can be measured as a function of galaxy properties such as SFR and stellar mass.
Sizes of the star forming regions. Slitless spectra yield effectively narrow-band images of galaxies in their emission lines. These can measure the brightness of star forming knots and whether z=1–2 galaxies form stars spread out in massive disks, or centrally concentrated, as might be expected in mergers, and can be compared to simulations of the clumpiness of SF in high-z disks. Such projects have begun, especially for bright galaxies, with 3D-HST depth (Nelson et al. 2012), but measuring sizes is difficult for fainter objects at low S/N and deeper data make a significant improvement.
Line diagnostics of AGN and metallicity. Grism spectra of [O III]/H yield a probe of AGN activity and of galaxy metallicity at (Trump et al. 2011), only studied in a handful of galaxies from the ground at these redshifts. AGN and low-metallicity galaxies could be separated by reference to X-ray detections, galaxy mass, or in some cases [S II]/H. The grism offers a unique chance to measure spatial variations in [O III]/H, and thus gradients on physical conditions or AGN emission, so far only possible in a stacked spectrum (Trump et al. 2011), but more feasible in deeper data.
Strong emission lines from starbursting and low metallicity galaxies. Some high-z galaxies have emission lines so strong that they produce unusual broadband colors, verified by grism spectra of [O III] (van der Wel et al. 2011). These likely represent short duration events in low mass and low metallicity galaxies and may be a clue to the nature of high-z galaxies, as well as an unusual and difficult-to-model population that could be a contaminant in color-selected high-z samples.
Galaxy environments and close pairs from densely sampled redshifts. The dense sampling to faint magnitudes enables detection of close galaxy pairs for studies of the pair fraction, interactions, and galaxy satellite properties. A dense spectroscopic redshift sample can measure galaxy environment in terms of local overdensity on Mpc scales more accurately than photo-zs, allowing studies of galaxy properties as a function of environment, and detection of groups. Field size needs to be close to a GOODS size to measure environments due to edge effects.
Spectroscopic calibration of photometric redshifts for faint galaxies. These extend to magnitude and redshifts poorly probed by existing spectra, critical for both galaxy evolution studies, and large dark energy programs relying on weak lensing.
Ly- emission lines at high redshift. The G102 spectra can detect Ly- from ; at this flux limit and area the expected sources are at a few times (Ouchi et al. 2010) and the volume is per , so one is sensitive to rare bright sources. G141 spectra could detect Ly- at , which would be of great scientific interest, but since the Ly- LF is unknown and likely to be fainter at high z, finding anything is highly uncertain.
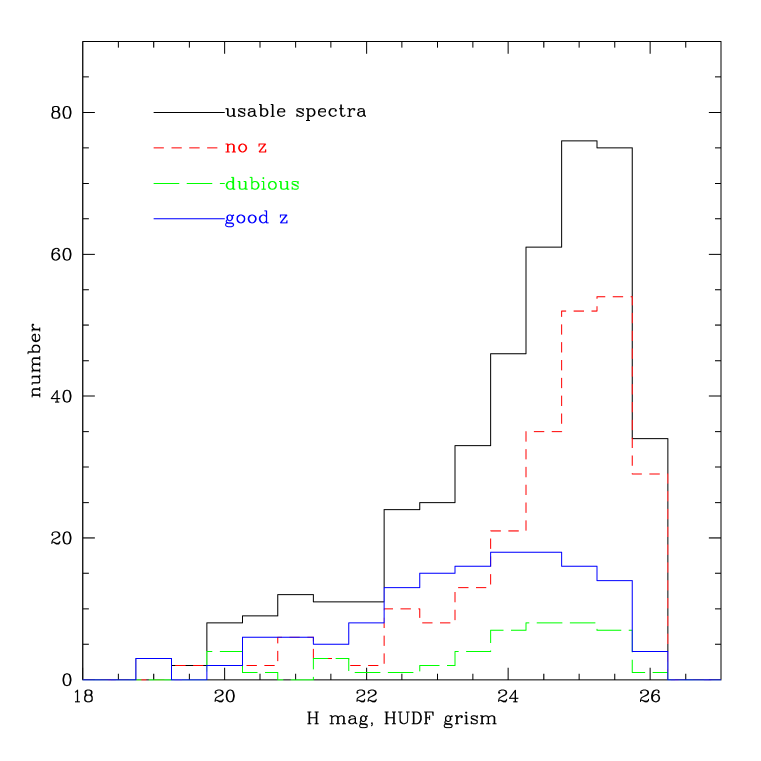
The capabilities of grism surveys are shown in Figures 1 and 2, which summarize a redshift catalog made from a grism observation from CANDELS SN followup, overlapping the HUDF 555Data taken as part of PID 12099, PI A. Riess, Rodney et al. 2012; used courtesy of the CANDELS collaboration.. The catalog is made by fitting redshifts to a G141 pointing of 6 and 4 orbit exposures at two roll angles, and using a visual inspection GUI for quality control, with photometric redshifts as an assist and to settle single-line identifications. In this 2x2′ field we found 144 good spectroscopic redshifts of which 87 are new, even in this heavily observed field. The catalog shows that secure redshifts can be measured down to and even a few at , although the yield is low. The real power of the grism comes in the range and where there are many new redshifts; it reaches mag below existing spectroscopy.
3 Survey design, data reduction, and cataloging practicalities
Previous large community surveys, especially those done with director’s discretionary time, have generally been imaging surveys like the Hubble Deep Field or Ultra-Deep Field, and various Treasury programs (GOODS, COSMOS, CANDELS, CLASH, PHAT, etc). Exceptions include UV spectroscopy Key Project/Treasury programs and the 3D-HST Treasury, which also had well-defined proposal teams. With imaging data, typically many scientists inside and outside the proposal teams have the experience to produce high quality reduced data and/or to produce scientifically useful catalogs from reduced imaging data.
For large spectroscopic projects (IR and UV), there are several groups with the capacity to reduce the data, but the reduction and cataloging ability is not as widespread as for imaging. For WFC3-IR grism data, I have found that, after some effort, it is possible to produce good quality spectra in a useful format with a combination of the aXe pipeline with close attention to its options and some custom code, and to fit redshifts to the spectra. But the most time consuming step is quality control of the spectra and redshift estimates, which so far has to be done by visual inspection with a GUI. I believe that other groups working on grism data have the same issue, and in the ground-based DEEP2 survey (Newman et al. 2012) we also found that inspecting the spectra was one of the most labor-intensive and arduous parts of the survey.
In moderately deep grism data there are of order 500-600 spectra per pointing worth inspecting to , so a 40-pointing survey has 20-25,000 spectra to look at. Clearly this is not something one wants every user of the survey to have to do, so if a survey were done with DD time it would be wise to provide resources and incentives to produce a public catalog and data release, as would be expected of the proposal team for an ordinary Treasury program.
4 Why now with HST
Any large infrared survey, imaging or spectroscopic, has to consider whether it will be instantly eclipsed by JWST observations, or whether it is valuable as a pathfinder for JWST. JWST/NIRSPEC has greater sensitivity at higher resolution than HST/WFC3-IR grisms. NIRSPEC requires assigning slits to objects, which causes it to fall below WFC3 in slit density by a factor of 4 or more: at , roughly 70-100 slits in 3.5′ x 3.5′, vs actual measured redshifts in a single WFC3 2.1′ x 2.1′ pointing (Figure 1). The efficiency of assigning slits is also usually closer to 50% than 100%. Thus to achieve equally dense sampling, redshift surveys with JWST/NIRSPEC will have to commit to visiting each tile of order 8 times or more, or revert to low spectra with NIRSPEC or NIRCAM/NIRISS grisms. I believe this will make JWST redshift surveys expensive enough that a moderate-area densely sampled survey will not be done immediately (while a very deep pointing for high-z galaxies will be).
This leads to the crux of the problem: the limited JWST lifetime. Experience with other surveys and telescopes shows that, for targeted spectroscopy, there is a significant turnaround time as the users figure out how to optimize survey design and what targets are most interesting. This is true even when the imaging for slit assignment already exists, as for example if JWST surveys a GOODS field. Phasing this turnaround against a yearly proposal cycle may place JWST spectroscopy in a race against mission lifetime. Pre-existing low-resolution spectra will be invaluable to give us an idea of what high resolution spectra will reveal, and determine what objects are most critical for followup – e.g. galaxies with unusual line fluxes or sizes, AGN candidates, X-ray or far-IR sources with interesting spectral properties; or compiling targets that sample the galaxy population in a statistically controlled way. A related example of this selection time delay in spectroscopy is the way that the fraction of time proposed for and assigned to the IRS spectrograph on Spitzer increased significantly in later cycles.
5 Conclusions
Moderately deep WFC3-IR grism surveys can produce large numbers of redshifts and emission line fluxes, of order 5000–10,000 redshifts in GOODS-sized fields, to faint IR magnitudes. These are extremely valuable for z=1-3 galaxy and AGN science, including probing star formation rates, AGN detection, and spatially resolved emission lines. A deep layer of IR grism spectroscopy is a component of deep-field extragalactic science that does not currently exist, unlike deep imaging. Determining whether such a large survey is better carried out through the regular proposal process or through DD time, or both, and what are the required resources ito make it useful to the community, are matters for the community, the working group on large programs, and HST management to decide.
References:
Atek, H. et al. 2010, ApJ, 723, 104
Brammer, G. et al. 2012, ApJS, 200, 13
Grogin, N.A. et al. 2011, ApJS, 197, 35
Nelson, E.J. et al. 2012, ApJL, 747, L28
Newman, J.A. et al. 2012, arXiv:1203.3192
Ouchi, M. et al. 2010, ApJ, 723, 869
Rodney, S.A. 2012, ApJ, 746, 5
Trump, J.R. et al. 2011, ApJ, 743, 144
van der Wel, A. et al. 2011, ApJ, 742, 111
van Dokkum, P. & Brammer, G. 2010, ApJL, 718, L73