An ALMA survey of Sub-millimetre Galaxies in the Extended Chandra Deep Field South: Detection of [Cii] at z = 4.4
Abstract
We present ALMA 870-m (345 GHz) observations of two sub-millimetre galaxies (SMGs) drawn from an ALMA study of the 126 sub-millimeter sources from the LABOCA Extended Chandra Deep Field South Survey (LESS). The ALMA data identify the counterparts to these previously unidentified sub-millimeter sources and serendipitously detect bright emission lines in their spectra which we show are most likely to be [Cii] 157.74 m emission yielding redshifts of = 4.42 and = 4.44. This blind detection rate within the 7.5-GHz bandpass of ALMA is consistent with the previously derived photometric redshift distribution of SMGs and suggests a modest, but not dominant ( 25%), tail of 870-m selected SMGs at 4. We find that the ratio of / in these SMGs is much higher than seen for similarly far-infrared-luminous galaxies at 0, which is attributed to the more extended gas reservoirs in these high-redshift ULIRGs. Indeed, in one system we show that the [Cii] emission shows hints of extended emission on 3 kpc scales. Finally, we use the volume probed by our ALMA survey to show that the bright end of the [Cii] luminosity function evolves strongly between = 0 and 4.4, reflecting the increased ISM cooling in galaxies as a result of their higher star-formation rates. These observations demonstrate that even with short integrations, ALMA is able to detect the dominant fine structure cooling lines from high-redshift ULIRGs, measure their energetics, spatially resolved properties and trace their evolution with redshift.
keywords:
galaxies: starburst, galaxies: evolution, galaxies: high-redshift1 Introduction
A significant fraction of the obscured star formation at arises from the most luminous galaxies (e.g. Blain et al., 1999; LeFloc’h et al., 2009): ultra-luminous infrared galaxies (ULIRGs; Sanders & Mirabel 1996) with bolometric luminosities of 1012-13 L⊙ and star-formation rates 100–1000 M⊙ yr-1. At high redshift, these galaxies are some of the brightest sources in the sub-millimetre wave-band and so are frequently called “sub-millimetre galaxies” (SMGs).
The spectral energy distribution (SED) of the dust emission in these luminous dusty galaxies has a Rayleigh-Jeans tail that produces a negative K-correction in the sub-millimetre wave-band, yielding a near constant flux density–luminosity dependence with redshift over the range 1–6 (Blain et al., 2002). Although the volume density of the SMG population evolves rapidly with redshift, (showing a 1000-fold increase in the space density over the 10 Gyrs to 2.5; Chapman et al. 2005), the volume density appears to subsequently decline above 3. This decline is not a result of a reduction in their apparent flux density in the sub-millimetre, but a real reduction in the volume density of SMGs (Wardlow et al., 2011).
However, determining the precise strength of the decline in the SMG volume density requires locating the counterparts of high-redshift SMGs. This is problematic due to the poor resolution of single dish sub-millimetre maps, which means that SMGs have to be identified through correlations between their sub-millimetre emission and that in other wave-bands where higher spatial resolution is available (usually the radio and/or mid-infrared e.g. Ivison et al. 2002; Chapman et al. 2004; Ivison et al. 2007; Pope et al. 2006). These identifications are probabilistic as they rely on empirical correlations that have both significant scatter and which may evolve with redshift (e.g. Carilli & Yun, 2000). Moreover, the SEDs in these other wave-bands have positive K-corrections and hence can miss the highest redshift counterparts. Indeed in sub-millimetre surveys typically 30–50% of SMGs lack “robust” counterparts in the radio or mid-infrared, and these may represent an unidentified tail of high-redshift SMGs (e.g. Biggs et al. 2011, see also Lindner et al. 2011). To circumvent this problem requires identifying SMGs using sub-/millimetre interferometers (e.g. Gear et al., 2000; Frayer et al., 2000), but until recently their sensitivity has been too low to locate large numbers of SMGs (e.g. Dannerbauer et al., 2002; Younger et al., 2007; Wang et al., 2011; Smolčić et al., 2012). However, with the commissioning of the Atacama Large Millimeter Array (ALMA), we can now construct the large samples of precisely-located SMGs needed to unambiguously study their properties and test galaxy formation models.
Whilst the bulk of the bolometric emission from SMGs is radiated through continuum emission from dust grains in the rest-frame far-infrared, superimposed on this are a series of narrow atomic and molecular emission lines. By far the strongest of these arise from the atomic fine-structure transitions of Carbon, Nitrogen and Oxygen in the far-infrared, along with weaker, but more commonly-studied molecular lines visible at millimetre wavelengths (e.g. 12CO, HCN). These bright emission lines are an important pathway by which the dense gas in these galaxies cools, and so provide a unique tracers of the star-formation process in these galaxies.
The brightest and best-studied of the atomic lines in the far-infrared is the – fine structure line of singly ionised carbon at 157.74-m (here-after [Cii]). Much of the [Cii] emission from galaxies arises from the warm and dense photo-disassociation regions (PDRs) that form on the UV-illuminated surface of molecular clouds, although the [Cii] flux from diffuse Hii regions or from cool, diffuse interstellar gas can also be significant (e.g. Madden et al., 1993; Lord et al., 1996). The [Cii] emission line therefore provides an indication of the gas content and the extent of the gas reservoir in a galaxy. Far-infrared surveys of low-redshift galaxies from the Kuiper Airborne Observatory and ISO have shown that the [Cii] line can comprise % of the total bolometric luminosity (Stacey et al., 1991; Brauher et al., 2008; Graciá-Carpio et al., 2011). This bright line is thus ideally suited for deriving redshifts for obscured galaxies and investigating their dynamics and star-formation properties.
Early searches for [Cii], by necessity, focused on the highest-redshift far-infrared sources, 4, where the [Cii] line is shifted into the atmospheric windows in the sub-millimetre (e.g. Ivison et al., 1998; Maiolino et al., 2005, 2009; Wagg et al., 2010). Most of these sources host powerful AGN (as well as being ULIRGs) and it was noted that their [Cii] lines were weak relative to , demonstrating the same behavior as seen in AGN-dominated ULIRGs in the local Universe. However, more recent observations of the [Cii] emission in high redshift star-formation dominated ULIRGs has shown that the [Cii] emission can be as bright as in local, low-luminosity galaxies, / 0.1–1% (e.g. Hailey-Dunsheath et al., 2008; Ivison et al., 2010b; Stacey et al., 2010; Valtchanov et al., 2011). This has been interpreted as due to the lower ionisation field arising from more widely distributed star-formation activity within these systems, in contrast to the compact nuclear star formation seen in low-redshift ULIRGs (e.g. Sakamoto et al., 2008). The strength of [Cii] (and other atomic lines), and its relative strength to the far-infrared luminosity can therefore be used to probe the physical properties of the interstellar medium in high-redshift galaxies.
We have recently undertaken an ALMA Cycle 0 study at 870m (345 GHz) of the 126 sub-millimeter sources located in the 0.5∘ 0.5∘ LABOCA Extended Chandra Deep Field South Survey (“LESS”; Weiß et al. 2009), the most uniform sub-millimetre survey of its kind to date. These ALMA data yield unambiguous identifications for a large fraction of the sub-millimeter sources, directly pin-pointing the SMG responsible for the sub-millimetre emission to within 0.2′′ (Hodge et al. 2012, in prep), without recourse to statistical radio/mid-infrared associations. In this letter, we present ALMA observations of two of the SMGs from our survey for which we are able to derive their redshifts from serendipitous identification of the [Cii] emission line in the ALMA data-cubes. We use the data to measure the energetics of the dominant fine structure lines, search for spatially resolved velocity structure and to provide an estimate of the evolution of the [Cii] luminosity function with redshift. We adopt a cosmology with 0.73, 0.27, and 72 km s-1 Mpc-1 in which 1′′ corresponds to a physical scale of 6.7 kpc at 4.4.
2 Observations and Reduction
Observations of the 126 sub-millimeter sources in the LESS survey were obtained with ALMA at 345 GHz (Band 7) with a dual polarisation setup in the compact configuration, yielding a synthesised beam of 1.81.2′′. Our observations cover 7.5 GHz band-width, split between the upper- and lower-sidebands, 336.1–339.8 GHz and 348.1–351.9 GHz. The observations employed 15 antennae and data for these two sources were obtained between 2011 October and 2011 November in good conditions, PWV 0.5 mm. The primary beam of the ALMA dishes, 18′′ FWHM at our observing frequency, is sufficient to encompass the error-circles of the SMGs from the LESS maps, 5′′ (Weiß et al., 2009), even in confused situations. The observing frequency was selected to match the original LABOCA discovery map to ensure that the ALMA and LABOCA flux densities could be easily compared. Each galaxy was observed for a total of 120 seconds, with phase, bandpass and flux calibration based on J0403-360, J0538-440 and Mars, respectively. The data were processed with the Common Astronomy Software Application (CASA; McMullin et al. 2007), and we constructed both velocity integrated maps and datacubes with 62.5 MHz (54.5 km s-1) binning. The velocity integrated continuum maps for the two sources discussed here reach noise levels of = 0.44 and 0.42 mJy beam-1 for LESS 61 and LESS 65 respectively. This is a factor 3 more sensitive than the original LABOCA discovery map, while more critically the beam is 150 smaller in area than that of LABOCA (with a corresponding reduction in the positional uncertainty of detected sources). In the datacubes, the r.m.s. sensitivity is 3.8 mJy beam-1 per 54.5 km s-1 (62.5 MHz) channel. The full catalog of the ALMA SMGs will be published in Hodge et al. (2012, in prep), whilst the ALMA 870m counts and multi-wavelength properties of the ALMA SMGs will be published in Karim et al. (2012, in prep) and Simpson et al. (2012, in prep).
| ALESS 61.1 | ALESS 65.1 | |
|---|---|---|
| IDa | J033245.6280025 | J033252.4273527 |
| R.A. (ALMA)b | 03 32 45.87 | 03 32 52.26 |
| Dec. (ALMA)b | 28 00 23.3 | 27 35 26.3 |
| S870 (LABOCA) | 5.8 1.2 | 5.9 1.2 |
| S870 (ALMA)c | 4.32 0.44 | 4.24 0.49 |
| 0.365m | 1.2 10-4 | 9.9 10-5 |
| 0.350m | 9.9 10-5 | 9.9 10-5 |
| 0.460m | 5.7 10-5 | 1.8 10-4 |
| 0.538m | 6.9 10-5 | 3.6 10-4 |
| 0.651m | 6.3 10-5 | 6.3 10-5 |
| 0.833m | 4.7 1.1 10-4 | 1.2 10-3 |
| 0.850m | 8.5 1.0 10-4 | 3.6 10-4 |
| 0.903m | 7.3 1.6 10-4 | 2.4 10-3 |
| 2.2m | 3.0 0.3 10-3 | 2.7 10-3 |
| 3.6m | 3.3 0.3 10-3 | 2.1 0.2 10-3 |
| 4.5m | 3.9 0.2 10-3 | 1.4 0.2 10-3 |
| 5.8m | 2.7 1.0 10-3 | 1.4 1.0 10-3 |
| 8.0m | 5.4 0.7 10-3 | 3.0 0.8 10-3 |
| 24m | 0.036 0.002 | 0.006 |
| 250m | 4.3 1.5 | 2.7 |
| 350m | 7.4 1.6 | 7.6 1.4 |
| 500m | 10.2 1.7 | 10.2 1.5 |
| 1.4 GHz | 0.025 | 0.025 |
Notes: All flux densities are in mJy and all
limits are 3.
a LESS ID from the LABOCA catalog in
Weiß et al. (2009). b Co-ordinates in J2000. c The ALMA flux
densities have been primary beam corrected (the primary beam
corrections are a factor 1.12 and 1.04 for ALESS 61.1 and
ALESS 65.1 respectively). The +IRAC photometry comprises
VIMOS (), MUSYC (), HST (); HAWK-I
() and IRAC 3.6–8m imaging (see Wardlow et al., 2011, for
details). The Herschel SPIRE photometry is
measured using archival imaging and the photometry has been
de-blended for nearby sources. The radio flux density limits are
taken from the VLA 1.4 GHz imaging used in Biggs et al. (2011).
3 Analysis and Discussion
Wardlow et al. (2011) derive a photometric redshift distribution for the statistically identified radio- and mid-infrared counterparts of the LESS sub-millimeter sources, deriving a median = 2.5 0.5. Taking the errors on the redshifts into account, we expect 3.5 0.5 SMGs should have far-infrared fine structure lines (such as [Cii] 157.74m, [Oi] 145m, [Nii] 122m or [Oiii] 88 m) within the 7.5 GHz bandwidth of ALMA. By far the brightest of these lines in local ULIRGs is the [Cii] emission line, with a median equivalent width 10 brighter than any of the other lines (Brauher et al., 2008). Focusing just on [Cii], we expect 1.50.5 SMGs in our sample will have detectable [Cii] emission in the ALMA band-pass, with corresponding redshift ranges of = 4.399–4.461 and = 4.590–4.656 for the upper and lower-side bands.
As an initial step in our analysis of the ALMA maps of the LESS sub-millimeter sources, we exploit the frequency coverage of our observations to search for emission lines in the datacubes. For each 4- SMG in the velocity-integrated ALMA maps within the primary beam, we extract the spectra and search for emission lines by attempting to fit a Gaussian emission line profile to the spectrum, only accepting the fit if the provides a significant improvement ( 25, or 5) over a continuum-only fit.
3.1 Source Identification
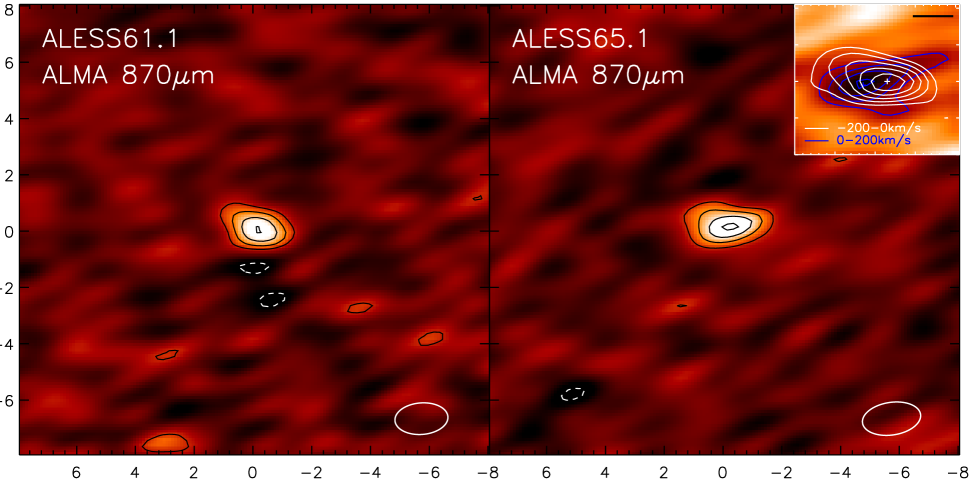
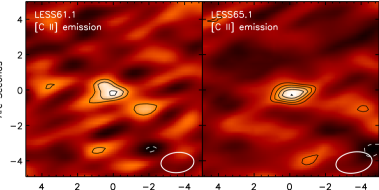
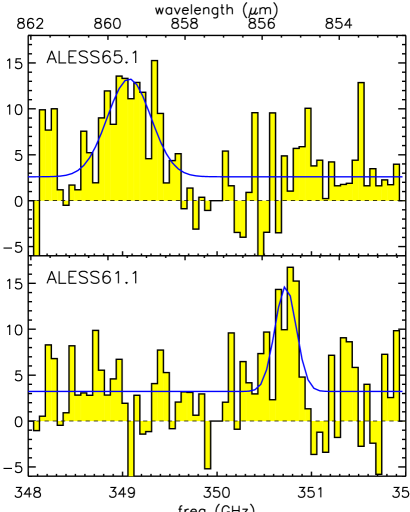
In two sub-millimeter sources, LESSJ033245.6280025 and LESSJ033252.4273527 (hereafter ALESS 61.1 and ALESS 65.1, respectively following the notation in Hodge et al. 2012, in prep), we identify bright emission lines with FWHM 230 25 and 490 35 km s-1 respectively in the spectra of these SMGs. The significance of the emission lines (integrated over the line) is S / N 5.3 and 7.0 for ALESS 61.1 and ALESS 65.1 respectively. In Fig. 1 we show the velocity-integrated (continuum plus line) ALMA maps of ALESS 61.1 and ALESS 65.1 while the spectra are shown in Fig. 3. To highlight the emission line detections in both ALMA SMGs, in Fig. 2 we also show the continuum subtracted emission line maps. In this figure, the map is made by integrating the continuum subtracted cube over 2 FWHM of the emission line.
In both cases, the LABOCA 870m source is identified with a single high signal-to-noise (S / N 8) ALMA SMG in the velocity integrated maps that is located to within 0.2′′ (after centroiding) and 3–4′′ from their nominal LABOCA positions (Weiß et al., 2009). Biggs et al. (2011) could not identify robust or tentative counterparts for either of these sub-millimeter sources (see also Wardlow et al., 2011) as no SMGs were detected at 1.4 GHz (3 25 Jy at 1.4 GHz). Both sources are very faint in the Herschel/SPIRE imaging at 250, 350, and 500 m (the SMGs are weakly detected after de-blending nearby sources using the 24m and radio as priors; Table 1). The ALMA maps reveal that ALESS 61.1 is associated with a weak 24 m source that is also visible in the optical–mid-infrared, but ALESS 65.1 does not have any counterparts in the optical or near-infrared and is only detected weakly in the Spitzer IRAC imaging. Together, this suggest that these galaxies lie at 3.5 (Wardlow et al., 2011). With the current data, we find no evidence for strong gravitational lensing of either of these galaxies.
3.2 Line Identification
If the emission lines we identified are indeed [Cii], then our data indicate redshifts of = 4.419 and = 4.445 for ALESS 61.1 and ALESS 65.1 respectively. The rest-frame equivalent widths of the emission lines are 0.44 0.06m and 1.12 0.15 m, similar to the median equivalent width of [Cii] in local LIRGs and ULIRGs ( = 0.76 0.06m; Brauher et al. 2008). We note that in the 7.5 GHz spectral coverage at 345 GHz, the emission lines contribute 10–40% of the continuum emission in the velocity integrated cubes, as predicted by Smail et al. (2011).
We caution that there are other possible identifications for these lines. In particular, the emission could also be [Oi] 145m ( 4.9), [Nii] 122m (), [Nii] 205m () or much higher redshift, [Oiii] 88 m (). However, the luminosities of these fine structure lines are expected to be a factor 10 fainter than the [Cii] emission (e.g. Brauher et al. 2008; Walter et al. 2009b; Nagao et al. 2012; Decarli et al. 2012).
Alternatively, the emission line could also be high- 12CO at lower redshift (i.e. = 1.3, 1.6, 2.0 and 2.3 for = 7, 8, 9, 10 respectively). However, the implied emission line luminosities (L = 1–7 108 L⊙) are a factor 10 higher than the 12CO line luminosities of any local or high-redshift starbursts or AGN. For example, Mrk 231 has a maximum 12CO luminosity (across all 12CO lines) of 3 107 L⊙ (van der Werf et al., 2010), whilst APM 08279, a well studied high-redshift far-infrared luminous QSO has a 12CO(9–8) luminosity L 1 108 L⊙. Moreover, if the line high- 12CO (presumably therefore a galaxy with an AGN), then the gas temperature must be high ( 300 K if the 12CO spectral line energy distribution peaks beyond = 7). Yet the characteristic dust temperature would have to be 15–25 K (for a dust emissivity of = 1.5–2.0). In addition, if these SMGs are lower-redshift ( 1–3) starbursts or AGN, then these SMGs also lie significantly off the far-infrared–radio correlation (Condon et al., 1991; Ivison et al., 2010a).
Taken together, we suggest that the line is most likely a fine structure transition, and given the brightness and equivalent width, probably [Cii]. We note that although the redshifts of these two sources are similar ( 1500 km s-1), they are separated by 25 arcminutes on the sky (physical distance of 10 Mpc) and so they are not physically associated.
3.3 Broad Band Spectral Energy Distribution
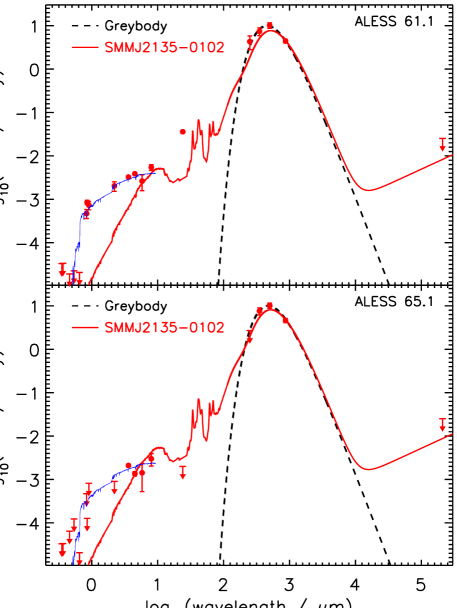
We show in Fig. 4 the observed broad-band SED for both galaxies. We overlay the SED of the well-studied = 2.3 starburst SMM J21350102 (Swinbank et al., 2010; Ivison et al., 2010b) redshifted to = 4.4 and normalised to the 870m photometry. This demonstrates that at 4.4, the 250, 350 and 500m colours and 1.4 GHz of these galaxies are consistent with the expected colours of 4 ULIRGs (assuming the properties of ULIRGs at 4 are the same as those at 2; Schinnerer et al. 2008; Coppin et al. 2009; Daddi et al. 2009; Capak et al. 2008).
We fit a modified black-body to the far-infrared photometry, deriving estimates of the far-infrared (rest-frame 8–1000m) luminosities of = (2.1 0.4) 1012 L⊙ and = (2.0 0.4) 1012 L⊙, for ALESS 61.1 and ALESS 65.1 respectively (corresponding to star-formation rates of 500 M⊙ yr-1; Kennicutt 1998).
To estimate the near-infrared luminosities of these systems, we use the rest-frame UV–mid-infrared SEDs. We fit elliptical, Sb, single burst and constant star-formation rate spectral templates from Bruzual & Charlot (2003) to the 0.3–8-m photometry (Table 1 and Fig. 4) using hyper-z (Bolzonella et al., 2000) at the known redshift. We allow reddening of A 0–5 in steps of 0.2 and over-plot the best-fitting SED models in Fig. 4. We then calculate the rest-frame -band magnitude (observed 8 m at 4.4), which is less influenced by young stars than rest-frame UV or optical bands and is relatively unaffected by dust. We derive absolute rest-frame -band magnitudes of = 24.8 0.2 and = 24.2 0.3 for ALESS 61.1 and ALESS 65.1, respectively (Table 2). These are comparable to the average -band magnitudes for radio-identified sub-millimeter source counterparts at 3 ( = 24.1 0.9; Wardlow et al. 2011), the bulk of which are expected to be SMGs (Smail et al. 2012, in prep).
Owing to the catastrophic degeneracies between star-formation history, age and reddenning in SED fitting for dusty sources, to estimate the stellar masses we adot a simple approach. Following Hainline et al. (2009) and Wardlow et al. (2011) we use the -band magnitude together with an average mass-to-light ratio for a likely SMG star-formation history. Hainline et al. (2009) estimate a -band mass-to-light ratio for SMGs (with burst and constant star-formation templates), deriving an average / 3.8 / (for a Salpeter IMF). This suggests an stellar mass for ALESS 61.1 and ALESS 65.1 of 1.5 1011 and 9 1010 M⊙ respectively, comparable to previous estimates for SMG stellar masses (e.g. Hainline et al., 2009; Wardlow et al., 2011). However, we caution that Wardlow et al. (2011) show that the uncertainties in the derived spectral types and ages result in an estimated factor of 5 uncertainty in assumed mass-to-light ratios and thus stellar masses.
3.4 The [Cii] properties
The [Cii] luminosities of our two SMGs, = 1.5–3.2 109 L⊙, are comparable to the luminosities of other high-redshift ULIRGs and QSOs (e.g. Maiolino et al. 2009; Walter et al. 2009a; Wagg et al. 2010; Ivison et al. 2010b; De Breuck et al. 2011; Walter et al. 2012). We can crudely estimate the molecular gas mass for these galaxies using the average [Cii] / 12CO(1–0) emission line ratio ( / = 44001000) from a sample of ten = 2–4 starbursts (e.g. Hailey-Dunsheath et al., 2010; Ivison et al., 2010b; Stacey et al., 2010; De Breuck et al., 2011), although we caution that there is significant scatter in the CO/[Cii] luminosity ratio (e.g. Fig. 5 of Stacey et al. 2010 shows that there is a range of / of approximately 1 dex). Nevertheless, from this compilation of high-redshift observations, the conversion between [Cii] line luminosity and molecular gas mass scales approximately as = 102 ( / ), suggesting a molecular gas mass for these two SMGs of = 1–4 1010 M⊙. This molecular gas mass is comparable to the median gas mass implied for SMGs at = 2, = 511010 M⊙ (Bothwell et al., 2012). Of course, direct measurements of the low- CO emission are required to provide a more reliable estimate of the gas mass in these systems.
We can also combine the [Cii] and far-infrared luminosities to derive a ratio of / = (7.1 1.6) 10-4 and (16.0 3.7) 10-4 for LESS 61.1 and LESS 65.1 respectively. As Fig. 5 shows, in local luminous star-forming galaxies the ratio of / declines by a factor 100 over three orders of magnitude in far-infrared luminosity (with a factor 3 scatter at any ). This “[Cii] deficit” in local ULIRGs has a number of possible explanations, including enhanced contribution from continuum emission in dusty, high-ionisation regions (Luhman et al., 1998, 2003), high-ionisation effects in the dense environments (Abel et al., 2009) or enhanced contributions to the infrared luminosity from AGN (Sargsyan et al., 2012).
The ratio we derive for the two 4.4 SMGs is a factor 10 higher than expected for 0 ULIRGs with their far-infrared luminosity (Fig. 5), although the high / is similar to other high-redshift galaxies of comparable far-infrared luminosity (e.g. Stacey et al. 2010; Cox et al. 2011; Walter et al. 2012). This has been interpreted as evidence that the molecular emission does not reside in a single, compact region illuminated by an intense UV radiation field (as is a good approximation for local ULIRGs), but rather that the [Cii] reservoir is more extended, with the high L[CII] / LFIR ratio reflecting the lower density of this extended medium (e.g. Abel et al., 2009; Hailey-Dunsheath et al., 2010; Graciá-Carpio et al., 2011). This interpretation is also consistent with high-resolution studies of SMGs, which have shown that the dust emission and gas reservoirs can be extended over several kilo-parsecs (e.g. Biggs & Ivison, 2008; Younger et al., 2008; Tacconi et al., 2008; Ivison et al., 2011; Swinbank et al., 2011) and studies of their mid-infrared colors and spectral properties (Menéndez-Delmestre et al., 2007; Hainline et al., 2009). As we will show in §3.5, the [Cii] emission in ALESS 65.1 appears to show velocity structure, and we determine that the [Cii] reservoir may be extended across 3 kpc, consistent with this interpretation.
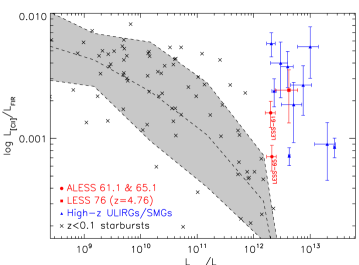
Finally, we note that since the [Cii] transition is a primary coolant within the PDRs, it provides a probe of the physical conditions of the gas and interstellar radiation field (e.g. Hollenbach & Tielens, 1999; Wolfire et al., 2003). We can therefore use the [Cii] and far-infrared luminosity together with the PDR models of Kaufman et al. (1999) to place upper limits on the far-UV radiation field strength and characteristic density of star-forming regions within the ISM. The [Cii]/ ratio of our two galaxies, / = 7.1–16 10-4, suggests a mean interstellar far-UV radiation field strength (G) 3000 that of Milky-Way and H2 density 105.5 cm-3 (e.g. Danielson et al. 2011; see also Hailey-Dunsheath et al. 2010 and Stacey et al. 2010). The far-UV field strength limit derived in this way is comparable to that estimated using starburst99, which suggests that a 500 M⊙ yr-1 starburst produces a luminosity of 5 1045 erg s-1 at a wavelength of 1000 Å or a flux density of 10 that of the Milky Way for a source with physical extent of 3 kpc (adopting a far-UV field strength between 912–1103Å for the Milky Way of 1.6 10-3 erg s-1 cm-2).
| ALESS 61.1 | ALESS 65.1 | |
|---|---|---|
| 350.726 0.034 m | 349.073 0.032 m | |
| 4.4189 0.0004 | 4.4445 0.0005 | |
| 2.5 0.4 Jy km s-1 | 5.4 0.7 Jy km s-1 | |
| FWHM | 230 25 km s-1 | 470 35 km s-1 |
| (1.5 0.3) 109 L⊙ | (3.2 0.4) 109 L⊙ | |
| (2.1 0.4) 1012 L⊙ | (2.0 0.4) 1012 L⊙ | |
| 24.8 0.2 | 24.2 0.3 | |
| (5.9 1.0) 1011 L⊙ | (3.4 0.8) 1011 L⊙ | |
| 1.5 1011 M⊙ | 9.0 1010 M⊙ |
Notes: The ALMA data have been primary beam corrected before calculating luminosities. The primary beam corrections are 1.12 and 1.04 for ALESS 61.1 and ALESS 65.1 respectively).
3.5 Internal structure
Given the spatial resolution of our observations (1.4′′ FWHM), we search for spatially resolved emission and velocity structure within these two SMGs. From the ALMA data of LESS 65, the total flux of the galaxy ( = 4.24 0.49 mJy) is marginally higher than the peak flux in the map ( = 3.60 0.49 mJy beam-1) indicating that the source may be marginally resolved. Using the [Cii] emission in this galaxy, we examine whether there is any evidence for velocity structure by comparing the spatial distribution of the integrated [Cii] emission between 210–0 km s-1 and 0–210 km s-1 (i.e. FWHM relative to the systemic redshift in the continuum subtracted cube). By centroiding the two maps we derive a spatial offset of 3.3 1.7 kpc between the redshifted and blue-shifted emission (Fig. 1). Although tentative, this spatial extent is similar to the [Cii] spatial extent of the bright 5 SMG HDF 850.1 where similar data are available (Walter et al., 2012), and also to the high- 12CO molecular emission FWHM (4 kpc) from a sample of eight SMGs at (Tacconi et al., 2006). If the spatial offset in ALESS 65.1 represents rotating gas, then we estimate a mass M 3.5 1010 sin, which is consistent with the implied gas and stellar mass estimates.
3.6 The evolution of the [Cii] luminosity function
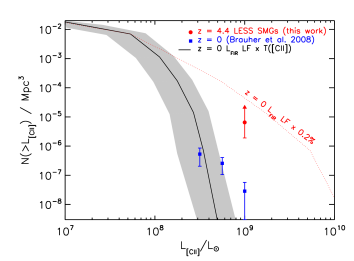
Since our ALMA survey has followed up all of the LESS SMGs, we can use the detection rate to investigate the evolution of the [Cii] luminosity function. In the following we assume that all of the [Cii]-emitting galaxies in the = 0.12 volume covered by our observations were detected and so we stress that these calculations yield only a lower-limit on the volume density of high-redshift [Cii]-emitters.
To estimate the 0 [Cii] luminosity function, we start from the 0 far-infrared luminosity function of Sanders et al. (2003) and initially assume a constant / = 0.002 (Fig. 5). This provides a firm upper limit to the bright end of 0 [Cii] luminosity function, given the observed decline in / at high (Fig. 5). We can then use the correlation of / with from Brauher et al. (2008) (see also Fig. 5) to provide a more reliable estimate. We show our best estimate of the 0 [Cii] luminosity function in Fig. 5, including the expected dispersion due to the scatter in the local / – relation.
To assess the reliability of this 0 [Cii] luminosity function we attempt to independently derive this using the Brauher et al. (2008) study of [Cii] emission in a sample of 227 0.05 galaxies from the ISO archive. The parent population of this study can be approximated by an IRAS 100-m selected sample at 0.05 with flux densities between S 1–1000 Jy. There are 11,000 IRAS sources within this redshift and flux density range and so we must account for the incompleteness in the Brauher et al. (2008) sample to derive the 0 [Cii] luminosity function. We start by assuming the Brauher et al. (2008) sample is a random subset of the parent population (although we note it is likely that apparently bright sources are over-represented in the sample, and fainter sources correspondingly under-represented). We then only consider IRAS sources with flux densities 10 Jy where the fraction of galaxies observed in the Brauher et al. (2008) sample is 3% of the parent population and then calculate the fraction of galaxies in the Brauher et al. (2008) sample compared to the number of IRAS galaxies at 0.05 in bins of 100-m flux density and redshift. We use these sampling fractions to correct the apparent [Cii] luminosity function within 0.05 (a comoving volume of 0.035 Gpc3) and show these data in Fig. 5.
Whilst the local data from Brauher et al. (2008) comprise a complex mix of observations derived from a number of studies, the data are broadly consistent with the bright end of the 0 [Cii] luminosity function we derived above from the far-infrared luminosity function and / transfer function.
To place the new ALMA-identified = 4.4 SMGs on this plot, we estimate the volume covered by our observations of ECDFS by considering that the brightest [Cii] emitters will correspond to the brightest far-infrared sources (i.e. SMGs). The LESS SMGs are located within a 0.5 0.5∘ region and assuming our ALMA observations cover the [Cii] with a redshift range of = 0.12 at 4.4, we derive a comoving volume of 2.9 105 Mpc3. Finding two galaxies in this volume with [Cii] luminosities 1 109 L⊙ indicates a 1000 factor increase in the number density of luminous [Cii] emitters from 0–4.4. This is equivalent to a 3–4 [Cii] luminosity evolution between = 0–4.4 which is consistent with the evolution in the far-infrared luminosity function (factor 3 in for a fixed volume density of = 10-5 Mpc-1; Wardlow et al. 2011) between = 0 and = 3, although since the far-infrared luminosity function declines beyond = 3, the [Cii] luminosity function may peak at lower redshift than probed by our observations here.
4 Summary
We have undertaken an ALMA study of 126 sub-millimetre sources from the LABOCA 870m survey of the ECDFS (Weiß et al., 2009). We focus here on two high-redshift SMGs that are precisely located by our high resolution ALMA continuum observations and whose ALMA spectra detect bright emission lines. We interpret these lines as the far-infrared atomic fine structure line [Cii] 157.74, indicating redshifts of = 4.4 for both galaxies. We show that the ratio of / is higher than comparably luminous galaxies at = 0, but consistent with the ratio seen in other high-redshift ULIRGs. We interpret this as evidence that the molecular emission is extended and indeed, in one of our SMGs our data suggest that the [Cii] is resolved on 3 kpc scales. Given the volume probed by our observations, we show that the [Cii] luminosity function must evolve strongly across the 12 Gyrs between = 0 and 4.
These results show that the wide spectral baseline coverage of ALMA provides the opportunity to measure blind redshifts of large samples of distant, obscured galaxies through the detection of fine structure emission lines, such as [Cii], in short exposure times.
acknowledgments
We would like to thank the anonymous referee for a thoughtful and constructive report which improved the content and clarity of this paper. The ALMA observations were carried out under program 2011.0.00294.S. ALMA is a partnership of ESO (representing its member states), NSF (USA) and NINS (Japan), together with NRC (Canada) and NSC and ASIAA (Taiwan), in cooperation with the Republic of Chile. The Joint ALMA Observatory is operated by ESO, AUI/NRAO and NAOJ. This publication is also based on data acquired with the APEX under programme IDs 078.F-9028(A), 079.F-9500(A), 080.A-3023(A) and 081.F-9500(A). APEX is a collaboration between the Max-Planck-Institut fur Radioastronomie, the European Southern Observatory and the Onsala Space Observatory. This research also made use of data from the HerMES Key Programme from the SPIRE instrument team, ESAC scientists and a mission scientist. Herschel is an ESA space observatory with science instruments provided by European-led Principal Investigator consortia and with important participation from NASA. AMS gratefully acknowledges an STFC Advanced Fellowship. IRS acknowledges support from STFC and a Leverhume Fellowship. KEKC acknowledges support from the endowment of the Lorne Trottier Chair in Astrophysics and Cosmology at McGill, the Natural Science and Engineering Research Council of Canada (NSERC), and a L’Oréal Canada for Women in Science Research Excellence Fellowship, with the support of the Canadian Commission for UNESCO. TRG acknowledges the Science and Technologies Facilities Council as well as IDA and DARK.
References
- Abel et al. (2009) Abel, N. P., Dudley, C., Fischer, J., Satyapal, S., & van Hoof, P. A. M. 2009, ApJ, 701, 1147
- Biggs & Ivison (2008) Biggs, A. D. & Ivison, R. J. 2008, MNRAS, 385, 893
- Biggs et al. (2011) Biggs, A. D., Ivison, R. J., Ibar, E., Wardlow, J. L., Dannerbauer, H., Smail, I., Walter, F., & Weiß, A. et al. 2011, MNRAS, 413, 2314
- Blain et al. (1999) Blain, A. W., Smail, I., Ivison, R. J., & Kneib, J.-P. 1999, MNRAS, 302, 632
- Blain et al. (2002) Blain, A. W., Smail, I., Ivison, R. J., Kneib, J.-P., & Frayer, D. T. 2002, PhR, 369, 111
- Bolzonella et al. (2000) Bolzonella, M., Miralles, J.-M., & Pelló, R. 2000, A&A, 363, 476
- Bothwell et al. (2012) Bothwell, M. S., Smail, I., Chapman, S. C., Genzel, R., Ivison, R. J., Tacconi, L. J., Alaghband-Zadeh, S., & Bertoldi, F. et al. 2012, ArXiv e-prints
- Brauher et al. (2008) Brauher, J. R., Dale, D. A., & Helou, G. 2008, ApJS, 178, 280
- Bruzual & Charlot (2003) Bruzual, G. & Charlot, S. 2003, MNRAS, 344, 1000
- Capak et al. (2008) Capak, P., Carilli, C. L., Lee, N., Aldcroft, T., Aussel, H., Schinnerer, E., Wilson, G. W., & Yun, M. S. et al. 2008, ApJL, 681, L53
- Carilli & Yun (2000) Carilli, C. L. & Yun, M. S. 2000, ApJ, 530, 618
- Carral et al. (1994) Carral, P., Hollenbach, D. J., Lord, S. D., Colgan, S. W. J., Haas, M. R., Rubin, R. H., & Erickson, E. F. 1994, ApJ, 423, 223
- Chapman et al. (2005) Chapman, S. C., Blain, A. W., Smail, I., & Ivison, R. J. 2005, ApJ, 622, 772
- Chapman et al. (2004) Chapman, S. C., Smail, I., Windhorst, R., Muxlow, T., & Ivison, R. J. 2004, ApJ, 611, 732
- Colbert et al. (1999) Colbert, J. W., Malkan, M. A., Clegg, P. E., Cox, P., Fischer, J., Lord, S. D., Luhman, M., & Satyapal, S. et al. 1999, ApJ, 511, 721
- Condon et al. (1991) Condon, J. J., Anderson, M. L., & Helou, G. 1991, ApJ, 376, 95
- Coppin et al. (2009) Coppin, K. E. K., Smail, I., Alexander, D. M., Weiss, A., Walter, F., Swinbank, A. M., Greve, T. R., Kovacs, A., & De Breuck, C. et al. 2009, MNRAS, 395, 1905
- Cox et al. (2011) Cox, P., Krips, M., Neri, R., Omont, A., Güsten, R., Menten, K. M., Wyrowski, F., & Weiß, A. et al. 2011, ApJ, 740, 63
- Daddi et al. (2009) Daddi, E., Dannerbauer, H., Krips, M., Walter, F., Dickinson, M., Elbaz, D., & Morrison, G. E. 2009, ApJL, 695, L176
- Danielson et al. (2011) Danielson, A. L. R., Swinbank, A. M., Smail, I., Cox, P., Edge, A. C., Weiss, A., Harris, A. I., & Baker, , A. J. et al. 2011, MNRAS, 410, 1687
- Dannerbauer et al. (2002) Dannerbauer, H., Lehnert, M. D., Lutz, D., Tacconi, L., Bertoldi, F., Carilli, C., Genzel, R., & Menten, K. 2002, ApJ, 573, 473
- De Breuck et al. (2011) De Breuck, C., Maiolino, R., Caselli, P., Coppin, K., Hailey-Dunsheath, S., & Nagao, T. 2011, A&A, 530, L8
- Decarli et al. (2012) Decarli, R., Walter, F., Neri, R., Bertoldi, F., Carilli, C., Cox, P., Kneib, J. P., & Lestrade, J. F. et al. 2012, ApJ, 752, 2
- Frayer et al. (2000) Frayer, D. T., Smail, I., Ivison, R. J., & Scoville, N. Z. 2000, AJ, 120, 1668
- Gear et al. (2000) Gear, W. K., Lilly, S. J., Stevens, J. A., Clements, D. L., Webb, T. M., Eales, S. A., & Dunne, L. 2000, MNRAS, 316, L51
- Graciá-Carpio et al. (2011) Graciá-Carpio, J., Sturm, E., Hailey-Dunsheath, S., Fischer, J., Contursi, A., Poglitsch, A., Genzel, R., & et al., G. 2011, ApJL, 728, L7
- Hailey-Dunsheath et al. (2010) Hailey-Dunsheath, S., Nikola, T., Stacey, G. J., Oberst, T. E., Parshley, S. C., Benford, D. J., Staguhn, J. G., & Tucker, C. E. 2010, ApJL, 714, L162
- Hailey-Dunsheath et al. (2008) Hailey-Dunsheath, S., Nikola, T., Stacey, G. J., Oberst, T. E., Parshley, S. C., Bradford, C. M., Ade, P. A. R., & Tucker, C. E. 2008, ApJL, 689, L109
- Hainline et al. (2009) Hainline, L. J., Blain, A. W., Smail, I., Frayer, D. T., Chapman, S. C., Ivison, R. J., & Alexander, D. M. 2009, ApJ, 699, 1610
- Hollenbach & Tielens (1999) Hollenbach, D. J. & Tielens, A. G. G. M. 1999, Reviews of Modern Physics, 71, 173
- Ivison et al. (2007) Ivison, R. J., Greve, T. R., Dunlop, J. S., Peacock, J. A., Egami, E., Smail, I., & Ibar et al. 2007, MNRAS, 380, 199
- Ivison et al. (2002) Ivison, R. J., Greve, T. R., Smail, I., Dunlop, J. S., Roche, N. D., Scott, S. E., Page, M. J., & Stevens et al. 2002, MNRAS, 337, 1
- Ivison et al. (1998) Ivison, R. J., Harrison, A. P., & Coulson, I. M. 1998, A&A, 330, 443
- Ivison et al. (2010a) Ivison, R. J., Magnelli, B., Ibar, E., Andreani, P., Elbaz, D., Altieri, B., Amblard, A., & Arumugam, V. et al. 2010a, A&A, 518, L31
- Ivison et al. (2011) Ivison, R. J., Papadopoulos, P. P., Smail, I., Greve, T. R., Thomson, A. P., Xilouris, E. M., & Chapman, S. C. 2011, MNRAS, 412, 1913
- Ivison et al. (2010b) Ivison, R. J., Swinbank, A. M., Swinyard, B., Smail, I., Pearson, C. P., Rigopoulou, D., Polehampton, E., & Baluteau, J.-P.. et al. 2010b, A&A, 518, L35
- Kaufman et al. (1999) Kaufman, M. J., Wolfire, M. G., Hollenbach, D. J., & Luhman, M. L. 1999, ApJ, 527, 795
- Kennicutt (1998) Kennicutt, R. C. 1998, ARAA, 36, 189
- LeFloc’h et al. (2009) LeFloc’h, E., Aussel, H., Ilbert, O., Riguccini, L., Frayer, D. T., Salvato, M., Arnouts, S., & Surace, J. et al. 2009, ApJ, 703, 222
- Lindner et al. (2011) Lindner, R. R., Baker, A. J., Omont, A., Beelen, A., Owen, F. N., Bertoldi, F., Dole, H., & Fiolet, N. et al. 2011, ApJ, 737, 83
- Lord et al. (1996) Lord, S. D., Malhotra, S., Lim, T., Helou, G., Rubin, R. H., Stacey, G. J., Hollenbach, D. J., & Werner, M. W. et al. 1996, A&A, 315, L117
- Luhman et al. (1998) Luhman, M. L., Satyapal, S., Fischer, J., Wolfire, M. G., Cox, P., Lord, S. D., Smith, H. A., Stacey, G. J., & Unger, S. J. 1998, ApJL, 504, L11
- Luhman et al. (2003) Luhman, M. L., Satyapal, S., Fischer, J., Wolfire, M. G., Sturm, E., Dudley, C. C., Lutz, D., & Genzel, R. 2003, ApJ, 594, 758
- Madden et al. (1993) Madden, S. C., Geis, N., Genzel, R., Herrmann, F., Jackson, J., Poglitsch, A., Stacey, G. J., & Townes, C. H. 1993, ApJ, 407, 579
- Maiolino et al. (2009) Maiolino, R., Caselli, P., Nagao, T., Walmsley, M., De Breuck, C., & Meneghetti, M. 2009, A&A, 500, L1
- Maiolino et al. (2005) Maiolino, R., Cox, P., Caselli, P., Beelen, A., Bertoldi, F., Carilli, C. L., Kaufman, M. J., & Menten, K. M. et al. 2005, A&A, 440, L51
- Malhotra et al. (2001) Malhotra, S., Kaufman, M. J., Hollenbach, D., Helou, G., Rubin, R. H., Brauher, J., Dale, D., & Lu, N. Y. et al. 2001, ApJ, 561, 766
- McMullin et al. (2007) McMullin, J. P., Waters, B., Schiebel, D., Young, W., & Golap, K. 2007, in Astronomical Society of the Pacific Conference Series, Vol. 376, Astronomical Data Analysis Software and Systems XVI, ed. R. A. Shaw, F. Hill, & D. J. Bell, 127
- Menéndez-Delmestre et al. (2007) Menéndez-Delmestre, K., Blain, A. W., Alexander, D. M., Smail, I., Armus, L., Chapman, S. C., Frayer, D. T., Ivison, R. J., & Teplitz, H. I. 2007, ApJL, 655, L65
- Nagao et al. (2012) Nagao, T., Maiolino, R., De Breuck, C., Caselli, P., Hatsukade, B., & Saigo, K. 2012, eprint arXiv:1205.4834
- Pope et al. (2006) Pope, A., Scott, D., Dickinson, M., Chary, R.-R., Morrison, G., Borys, C., Sajina, A., & Alexander, D. et al. 2006, MNRAS, 370, 1185
- Sakamoto et al. (2008) Sakamoto, K., Wang, J., Wiedner, M. C., Wang, Z., Peck, A. B., Zhang, Q., Petitpas, G. R., & Ho, L., et al. 2008, ApJ, 684, 957
- Sanders et al. (2003) Sanders, D. B., Mazzarella, J. M., Kim, D.-C., Surace, J. A., & Soifer, B. T. 2003, AJ, 126, 1607
- Sanders & Mirabel (1996) Sanders, D. B. & Mirabel, I. F. 1996, ARAA, 34, 749
- Sargsyan et al. (2012) Sargsyan, L., Lebouteiller, V., Weedman, D., Spoon, H., Bernard-Salas, J., Engels, D., Stacey, G., Houck, J., Barry, D., Miles, J., & Samsonyan, A. 2012, ArXiv e-prints
- Schinnerer et al. (2008) Schinnerer, E., Carilli, C. L., Capak, P., Martinez-Sansigre, A., Scoville, N. Z., Smolčić, V., Taniguchi, Y., Yun, M. S., Bertoldi, F., Le Fevre, O., & de Ravel, L. 2008, ApJL, 689, L5
- Smail et al. (2011) Smail, I., Swinbank, A. M., Ivison, R. J., & Ibar, E. 2011, MNRAS, 414, L95
- Smolčić et al. (2012) Smolčić, V., Navarrete, F., Aravena, M., Ilbert, O., Yun, M. S., Sheth, K., Salvato, M., & McCracken, H. J. et al. 2012, ApJS, 200, 10
- Spinoglio et al. (2005) Spinoglio, L., Malkan, M. A., Smith, H. A., González-Alfonso, E., & Fischer, J. 2005, ApJ, 623, 123
- Stacey et al. (1991) Stacey, G. J., Geis, N., Genzel, R., Lugten, J. B., Poglitsch, A., Sternberg, A., & Townes, C. H. 1991, ApJ, 373, 423
- Stacey et al. (2010) Stacey, G. J., Hailey-Dunsheath, S., Ferkinhoff, C., Nikola, T., Parshley, S. C., Benford, D. J., Staguhn, J. G., & Fiolet, N. 2010, ApJ, 724, 957
- Swinbank et al. (2011) Swinbank, A. M., Papadopoulos, P. P., Cox, P., Krips, M., Ivison, R. J., Smail, I., Thomson, A. P., Neri, R., Richard, J., & Ebeling, H. 2011, ApJ, 742, 11
- Swinbank et al. (2010) Swinbank, A. M., Smail, I., Longmore, S., Harris, A. I., Baker, A. J., De Breuck, C., Richard, J., & Edge, A. C. et al. 2010, Nature, 464, 733
- Tacconi et al. (2008) Tacconi, L. J., Genzel, R., Smail, I., Neri, R., Chapman, S. C., Ivison, R. J., Blain, A., & Cox, P., et al. 2008, ApJ, 680, 246
- Tacconi et al. (2006) Tacconi, L. J., Neri, R., Chapman, S. C., Genzel, R., Smail, I., Ivison, R. J., Bertoldi, F., & Blain et al. 2006, ApJ, 640, 228
- Unger et al. (2000) Unger, S. J., Clegg, P. E., Stacey, G. J., Cox, P., Fischer, J., Greenhouse, M., Lord, S. D., & Luhman, M. L. et al. 2000, A&A, 355, 885
- Valtchanov et al. (2011) Valtchanov, I., Virdee, J., Ivison, R. J., Swinyard, B., van der Werf, P., Rigopoulou, D., da Cunha, E., & Lupu R. et al. 2011, MNRAS, 415, 3473
- van der Werf et al. (2010) van der Werf, P. P., Isaak, K. G., Meijerink, R., Spaans, M., Rykala, A., Fulton, T., Loenen, A. F., & Walter, F. et al. 2010, A&A, 518, L42
- Wagg et al. (2010) Wagg, J., Carilli, C. L., Wilner, D. J., Cox, P., De Breuck, C., Menten, K., Riechers, D. A., & Walter, F. 2010, A&A, 519, L1
- Walter et al. (2012) Walter, F., Decarli, R., Carilli, C., Bertoldi, F., Cox, P., da Cunha, E., Daddi, E., & Dickinson, M. et al. 2012, Nature, 486, 233
- Walter et al. (2009a) Walter, F., Riechers, D., Cox, P., Neri, R., Carilli, C., Bertoldi, F., Weiss, A., & Maiolino, R. 2009a, Nature, 457, 699
- Walter et al. (2009b) Walter, F., Weiß, A., Riechers, D. A., Carilli, C. L., Bertoldi, F., Cox, P., & Menten, K. M. 2009b, ApJL, 691, L1
- Wang et al. (2011) Wang, W.-H., Cowie, L. L., Barger, A. J., & Williams, J. P. 2011, ApJL, 726, L18
- Wardlow et al. (2011) Wardlow, J. L., Smail, I., Coppin, K. E. K., Alexander, D. M., Brandt, W. N., Danielson, A. L. R., Luo, B., & Swinbank, A. M. et al. 2011, MNRAS, 415, 1479
- Weiß et al. (2009) Weiß, A., Kovács, A., Coppin, K., Greve, T. R., Walter, F., Smail, I., Dunlop, J. S., & Knudsen, K. K. et al. 2009, ApJ, 707, 1201
- Wolfire et al. (2003) Wolfire, M. G., McKee, C. F., Hollenbach, D., & Tielens, A. G. G. M. 2003, ApJ, 587, 278
- Younger et al. (2007) Younger, J. D., Fazio, G. G., Huang, J.-S., Yun, M. S., Wilson, G. W., Ashby, M. L. N., Gurwell, M. A., & Lai et al. 2007, ApJ, 671, 1531
- Younger et al. (2008) Younger, J. D., Fazio, G. G., Wilner, D. J., Ashby, M. L. N., Blundell, R., Gurwell, M. A., Huang, J.-S., & Iono, D. et al. 2008, ApJ, 688, 59