Suzaku reveals X-ray continuum piercing the nuclear absorber in Markarian 231
Abstract
We report the results from a 2011 Suzaku observation of the nearby low-ionization BAL quasar/ULIRG Markarian 231. These data reveal that the X-ray spectrum has undergone a large variation from the 2001 XMM–Newton and BeppoSAX observations. We interpret this finding according to a scenario whereby the X-ray continuum source is obscured by a two-component partial-covering absorber with NH 1022 and 1024 cm-2, respectively. The observed spectral change is mostly explained by a progressive appearance of the primary continuum at 10 keV due to the decrease of the covering fraction of the denser absorption component. The properties of the X-ray obscuration in Mrk 231 match well with those of the X-ray shielding gas predicted by the theoretical models for an efficient radiatively-driven acceleration of the BAL wind. In particular, the X-ray absorber might be located at the extreme base of the outflow. We measure a 2-10 keV luminosity of = 3.3 1043 erg s-1 for the 2011 data set, i.e. an increase of 30% with respect to the 2001 value.
keywords:
galaxies: active - quasars: individual: Mrk 231 - X-ray: galaxies1 Introduction
According to most of the models of merger-driven quasar/massive galaxy co-evolution, quasars should undergo an heavily obscured phase associated with the presence of massive outflows capable of sweeping the bulk of the gas reservoir away from the surrounding host galaxy (e.g. Silk & Rees 1998; Fabian 1999; Cattaneo et al. 2009; Zubovas & King 2012). Mrk 231 is regarded as one of the most promising candidates of a quasar that gradually emerges from the obscured phase prior to becoming X-ray unobscured/optically bright, while the AGN feedback onto the host galaxy ISM is active. Mrk 231 is indeed unique for many reasons (e.g. Lipari et al. 2009). Firstly, it is the nearest quasar ( = 0.042) and the most luminous ( = 3.6 1012 L⊙) ULIRG in the local Universe, with a significant fraction (40%) of its bolometric luminosity due to starburst activity (SFR 200 M⊙ yr-1), with typical signatures of a late-state merger. Furthermore, Mrk 231 belongs to the rare subclass of low-ionization broad absorption line (LoBAL) quasars, which exhibit low-ionization (i.e. MgII and AlIII) BALs and very weak [OIII] emission in their optical spectra. Their unusual properties were explained by Boroson & Meyers (1992) in terms of absorption with higher column density and larger covering fraction than in other BAL quasars, which blocks the ionizing radiation from the nucleus that normally illuminates the narrow-line region. Supergiant expanding bubbles of ionized gas on kpc-scale have been also detected (see Lipari et al. 2009).
The remarkable discovery of spatially-extended, broad wings in the CO(J=1-0) emission line profile with interferometric millimeter observations of Mrk 231 (Feruglio et al. 2010) revealed the presence of a giant molecular outflow with an estimated mass outflow rate of 700 M⊙ yr-1, which largely exceeds the ongoing SFR in the host galaxy. This finding provided one of the very first direct and compelling evidence of quasar-driven feedback removing large amounts of molecular gas, i.e. the material of star formation, from the central regions of the galaxy (then confirmed by Rupke & Veilleux 2011, Aalto et al. 2012 and Cicone et al. 2012). All these results support the hypothesis that in Mrk 231 both the nucleus and the host galaxy are undergoing a key phase, still poorly investigated, in the evolution from an ULIRG/gas-rich system to a standard, X-ray- and optically-bright quasar in a passive galaxy.
This motivates to shed further light on the properties of the central engine in Mrk 231 via penetrating X-ray observations. However, despite its peculiarity and distinctiveness, Mrk 231 has not been targeted by an extensive, well-defined program of X-ray observations so far. The ASCA data taken in 1999 suggested the presence of multiple reprocessed emission components as possible explanation for the very complex spectrum (Maloney & Reynolds 2000). Then, four short (40 ks each) exposures have been performed by Chandra (Gallagher et al. 2005), while XMM–Newton observed this source for only 20 ks in 2001. Braito et al. (2004, B04 hereafter) published these data along with those obtained by BeppoSAX a few months later, revealing the presence of a 3 hard X-ray ( 15 keV) excess in the Phoswich Detector System (PDS) spectrum, suggesting that the X-ray primary continuum is heavily obscured by a Compton-thick (CT) absorber (i.e. NH 1.6 1024 cm-2). This matches well with X-ray studies of LoBAL quasars that typically find highly absorbed spectra (Morabito et al. 2011; Ballo et al. 2011). B04 derive a quasar-like intrinsic luminosity of 1044 erg s-1 for the AGN in Mrk 231. However, it is important to stress the large uncertainties affecting these data and, therefore, the inferred spectral parameters above 10 keV.
Here, we present the first 0.7-30 keV observation of Mrk 231 obtained with Suzaku. The unique broad-band coverage of Suzaku allows the simultaneous study of the complex, absorption dominated-spectrum below 10 keV, and the very hard X-ray featureless continuum of the AGN, free from contamination from absorption. The Suzaku data confirm the BeppoSAX/PDS detection of a high-energy excess emission above the extrapolation of the 2-10 keV spectrum.
2 Observations and data reduction
Mrk 231 has been observed by Suzaku (Mitsuda et al. 2007) on 2011 April 27 (Obs. ID: 706037010) for 200 ks. During the exposure, X-ray Imaging Spectrometer (XIS) CCDs (e.g. Koyama et al. 2007) and Hard X-ray Detector (HXD; e.g. Takahashi et al. 2007) have been operated in their normal mode, with both front- and back-illuminated XIS chips in the 33 and 55 editing modes. Owing to an instrumental failure, XIS2 is unavailable for observations performed after November 2006. To maximize the HXD effective area, the target has been observed at the HXD nominal aim point. Data from XIS and HXD have been reduced with FTOOLS 6.12 and Suzaku software Version 19, using the latest calibration files available (2012 February 11 release) and following the prescriptions described in the Suzaku Data Reduction Guide111Available at http://suzaku.gsfc.nasa.gov/docs/suzaku/analysis/abc.
For the XIS detectors (i.e. XIS0, 1 and 3) source counts are extracted from a circular source-free region with a radius of 146 arcsec centered on the peak of the X-ray emission. Background counts are estimated from a similar circular region located close to the source. The XIS response and ancillary response files have been produced using the FTOOLS tasks xisrmfgen and xissimarfgen, respectively. The 33 and 55 spectra and matrices have then been combined together using addascaspec. All spectra are binned to a minimum of 30 counts per bin to allow use of the statistic. During the Suzaku observations Mrk 231 did not show any variation in X-ray flux and the spectral shape.
The HXD/PIN cleaned event file and the corresponding ”tuned” non-X-ray background (NXB) event file (ae706037010_hxd_pinbgd.evt) have been used as input to the hxdpinxbpi task. The cosmic background spectrum is created with a model provided by the Suzaku team based on the formula by Gruber et al. (1999) using a flat response (ae_hxd_pinflate10_20101013.rsp) and then combined with the NXB spectrum extracted from the NXB event file. The resulting combination is used for the background subtraction. We consider only data in the 15-30 keV energy range, where the source contribution is 6% of the total signal of the PIN. The source contribution drops down to 3% in the 30-50 keV energy bin. This choice ensures that the source signal is well above the current systematic uncertainty on the PIN background, i.e. 3% for observation with exposure longer than 10 ks (Fukazawa et al. 2009). We use the appropriate response file (ae_hxd_pinhxnome10_20101013.rsp) for HXD-nominal pointing for the spectral analysis. Here, we present data from PIN only, since no significant signal was detected from GSO. Relative normalization among XIS0–3 and PIN are set as reported in Maeda et al. (2008) for an observation performed at the HXD nominal position.
XMM–Newton and BeppoSAX observations of Mrk 231 performed in 2001 are also used here. XMM–Newton data have been reduced with SAS 11.0 (Gabriel et al. 2004). The pn source and background spectrum and the matrices are created using standard procedures (e.g., Piconcelli et al. 2004). The BeppoSAX/PDS spectrum and the corresponding response matrix have been downloaded from the BeppoSAX public archive.
Spectra are analyzed with the XSPEC v12.7 package (Arnaud 1996). All fitting models presented here include absorption caused by the line-of-sight Galactic column density of NH = 1.3 1020 cm-2 (Dickey & Lockman 1990).
3 Spectral variability and interpretation
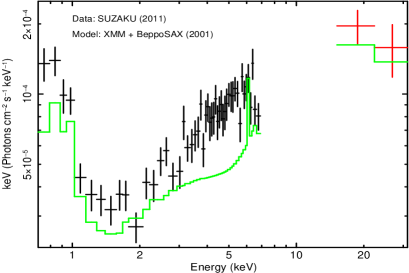
B04 found a best-fit model (indicated as model A in their paper) to the joint 2001 XMM–Newton and BeppoSAX spectrum of Mrk 231 consisting of a combination of a power law modified by a fully-covering CT absorber, and a mix of reprocessed AGN emission absorbed by an additional screen with NH 1022 cm-2, and multi-temperature thermal emission due to the starburst activity, which accounts for the very complex 0.5-10 keV spectral shape.
Fig. 1a shows the application of this fitting model to the Suzaku data taken in 2011. This comparison implies a very significant X-ray spectral variation in a 10 yr time span, accompanied with a moderate increase of the flux over the Suzaku bandpass. In particular, the XIS spectral data in the 2-10 keV band show the largest differences with respect to the XMM–Newton ones. Moreover, Fig. 1a indicates that the normalization of the Fe K emission line at 6 keV remains constant between the two epochs (see Sect. 4), suggesting no variation in both spectral features, i.e. fluorescence iron line and continuum, associated with the reflection component (George & Fabian 1991; Ghisellini et al. 1994), which is believed to originate from a distant reprocessor (typically the visible inner wall of the obscuring torus itself). The soft X-ray band in model A is entirely due to starburst emission. As such, no flux variability has to be expected in the soft X-ray band. The 2-10 keV band is instead dominated by X-ray reflection likely on 0.1 pc scales. Variability in response to continuum changes could in principle be observed on a 10 yr timescale, but this is at odds with the apparent constancy of the associated Fe line intensity. Hence, the only plausible explanation for the soft and hard X-ray band flux variability is that part of the X-ray continuum is visible below 10 keV.
We then replace the CT absorber of model A with a partial covering one which allows some continuum leakage below 10 keV. According to this scenario, the primary continuum power law is seen through two distinct, nested layers of absorption. The underlying idea is that the observed variation in the Suzaku spectrum with respect to the XMM–Newton one can be explained in terms of changes in the physical and geometrical properties of these absorbers. In our analysis, we use the zxipcf model in XSPEC (Reeves et al. 2008), which describes partial covering absorption by partially ionized material at the redshift of the source. This allows us to explore a large variety of possible ionization states and covering fraction of the obscuring medium. To account for the reflection component, we use the pexmon model (Nandra et al. 2007) which includes both continuum reflection (Magdziarz & Zdziarski 1995) and the associated Fe K line emission (George & Fabian 1991), with the metal abundances of the reflector fixed to the solar value and its inclination angle fixed to 60∘. The photon index of the X-ray continuum and reflection is fixed to = 1.9, i.e. the typical value measured for quasars (Piconcelli et al. 2005). Similarly to B04, we also include in the fit two mekal thermal components with solar abundance. This model yields an excellent description of the 2001 XMM–NewtonBeppoSAX data, i.e. (dof) = 0.96(76) (Table 1). The spectral complexity and the quality of the data above 10 keV do not allow to put tight constraints on both the column density and the ionization parameter (expressed in erg cm s-1; see Reeves et al. 2008) of the this absorber. Therefore, we fix the parameters to their best-fit values deduced by the fit, i.e., NH = 1.6 1024 cm-2 and log = -2. The covering fraction of this CT absorber is 0.85. The covering fraction of the second partially-covering absorber is 0.92 (while fixing to the unity worsens the fit by = 26 for 1 dof). The best-fit values for the column density and the ionization parameter of this obscuring component are NH = 5.9 1022 cm-2 and log = -0.4, respectively.
In this fit, we assume that the reflection component is not obscured by the two-component absorber and its normalization is equal to that of the primary continuum . However, a fit with the reflection component obscured only by the outer/Compton-thin absorber produces similar results. Nonetheless, we prefer a solution in which the reflection component is left outside the two-component partial-covering absorber as the constant Fe K line flux suggests that the reflection originates far away the continuum source, while the partial-covering and warm nature of the Compton-thin absorption is more consistent with an inner, nuclear location rather than a pc-scale one. The value of the reflection fraction is 0.2 (defined as , where is the solid angle subtended by the reflector for isotropic incident emission). The temperature of the two mekal components accounting for the thermal diffuse emission is T = 0.40.1 and T = 1.00.2 keV, respectively, i.e. consistent with the values derived by spatially-resolved Chandra spectroscopy (Gallagher et al. 2002). Finally, this model implies a 2-10(15-30) keV observed luminosity of 2.5(11.9) 1042 erg s-1.
| Obs./date | NH/log | NH/log | Flux | (dof) | ||||
|---|---|---|---|---|---|---|---|---|
| (1) | (2) | (3) | (4) | (5) | (6) | (7) | (8) | (9) |
| XMM(6/2001) | 21 | 160†/-2† | 0.85 | 5.9/-0.4 | 0.920.02 | 0.19 | 1.1/6.4/30.2 | 0.96(76) |
| SAX(12/2001) | ||||||||
| Suzaku(4/2011) | 2.90.8 | 160†/-2† | 0.78 | 6.3/-0.5 | 0.950.01 | 0.08† | 1.7/10.1/37.1 | 1.09(285) |
Notes: (1) X-ray telescope (epoch); (2) Intensity of the power-law primary continuum (in units of 10-3 photons keV-1 cm-2 s-1); (3) Column density (in units of 1022 cm-2) and ionization parameter of the CT absorber; (4) Covering fraction of the CT absorber (5) Column density (in units of 1022 cm-2) and ionization parameter of the Compton-thin absorber; (6) Covering fraction of the Compton-thin absorber; (7) Reflection fraction; (8) Flux in the 0.5–2/2–10/15–30 keV band (in units of 10-13 erg cm-2 s-1). † The parameter has been fixed to the best-fitting value deduced by the fit.
4 Broad-band Suzaku spectroscopy
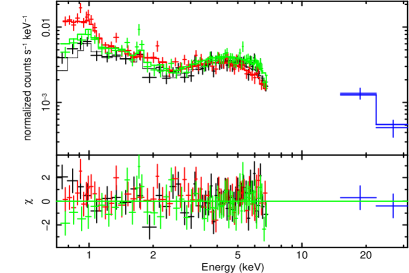
As the next step, we apply the double partial-covering absorber (DPCA hereafter) model that has been found to successfully fit the 2001 XMM–NewtonBeppoSAX data to the broad-band Suzaku spectrum taken in 2011. Our goal is to test if both data sets can be described by the same model, and the observed variability can be ascribed to variations in the line-of-sight absorbers. The normalization of Fe K emission line measured from the Suzaku spectrum is = 96 10-7 photons cm-2 s-1. Such a value is fully consistent with the XMM–Newton one ( = 1.51.1 10-6 photons cm-2 s-1) and those inferred from Chandra observations (e.g. Gallagher et al. 2005). The Fe K line and, hence, the associated reflection continuum therefore remains approximately unchanged over these epochs (see Fig. 1a). Accordingly, the value of reflection fraction has been forced to vary within the 90% confidence level interval derived for these parameter from the 2001 data, keeping the same normalization ( = 2 10-3 photons keV-1 cm-2 s-1). We then fix = 0.08, i.e., the best-fit value deduced by the fit. The values of the NH and of the CT absorber are constrained as for the XMM–NewtonBeppoSAX spectrum. The result of the DPCA fit to the 0.7–30 keV Suzaku data is shown in Fig. 1b. This model provides a very good fit with (dof) = 1.09(285).
As expected on the basis of Fig. 1a, we measure an increase of the flux in the 0.5-2, 2-10 and 15-30 keV bands (e.g. Table 1) from 2001 to 2011. It mostly results from the combination of a larger normalization of the power law of the primary continuum and a smaller covering fraction of the CT absorber in the Suzaku spectrum (although, given their large uncertainties, both parameters are however consistent at 90% with those inferred in Sect. 3). The best-fitting temperatures (T = 0.23 and T = 1.26 keV) and the normalizations of the two mekal soft X-ray emission components are in good agreement with those derived from the XMM–Newton spectrum, as expected for spectral component associated with starburst emission and/or photoionized gas emission. Once model DPCA is assumed, we estimate a 2-10(0.5-30) keV flux of 1(5.7) 10-12 erg cm-2 s-1, corresponding to an observed luminosity of 4(22) 1042 erg s-1.
Finally, replacing the warm absorbers in the DPCA model with cold ones yields a worse fit to the Suzaku data, with an associated (dof) = 1.28(285), and large positive residuals around 5 keV where it predicts less spectral curvature and a continuum less intense than observed.
5 Discussion
The analysis of the Suzaku data presented here has revealed a large variation of the X-ray spectral shape from the last X-ray observations of Mrk 231 performed with XMM–Newton and BeppoSAX in 2001 (Fig. 1a). We have successfully fitted the broad-band Suzaku spectrum with a DPCA model. This model also provides an excellent fit to the 2001 data. In this scenario, two absorbers lie along our line of sight (LoS) to the nucleus of Mrk 231: one with a CT column density, and another one with NH a few of 1022 cm-2. Both absorbers are slightly ionized and have a covering fraction less than 1. This allows to detect the leakage below 10 keV of the direct emission from the X-ray source. Accordingly, the spectral variation shown in Fig. 1a can be basically explained by a progressive appearance of the primary continuum at energies 10 keV due to a decrease of the covering fraction of the CT absorber, suggesting that this absorption component is the innermost, more variable one. This interpretation appears to be consistent both with (i) the spectral properties inferred by previous X-ray observations, as well as (ii) the LoBAL nature of the quasar in Mrk 231.
Maloney & Reynolds (2000) indeed proposed the existence of two layers of obscuration after the analysis of a moderately long ASCA exposure. However, they assumed that no fraction of the X-ray primary continuum is visible in the ASCA range, i.e. the quasar central engine is completely buried. If, as we suggest, the variation occurred between 2001 and 2011, it is indeed possible that ASCA caught the source at an epoch when the of the CT absorber was close to unity. However, it is important to bear in mind that the limited bandpass of ASCA did not allow to put any meaningful constraint on the CT obscured X-ray continuum. The variability in the hard X-ray flux detected during a 40 ks Chandra observation led Gallagher et al. (2002) to question the reflection-dominated hypothesis for the X-ray spectrum of this quasar, although such variability was not detected in any of the subsequent three similar Chandra exposures performed in 2003. They suggested the existence of a third spectral component, i.e. an absorbed (NH 3 1022 cm-2) power law, in addition to the thermal plasma and the reflection continuum, which may arise from a compact X-ray scattering medium. Gallagher et al. (2005) found an acceptable fit to the combined 0.5-8 keV spectrum from the four Chandra observations with a model consisting of a power law modified by three absorbers plus soft thermal emission, which may resemble our DPCA model in terms of overall spectral shape in this energy band, ’weak’ Fe K emission and, mostly, for the presence of a multi-component absorber. Furthermore, the consistency of the flux of the Fe K emission line over 2001-2003 found by Chandra and XMM–Newton observations of Mrk 231 is suggestive of a Compton reflection component likely to be associated with distant, optically thick material, and, remarkably, the 2011 Suzaku data lend further support to this scenario. The DPCA model proposed here is therefore able to explain in a coherent fashion the several pieces of evidence collected over the years thanks to the previous limited bandpass and/or less sensitive X-ray observations. The hard X-ray flux values measured from the Chandra observations are consistent each other and are slightly larger (i.e. consistent within 2) than the XMM–Newton value (Gallagher et al. 2005). In the proposed DPCA scenario, this can be interpreted as lack of large variations in the physical properties of the CT absorber.
The presence of the highly absorbed power-law emission at 15 keV above the extrapolation of the 2-10 keV spectrum claimed by B04 thanks to the 2001 BeppoSAX observation is fully confirmed by the present Suzaku data. X-ray spectral properties of LoBAL are very scarce due to their weakness in the 0.5-10 keV range (Green et al. 2001; Morabito et al. 2011), interpreted in terms of heavy obscuration. Even much more extraordinary is the detection of these objects at higher energies: as far we know, Mrk 231 is the only member of this class of AGN for which a spectrum has been collected in the band above 10 keV.
The change in the spectral shape discovered here as well as the short-timescale variability in the hard-band emission reported by Gallagher et al. (2002) (assuming an origin in the multi-component absorber) seems to indicate that the bulk of the X-ray obscuration likely occurs in a compact region much closer to the X-ray source than the canonical 0.1-1 pc-scale torus invoked in the Unified model, or extended structures in the complex circumnuclear environment of Mrk 231 (e.g. Klockner et al. 2003, and references therein). Both ionized and neutral X-ray absorbers with large column densities are commonly observed in BAL quasars (e.g. Green et al. 2001; Piconcelli et al. 2005; Morabito et al. 2011; Giustini et al. 2011) They have been indeed associated with the BAL outflow (e.g. Elvis 2000), which is likely launched from the accretion disk surrounding the supermassive black hole (Young et al. 2007), and their variability explained in terms of outflowing clouds crossing our LoS. In particular, it has been proposed that this wind must be shielded from the X-ray continuum source to prevent the BAL absorbing clouds from becoming too highly ionized. This would inhibit a very efficient mechanism of gas acceleration such as the radiation-driven acceleration, by eliminating most of the UV transitions that absorb the photons necessary to accelerate the outflowing gas (Murray et al. 1995; Proga 2007, and references therein). This X-ray-shielding region must be effectively opaque to X-rays, as well as sufficiently ionized (and dust-free) to allow UV line opacity, and might represent the inner section of the wind itself (and/or located at the extreme base of the outflow). The properties of the DPCA discovered in Mrk 231 match well with those predicted for the shielding gas by the BAL outflow models, providing an important observation-based evidence for the theory of physical mechanism responsible for launching and accelerating AGN winds. These nuclear, highly supersonic outflows are believed to compress the surrounding medium and generate a shock, which moves outwards and sweeps the surrounding medium out, i.e. the AGN feedback mechanism (Menci et al. 2008; Zubovas & King 2012).
The presence of a partially-covering absorber suggests that the typical size of the X-ray absorber along our LoS is comparable with that of the X-ray continuum source. The latter is likely of the order of 10 , as estimated via occultation or microlensing in a few AGNs (Dai et al. 2010; Risaliti et al. 2007; Maiolino et al. 2010). Accordingly, the DPCA is not the torus envisaged by the Unification model, which can be however present in Mrk 231, as it should lie (i) on larger scales and (ii) edge-on with respect to our LoS. The non-variable reflection emission component observed in the X-ray spectrum of Mrk 231 is likely associated to this obscuring/reprocessing medium located distant from the central engine.
Finally, the broad bandpass of Suzaku allows us to measure the intrinsic luminosity of the X-ray source in Mrk 231. We find an intrinsic luminosity of = 3.3 1043 erg s-1 in the 2-10 keV energy range, while the luminosity in the 15-30 keV PIN band is 1.7 1043 erg s-1. Using the DPCA model for the joint XMM–Newton BeppoSAX spectrum, we calculate a = 2.6 1043 erg s-1. It is interesting to compare this X-ray luminosity with that expected on the basis of well-established isotropic indicator of AGN luminosity. The luminosity of the mid-IR emission line [O IV] 25.89m has been shown to be one of the most accurate proxies of (Melendez et al. 2008). Armus et al. (2007) reported an upper limit for the [O IV] 25.89m luminosity of 2.64 1041 erg s-1 based on 2004 Spitzer data. Using the – relation in Melendez et al. (see Table 3), the predicted 2-10 keV luminosity for Mrk 231 is 3.7 1043 erg s-1. This matches well with the values deduced from both Suzaku and XMM–Newton observations. Similar results are also obtained by the comparison of the luminosity in the 14-195 keV range predicted on the basis of , i.e. 1044 erg s-1, and those estimated from Suzaku and XMM–Newton BeppoSAX data, i.e. = 7 and 5.7 1043 erg s-1, respectively.
Future X-ray observations with broad-band X-ray capabilities (i.e., NuSTAR and ASTRO-H) as well as well-defined monitoring program with present-day X-ray telescopes will allow to provide much more detailed insights into the kinetic, geometrical and physical properties of the nuclear absorber(s) in this composite ULIRG/LoBAL quasar, where AGN-driven outflows in the neutral, ionized and molecular gas capable of quenching star formation in the host galaxy have been found.
Acknowledgments
We thank the referee for useful comments and suggestions that helped improve the quality and the presentation of the paper. We are grateful to all the Suzaku team members. EP would like to acknowledge support by INSA. GM thanks the Spanish Ministry of Science and Innovation for partial support through grant AYA2010-21490-C02-02. PR acknowledges financial contribution from the agreement ASI-INAF I/009/10/0, and a grant from the Greek General Secretariat of Research and Technology in the framework of the program Support of Postdoctoral Researchers. Based on observations obtained with XMM-Newton, an ESA science mission with instruments and contributions directly funded by ESA Member States and NASA.
References
- [\citeauthoryearAalto et al.2012] Aalto S., Garcia-Burillo S., Muller S., Winters J. M., van der Werf P., Henkel C., Costagliola F., Neri R., 2012, A&A, 537, A44
- [\citeauthoryearArmus et al.2007] Armus L. et al., 2007, ApJ, 656, 148
- [\citeauthoryearArnaud1996] Arnaud K. A., 1996, ASPC, 101, 17
- [\citeauthoryearBallo et al.2011] Ballo L., Piconcelli E., Vignali C., Schartel N., 2011, MNRAS, 415, 2600
- [\citeauthoryearBoroson & Meyers1992] Boroson T. A., Meyers K. A., 1992, ApJ, 397, 442
- [\citeauthoryearBraito et al.2004] Braito V. et al., 2004, A&A, 420, 79 (B04)
- [\citeauthoryearCattaneo et al.2009] Cattaneo A. et al., 2009, Nat, 460, 213
- [\citeauthoryearCicone et al.2012] Cicone C., Feruglio C., Maiolino R., Fiore F., Piconcelli E., Menci N., Aussel H., Sturm E., 2012, A&A, 543, A99
- [\citeauthoryearDai et al.2010] Dai X., Kochanek C. S., Chartas G., Kozłowski S., Morgan C. W., Garmire G., Agol E., 2010, ApJ, 709, 278
- [\citeauthoryearDickey & Lockman1990] Dickey J. M., Lockman F. J., 1990, ARA&A, 28, 215
- [\citeauthoryearElvis2000] Elvis M., 2000, ApJ, 545, 63
- [\citeauthoryearFabian1999] Fabian A. C., 1999, MNRAS, 308, L39
- [\citeauthoryearFeruglio et al.2010] Feruglio C., Maiolino R., Piconcelli E., Menci N., Aussel H., Lamastra A., Fiore F., 2010, A&A, 518, L155
- [\citeauthoryearFukazawa et al.2009] Fukazawa Y. et al., 2009, PASJ, 61, 17
- [\citeauthoryearGabriel et al.2004] Gabriel C. et al., 2004, ASPC, 314, 759
- [\citeauthoryearGallagher et al.2002] Gallagher S. C., Brandt W. N., Chartas G., Garmire G. P., Sambruna R. M., 2002, ApJ, 569, 655
- [\citeauthoryearGallagher et al.2005] Gallagher S. C., Schmidt G. D., Smith P. S., Brandt W. N., Chartas G., Hylton S., Hines D. C., Brotherton M. S., 2005, ApJ, 633, 71
- [\citeauthoryearGeorge & Fabian1991] George I. M., Fabian A. C., 1991, MNRAS, 249, 352
- [\citeauthoryearGhisellini, Haardt, & Matt1994] Ghisellini G., Haardt F., Matt G., 1994, MNRAS, 267, 743
- [\citeauthoryearGiustini et al.2011] Giustini M. et al., 2011, A&A, 536, A49
- [\citeauthoryearGreen et al.2001] Green P. J., Aldcroft T. L., Mathur S., Wilkes B. J., Elvis M., 2001, ApJ, 558, 109
- [\citeauthoryearGruber et al.1999] Gruber D. E., Matteson J. L., Peterson L. E., Jung G. V., 1999, ApJ, 520, 124
- [\citeauthoryearKlöckner, Baan, & Garrett2003] Klöckner H.-R., Baan W. A., Garrett M. A., 2003, Nat, 421, 821
- [\citeauthoryearKoyama et al.2007] Koyama K. et al., 2007, PASJ, 59, 23
- [\citeauthoryearLipari et al.2009] Lipari S. et al., 2009, MNRAS, 392, 1295
- [\citeauthoryearMaeda et al.2008] Maeda Y. et al., 2008, Suzaku Memo 2008-06: Recent update of the XRT response: III. Effective Area, available at http://www.astro.isas.jaxa.jp/suzaku/doc/suzakumemo/suzakumemo-2008-06.pdf
- [\citeauthoryearMagdziarz & Zdziarski1995] Magdziarz P., Zdziarski A. A., 1995, MNRAS, 273, 837
- [\citeauthoryearMaiolino et al.2010] Maiolino R. et al., 2010, A&A, 517, A47
- [\citeauthoryearMaloney & Reynolds2000] Maloney P. R., Reynolds C. S., 2000, ApJ, 545, L23
- [\citeauthoryearMeléndez et al.2008] Meléndez M. et al., 2008, ApJ, 682, 94
- [\citeauthoryearMenci et al.2008] Menci N., Fiore F., Puccetti S., Cavaliere A., 2008, ApJ, 686, 219
- [\citeauthoryearMitsuda et al.2007] Mitsuda K. et al., 2007, PASJ, 59, 1
- [\citeauthoryearMorabito et al.2011] Morabito L. K., Dai X., Leighly K. M., Sivakoff G. R., Shankar F., 2011, ApJ, 737, 46
- [\citeauthoryearMurray et al.1995] Murray N., Chiang J., Grossman S. A., Voit G. M., 1995, ApJ, 451, 498
- [\citeauthoryearNandra et al.2007] Nandra K., O’Neill P. M., George I. M., Reeves J. N., 2007, MNRAS, 382, 194
- [\citeauthoryearPiconcelli et al.2005] Piconcelli E., Jimenez-Bailón E., Guainazzi M., Schartel N., Rodríguez-Pascual P. M., Santos-Lleó M., 2005, A&A, 432, 15
- [\citeauthoryearPiconcelli et al.2004] Piconcelli E., Jimenez-Bailón E., Guainazzi M., Schartel N., Rodríguez-Pascual P. M., Santos-Lleó M., 2004, MNRAS, 351, 161
- [\citeauthoryearProga2007] Proga D., 2007, ASPC, 373, 267
- [\citeauthoryearReeves et al.2008] Reeves J., Done C., Pounds K., Terashima Y., Hayashida K., Anabuki N., Uchino M., Turner M., 2008, MNRAS, 385, L108
- [\citeauthoryearRisaliti et al.2007] Risaliti G., Elvis M., Fabbiano G., Baldi A., Zezas A., Salvati M., 2007, ApJ, 659, L111
- [\citeauthoryearRupke & Veilleux2011] Rupke D. S. N., Veilleux S., 2011, ApJ, 729, L27
- [\citeauthoryearSilk & Rees1998] Silk J., Rees M. J., 1998, A&A, 331, L1
- [\citeauthoryearTakahashi et al.2007] Takahashi T. et al., 2007, PASJ, 59, 35
- [\citeauthoryearYoung et al.2007] Young S., Axon D. J., Robinson A., Hough J. H., Smith J. E., 2007, Nat, 450, 74
- [\citeauthoryearZubovas & King2012] Zubovas K., King A., 2012, ApJ, 745, L34