Pressure-induced phase transitions and the
tetragonal high-pressure modification of Fe1.08Te
Abstract
We report the effects of hydrostatic pressure on the temperature-induced phase transitions in Fe1.08Te in the pressure range 0–3 GPa using synchrotron powder x-ray diffraction (XRD). The results reveal a plethora of phase transitions. At ambient pressure, Fe1.08Te undergoes simultaneous first-order structural symmetry-breaking and magnetic phase transitions, namely from the paramagnetic tetragonal (P4/) to the antiferromagnetic monoclinic (P21/) phase. We show that, at a pressure of 1.33 GPa, the low temperature structure adopts an orthorhombic symmetry. More importantly, for pressures of 2.29 GPa and higher, a symmetry-conserving tetragonal-tetragonal phase transition has been identified from a change in the ratio of the lattice parameters. The succession of different pressure and temperature-induced structural and magnetic phases indicates the presence of strong magneto-elastic coupling effects in this material.
pacs:
74.62.Fj, 74.70.Xa, 61.50.KsI Introduction
The recent discovery of superconductivity in a Fe-based layered system by Kamihara kamihara2008iron opened up new avenues for research in the field of high transition-temperature superconductivity. The parent compounds of the Fe-superconductors display ubiquitous magnetic and structural phase transitions. In this context, the situation is similar to the cuprates for which the exact nature of the intricate interplay between structure, magnetism and superconductivity still remains elusive after more than two decades of intense research. Since the electronic and phononic excitations are extremely sensitive to the inter-atomic distances, high pressure can efficiently be used as a clean tuning parameter to systematically influence and, hence, gain insight into these complex ordering phenomena. The physical properties of Fe-pnictides and chalcogenides display strong pressure dependencies.chu2009high In the case of the 1111 and 122 families of compounds, pressure suppresses the magnetic transition temperature (Refs. Lorenz2008effect, ; Kumar2008effect, ) and concomitantly enhances the superconducting transition temperature , Takahashi2008 which suggests an intimate relationship between the two order parameters. Under pressure, some 1111-compounds (e. g., CaFeAsF) undergo a transition from the orthorhombic to lower symmetry monoclinic phase, Mishra2011 in contrast to the transition from orthorhombic to higher symmetry tetragonal phase found in 122-type compounds. Mittal2011 In undoped BaFe2As2 and SrFe2As2, pressure induces superconductivity with as high as 38 K.Takahashi2008high ; Kotegawa2009abrupt ; Igawa2009pressue ; colombier2009complete Pressure-induced superconductivity in the case of CaFe2As2 is controversial.Torikachvili2008pressure ; Yu2009absence However, all 122 systems exhibit a tetragonal collapsed phase that seems to exclude superconductivity.Kreyssig2008pressure ; Uhoya2010 ; Kasinathan2011
Among the different families of Fe-superconductors, the tetragonal Fe1+ySe with = 8 K can be considered as a reference material owing to its archetypical binary atomic pattern.Hsu2008 The structure belongs to the tetragonal space group and consists of edge-sharing FeSe4 tetrahedra, which form layers orthogonal to the -axis. The subtle interplay of structural and physical properties in Fe1+ySe is obvious from the fact that superconducting Fe1.01Se undergoes a structural transition from the tetragonal to the orthorhombic phase at 90 K while non-superconducting Fe1.03Se does not.McQueen2009 Moreover, Fe1.01Se displays the largest pressure coefficient in the family of Fe-based superconductors, with raising up to 37 K under a pressure of 7–9 GPa.Mizuguchi2008 ; Medvedev2009 ; Margadonna2009 Eventually, drops with further increase in pressure, and the crystal structure becomes hexagonal above a pressure of 25 GPa.Medvedev2009 In addition, of Fe1+ySe can also be enhanced by Te substitution up to a maximum of K for Fe1+ySe0.5Te0.5.Yeh2008 ; Fang2008 ; roessler2010 The bulk superconductivity disappears for higher Te substitution and no superconductivity has been found so far in bulk samples of the end-member Fe1+yTe. Instead, Fe1+yTe displays a unique interplay of magnetic and structural transitions in dependence on the amount of excess Fe, which is presumably accommodated in interstitial sites. PhysRevLett.102.247001 ; Li2009 ; Hu2009 ; rodriguez2011magnetic ; roessler2011 ; Zaliznyak The single, first-order magnetic and structural transition to the monoclinic space group observed at K in Fe1.06Te systematically decreases in temperature down to 57 K with an increase in from 0.06 to 0.11. For , two distinct magnetic and structural transitions occur: the magnetic transition takes place at a higher temperature than the structural one.roessler2011 Further, for , the low-temperature structure adopts orthorhombic symmetry, . PhysRevLett.102.247001 ; rodriguez2011magnetic ; roessler2011 This space group is a maximal non-isomorphic subgroup of with index 2. In turn, the space group of the
monoclinic arrangement is a maximal non-isomorphic subgroup of this orthorhombic variety with index 2.
So far, high-pressure structural investigations on Fe1+yTe are limited to ambient temperatures.Zhang2009 ; Jorgensen2009 A pressure-induced tetragonal lattice collapse has been reported for Fe1.05Te and Fe1.087Te at 300 K at a pressure of about 4 GPa.Zhang2009 ; Jorgensen2009 This collapsed tetragonal phase was found to be stable up to a pressure of 10 GPa. However, the magnetic and resistive anomalies observed in a high-pressure study of FeTe0.92 (corresponding to Fe1.086Te, cf. Ref. note, ) by Okada et al.okada2009successive suggested the presence of two pressure-induced phases at low temperatures. This succession of phase transitions resembles the resultroessler2011 obtained at ambient pressure but for higher Fe-content, . In order to clearly cross-correlate the influences on the structure exerted by either pressure or Fe excess, we have chosen to investigate a
| Temperature (K) | 285 | 20 |
|---|---|---|
| Space group | ||
| (Å) | 3.82326(4) | 3.83367(8) |
| (Å) | = | 3.78932(7) |
| (Å) | 6.2824(1) | 6.2594(1) |
| (degree) | 90 | 90.661(1) |
| 0.022/0.067 | 0.015/0.095 | |
| Number of reflections | 121 | 361 |
| Refined parameters for | ||
| profile/crystal structure | 20 / 6 | 29 / 11 |
| Atomic parameters | ||
| Fe1 | (,,0) | (,,) |
| = 0.93(2) | = 0.7379(4) | |
| = | ||
| = 0.23(2) | ||
| Fe2a | (,,) | (,,) |
| = 0.720(1) | = 0.238(4) | |
| = 0.9(1) | = 0.719(2) | |
| = 0.4(2) | ||
| Te | (,,) | (,,) |
| = 0.2807(6) | = 0.2431(2) | |
| = 1.08(1) | = 0.2810(1) | |
| = 0.21(1) 00footnotetext: Atomic displacement parameters, , and occupancies are intrinsically correlated and, therefore, can not be refined independently. Rietveld refinements performed with the nominal composition Fe1.08Te yielded unreasonably small or even negative values for . Realistic values of could be obtained with SOF(Fe2) = 0.09 corresponding to Fe1.09Te. |
sample with . For this composition, which is close to the one used in Ref. okada2009successive, , we determine the structure with increasing pressure GPa and compare the observed structural transformations to the influence of chemical composition.
II Experimental
Polycrystalline samples were synthesized by solid state reaction of Fe (Alfa Aesar, 99.995%) and Te pieces (Chempur, 99.9999%) in glassy carbon crucibles covered with lids. Mixtures of the target composition were placed in the sample containers and sealed in quartz ampules under vacuum (10-5 mbar). After heating to 973 K with a rate of 100 K/h, the samples were kept at this temperature for 24 h before increasing the temperature further up to 1173 K. The dwelling at 1173 K for 12 h was followed by
fast cooling to 973 K and annealing for 5 h. Finally, samples were cooled to room temperature at a rate of 100 K/h. Handling of starting materials and products was performed in argon-filled glove boxes. The synthesized samples were characterized by x-ray powder diffraction using Co K radiation ( = 1.788965 Å) and wavelength dispersive x-ray (WDX) analysis. The results clearly show that the samples selected for the present investigation are single phase with tetragonal symmetry, . According to chemical analysis, the samples contain less oxygen and carbon than the detection limit of 0.05 mass % and 0.06 mass %, respectively. As the physical properties of Fe1+yTe depend sensitively on the actual Fe-content , emphasis was put on its determination. The amount of Fe as obtained by an inductively-coupled plasma method is systematically 1–2 % higher than the nominal composition. On the other hand, WDX analysis reveals an amount of iron that is typically 3–4 % lower. However, within the estimated experimental error the results are consistent with the nominal composition. More importantly and in satisfactory
| Temperature (K) | 65 | 47.5 |
|---|---|---|
| Pressure P1(GPa) | 0.58 | 0.53 |
| Space group | ||
| (Å) | 3.7899(1) | 3.8076(1) |
| (Å) | 3.7758(1) | |
| (Å) | 6.2081(2) | 6.2147(3) |
| (degree) | 90 | 90.354(3) |
| 0.025/0.038 | 0.017/0.040 | |
| Number of reflections | 39 | 104 |
| Refined parameters for | ||
| profile/crystal structure | 22 / 6 | 27 / 9 |
| Atomic parameters | ||
| Fe1 | (,,0) | (,,) |
| = 0.29(5) | = 0.735(1) | |
| = | ||
| = 0.31(6) | ||
| Fe2a | (,,) | (,,) |
| = 0.711(4) | = 0.24(1) | |
| = 1.5(5) | = 0.729(4) | |
| = 0.30 (fixed) | ||
| Te | (,,) | (,,) |
| = 0.2841(1) | = 0.2480(6) | |
| = 0.19(3) | = 0.2827 (2) | |
| = 0.09(3) | ||
| Temperature (K) | 75 | 37.5 |
| Pressure P2(GPa) | 1.49 | 1.39 |
| Space group | ||
| (Å) | 3.7620(2) | 3.7746(4) |
| (Å) | 3.7506(4) | |
| (Å) | 6.1735(4) | 6.1757(7) |
| (degree) | 90 | 90 |
| 0.027/0.036 | 0.051/0.059 | |
| Number of reflections | 39 | 62 |
| Refined parameters for | ||
| profile / crystal structure | 25 / 6 | 24 / 6 |
| Atomic parameters | ||
| Fe1 | (,,0) | (,,) |
| = 0.10(5) | = | |
| = 0.28(7) | ||
| Fe2a | (,,) | (,,) |
| = 0.710(4) | = 0.699(6) | |
| = 0.8(4) | = 1.00 (fixed) | |
| Te | (,,) | (,,) |
| = 0.2867(1) | = 0.2862(2) | |
| = 0.42(3) | = 0.28(4) |
agreement, Rietveld refinements of high resolution synchrotron powder x-ray diffraction (XRD) data indicate a composition Fe1.09Te for the nominal composition Fe1.08Te (see Table 1). Similar subtle variations of the determined amount of Fe result also from alternative analysis methods as was reported independently.Zaliznyak
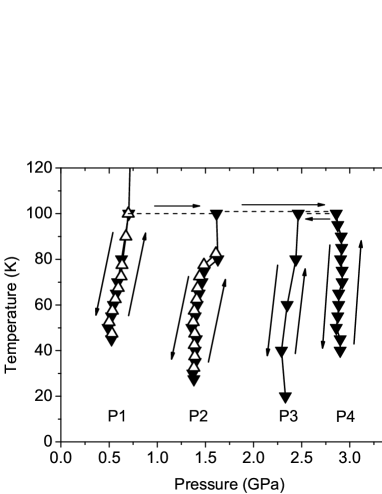
Our earlier study roessler2011 on Fe1.08Te revealed a sharp first-order transition at 65 K in the heat capacity accompanied by an anomaly in the temperature dependence of the electrical resistivity and the magnetic susceptibility , corresponding to a simultaneous magnetic and structural transition. In order to investigate this transition in detail, powder XRD experiments were performed in an angle-dispersive mode at the beam lines ID31 and ID09A of the ESRF (ID31: = 0.40006(3) Å or 0.39993(3) Å, ID09A: = 0.415165 Å). Temperatures down to K, both at ambient and elevated pressure, were realized utilizing special He-flow cryostats adapted to the requirements of the diffraction set-up environment. The powdered samples were taken in a thin-wall borosilicate glass capillary for ambient pressure measurements (ID31). High pressures were generated by means of the diamond anvil cell technique. The samples were placed in spark-eroded holes of pre-indented metal gaskets, together with small ruby spheres for pressure determination and liquid helium as a force-transmitting medium (ID09A). The protocol used for the pressure experiment is presented in Fig. 1. Lattice parameters were determined using the program package WinCSD,WINCSD refinements of the crystal structures were performed on the basis of full diffraction profiles with JANA. JANA In these least-squares procedures, the considerable effects of preferred orientation caused by the anisotropy of the crystal structure are accounted for by the March-Dollase formalism. March ; Dollase
III Results and discussion
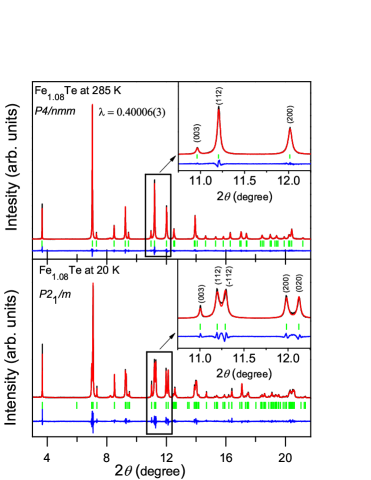
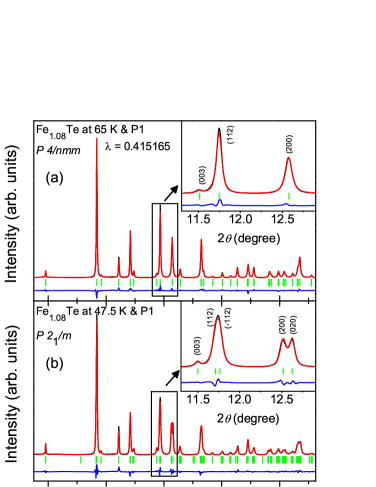
A full-profile refinement of powder XRD data measured at ambient pressure confirmed a temperature-induced transformation from tetragonal Fe1.08Te (space group at 285 K) into the monoclinic phase ( at 20 K) at low temperature (Fig. 2). Consistent with earlier results, PhysRevLett.102.247001 the phase transition is obvious from a clear splitting of Bragg peaks like (112) and (200). Refined structural parameters at 285 K and at 20 K are presented in Table 1.
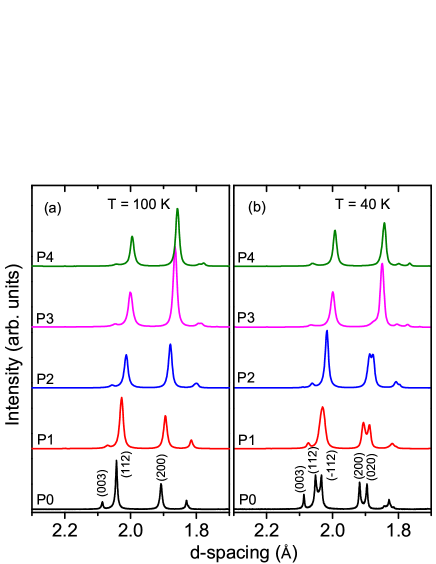
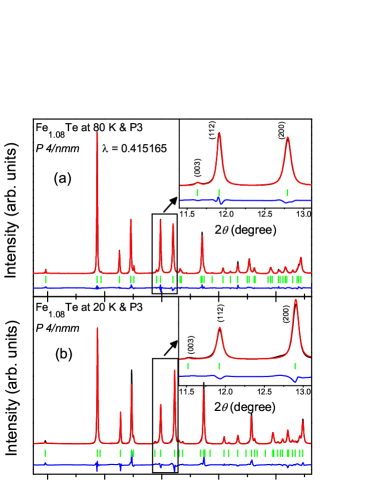
Powder XRD patterns of Fe1.08Te in the region of the (112) and (200) Bragg peaks recorded for four different pressure values up to 3 GPa are displayed in Fig. 3. At a temperature of 100 K [Fig. 3(a)], the diagrams evidence the stability of the tetragonal phase within the complete pressure range. The visible peaks shift upon increasing pressure, indicating a continuous compression. At around 2.9 GPa, the lattice parameters and are 2.6 % and 2.0 % smaller than those at ambient pressure, respectively. This
decrease in lattice parameters with pressure at 100 K is slightly smaller than the recently reported results for 300 K.Zhang2009 ; Jorgensen2009
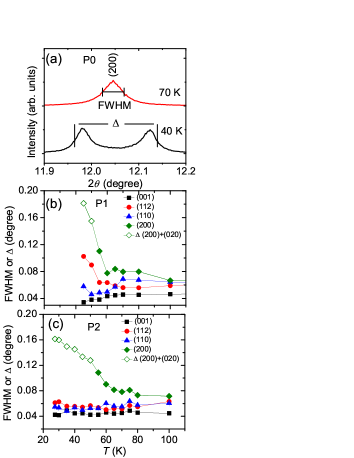
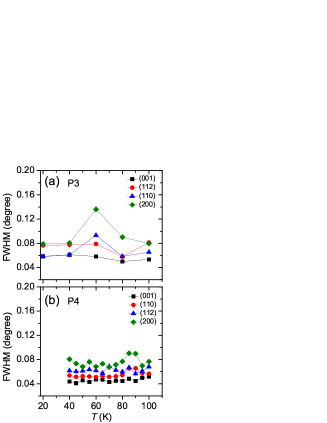
Upon cooling at only slightly elevated pressures (series P1, pressure values from 0.31–0.75 GPa dependent on temperature, see Fig. 1), additional diffraction lines indicate the onset of a structural change at 55 K. At this temperature, two phases are identified in the XRD patterns of Fe1.08Te. At lower temperatures, line broadening of the (112) reflection and a successive splitting of the (200) peak is observed [Fig. 3(b)]. In order to characterize the phase transition, the full width at half maximum (FWHM) as well as the sum of separation of peak maxima plus FWHM are depicted in Fig. 4. With decreasing temperature, the refined FWHM value of the (112) peak approximately doubles: from 0.0512(2)∘ at 295 K to 0.1025(1)∘ at 40 K, Fig. 4(b). Indexing of the reflections at low temperature requires monoclinic symmetry compatible with the ambient pressure low-temperature phase, . Crystal structure refinements of both high- and low-temperature modification are shown in Figs. 5 (a) and (b), and the refined parameter values are listed in Tab. 2.
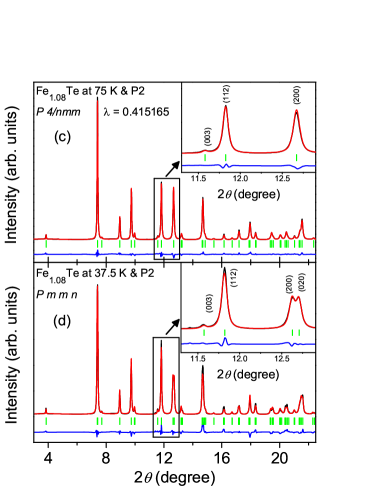
At slightly higher pressure (series P2, 1.38–1.65 GPa), the broadening of the (112) peak at low temperatures is completely suppressed (FWHM at 100 K: 0.0613(1)∘; 27.5 K: 0.0631(2)∘) while the splitting of the (200) and (020) Bragg peaks remains clearly visible, Fig. 4(c). Owing to the modified XRD pattern, the diagrams measured at temperatures of 55 K and below require an orthorhombic lattice for indexing.
Systematic extinctions are compatible with space group . Consistently, a first Le Bail refinement yields similarly low values of the residuals as the fit of a monoclinic model. However, the orthorhombic pattern involves a smaller number of free parameters and thus, the higher-symmetry model is selected for the crystal structure refinements using full diffraction profiles. The results for the low- and high-temperature modifications are visualized in Figs. 5(c) and (d), refined parameter values are included in Tab. 2.
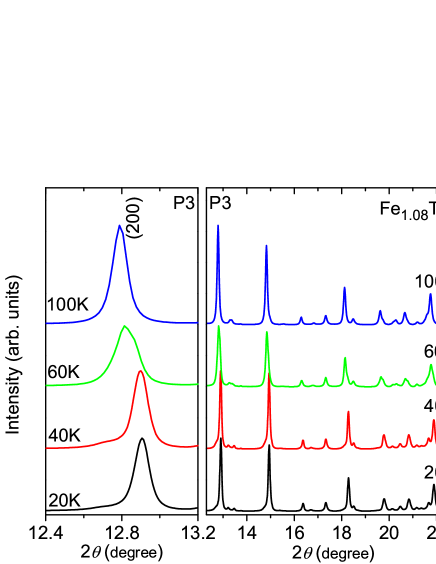
Upon further increase in pressure (series P3, 2.29–2.47 GPa, and P4, 2.86–2.92 GPa), cooling of the samples induces broadening or the formation of shoulders for some peaks (Fig. 6). For instance, in the series P3, the determined FWHM of peak (200) corresponds to 0.0797(2)∘ at 100 K, then it increases to 0.1362(2)∘ at 60 K, and finally decreases to 0.0784(1)∘ at 20 K, Fig. 7(a). The patterns of the observed changes in the series P3 and P4 clearly indicate a temperature-induced phase transition involving a two-phase region in which both modifications coexist. Phase coexistence is evidenced between 60 K and 40 K at P3, and between 90 K and 80 K at P4, Fig. 7(b). Co-existing phases in a very large pressure range have also been reported in the case of pnictide compounds at low temperatures. Mittal2011 ; Mishra2011
| Temperature (K) | 80 | 20 |
|---|---|---|
| Pressure P3(GPa) | 2.44 | 2.33 |
| Space group | ||
| (Å) | 3.7265(1) | 3.6946(1) |
| (Å) | ||
| (Å) | 6.1428(3) | 6.2010(5) |
| (degree) | 90 | 90 |
| 0.024/0.036 | 0.059/0.073 | |
| Number of reflections | 35 | 36 |
| Refined parameters for | ||
| profile / crystal structure | 23 / 5 | 26 / 5 |
| Atomic parameters | ||
| Fe1 | (,,0) | (,,) |
| = 0.53(5) | = 0.43(7) | |
| Fe2 | (,,) | (,,) |
| = 0.680(4) | = 0.662(6) | |
| = 0.4(4) | = 0.4 (fixed) | |
| Te | (,,) | (,,) |
| = 0.2911(2) | = 0.2955(3) | |
| = 0.36(3) | = 0.11(5) | |
| Temperature (K) | 100 | 40 |
| Pressure P4 (GPa) | 2.86 | 2.90 |
| Space group | ||
| (Å) | 3.7131(6) | 3.6835(1) |
| (Å) | ||
| (Å) | 6.1316(12) | 6.1769(5) |
| (degree) | 90 | 90 |
| 0.076/0.089 | 0.077/0.074 | |
| Number of reflections | 42 | 42 |
| Refined parameters for | ||
| profile / crystal structure | 23 / 3 | 22 / 5 |
| Atomic parameters | ||
| Fe1 | (,,0) | (,,) |
| = 0.3 (fixed) | = 0.95(7) | |
| Fe2 | (,,) | (,,) |
| = 0.68(1) | = 0.661(6) | |
| = 0.3 (fixed) | = 0.3 (fixed) | |
| Te | (,,) | (,,) |
| = 0.2922(4) | = 0.2948(3) | |
| = 0.3 (fixed) | = 0.21(4) |
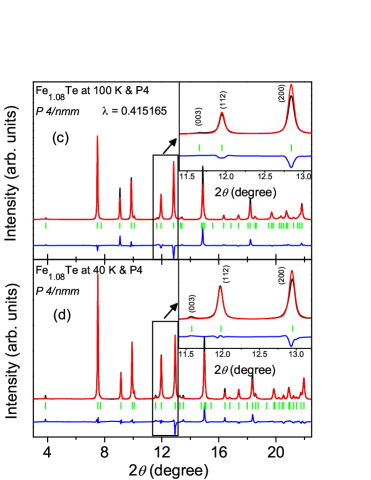
A detailed analysis of the line positions revealed that upon cooling Bragg peaks like (200) exhibit strong shifts towards higher angles whereas reflections like (00) are reallocated at lower values of (see, e.g., the (003) peak in the insets to Figs. 8). This finding implies that the phase transition into the low-temperature modification is associated with a pronounced increase in the ratio (see below). Comparison of the diffraction patterns measured at temperatures above and below this phase transition reveals a close similarity of the diffraction intensities. Specifically, no evidence for extra reflections which would indicate, e.g., a doubling of an translation period is observed. Moreover, the diffraction diagrams of the low-temperature phase can still be indexed assuming tetragonal symmetry, and the same systematic absences of reflections are observed for the high- and the low-temperature phase. The corresponding diffraction symbol is compatible only with the centrosymmetric space groups and . Inspection of the occupied Wyckoff positions ( and in both space groups) immediately reveals that the coordinate triplets are the same for both choices. Thus, the higher Laue class was selected for the subsequent refinements. The least-squares fit results of the structure models to the diffraction
profiles measured above and below the transition at P3 and P4 are shown in Figs. 8(a)–(d); the refined parameter values are summarized in Tab. 3.
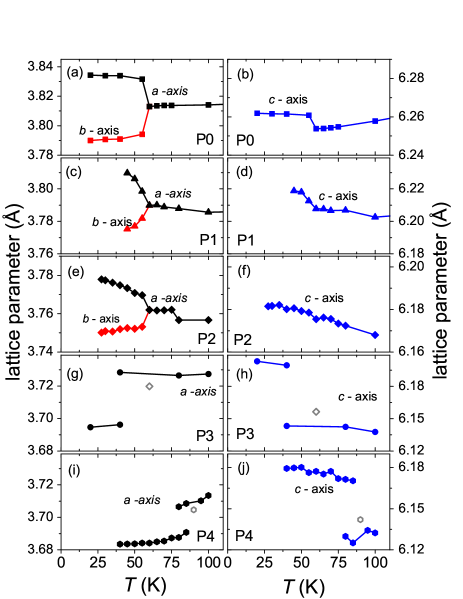
For a comparison of the metrical changes, the temperature dependence of the lattice parameters obtained from the refinements at ambient as well as at elevated pressures are summarized in Figs. 9(a)–(j). It can be seen that the symmetry-breaking transitions (tetragonal to monoclinic or to orthorhombic) are associated with a significantly anisotropic change of the unit cell dimensions, see Figs. 9(a)–(f). In the case of the symmetry-conserving transition (tetragonal to tetragonal) the lattice parameter contracts by % while
increases by approximately the same amount upon transforming into the low-temperature phase, see Figs. 9(g)–(j).
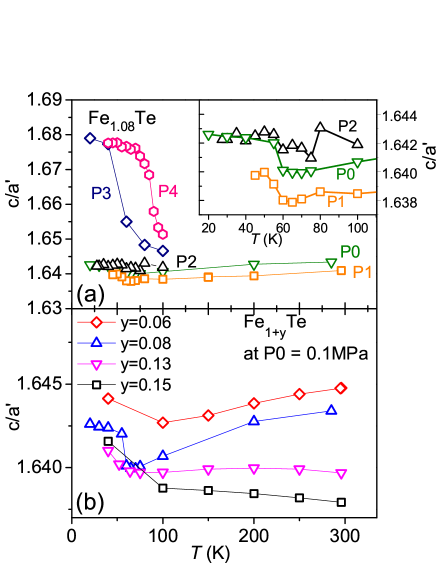
Putting some emphasis on the similarity between pressure and Fe excess, the temperature-induced changes of are compared for both parameters. Analysis of the ratio (in which for tetragonal symmetry, and for orthorhombic and monoclinic symmetries) reveals that the symmetry-breaking transitions at P0–P2 or compositions Fe1+yTe with cause only minute changes of the ratio , whereas the symmetry-conserving transition gives rise to a significantly more pronounced alteration, Figs. 10(a) and (b).
IV Summary and Conclusions
The anomaly that has been detected okada2009successive in resistivity measurements on Fe1.086Te for pressures GPa is conjectured to originate from a tetragonal–monoclinic phase transition. Our structure investigations confirm this picture. This phase transition occurs at K. At somewhat higher pressures P2 ( GPa), Fig. 9(e), we clearly resolve a phase transition into the orthorhombic phase at K. Yet, the change in at around 75 K is of similar magnitude as the alterations associated to the symmetry-breaking transitions at P0 and P1 around 60 K (see inset of Fig. 10 (a)). This pressure-driven subtle discontinuity within the tetragonal phase is consistent with a change observed for the onset of magnetic order in the temperature-composition phase diagram, Fig. 11. At still higher pressures, P3 and P4, we identify another symmetry-conserving phase transition. The temperature of this transition increases with pressure, from K at 2.29 GPa to K at 2.9 GPa. There is no indication of the presence of any orthorhombic or monoclinic phases at these higher pressures. With this, one might speculate that the unidentified transition into phase HPII of Ref. okada2009successive, coincides with our symmetry-conserving phase transition.
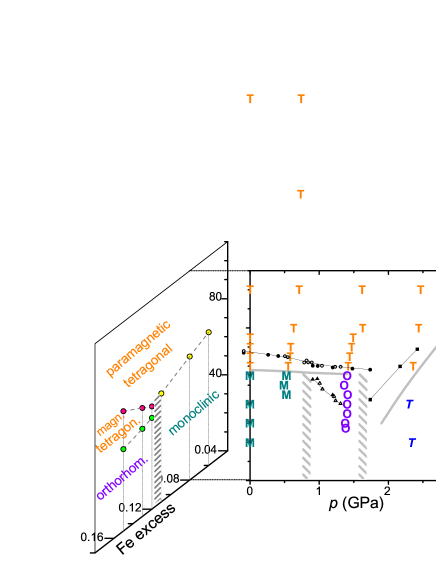
Our pressure studies on Fe1.08Te here, along with our earlier investigationsroessler2011 on Fe1+yTe samples with different Fe excess , suggest some analogy between the influence of pressure and Fe excess. These results together with results of Ref. okada2009successive, are summarized in Fig. 11 for comparison. For small pressures as well as for small Fe excess we find a single transition from a tetragonal into a monoclinic low-temperature phase at roughly 60 K.note2 At a higher pressure GPa or higher Fe excess two successive transitions appear to take place. Consistently, the transition at lower temperature (46 K) results in an orthorhombic low-temperature phase. The second transition at somewhat higher temperature (e.g. at 57 K for ) seems to retain the tetragonal symmetry but drives the material from a paramagnetic into a magnetically ordered phase. For even higher pressures GPa we find a symmetry-conserving phase transition. So far, no analogy to this latter transition has been observed for samples with increased Fe excess, likely because of the high amount of excess Fe beyond the homogeneity range of 6–15 % that would be required. The exact nature of the magnetism in the teragonal high-pressure phase remains to be investigated.
The close similarity of the temperature-composition and the temperature-pressure phase diagrams suggests a strong magneto-elastic coupling between the magnetic and structural order parameters in Fe1+yTe. Paul paul presented a mean-field theory, in which symmetry-allowed magneto-elastic couplings give rise to monoclinic lattice distortion in the magnetic phase. The magneto-elastic couplings seem to vary with . For , the magnetic structure becomes incommensurate with respect to the crystal lattice. Neutron scattering studies report a helical modulation of the magnetic moments with a temperature-dependent propagation vector. PhysRevLett.102.247001 ; rodriguez2011magnetic The structural transition into the orthorhombic phase at lower temperature takes place only when the magnetic propagation vector becomes temperature-independent, i.e., at the lock-in transition. roessler2011 Application of pressure induces increased overlap of the atomic orbitals which in turn tunes the magneto-elastic couplings. This results in similar magnetic structures as observed in Fe1+yTe with . The microscopic origin of the magnetic and crystal structures in this regime is not yet theoretically addressed.
In conclusion, we showed that pressure strongly influences the phase transitions of Fe1.08Te found at low temperatures. The temperature-dependent phase transitions can be successively changed from low-pressure tetragonal–monoclinic to tetragonal–orthorhombic followed by tetragonal–tetragonal with increasing compression. The pressure-dependent phase transitions closely resemble those induced by excess Fe composition.
After submission of this article we recognize a report of an evolution of a two step structural phase transition, tetragonal–orthorhombic–monoclinic, with a two phase (monoclinic + orthorhombic) coexistence at low temperatures in Fe1.13Te. Mizuguchi12
Acknowledgements.
The authors wish to thank Yu. Grin, K. Koepernik, U. K. Rößler and L. H. Tjeng for stimulating discussions. H. R. thanks SPP 1458 and C. B. thanks CNV–foundation for financial support. We also acknowledge the ESRF for granting beam time at ID09A and ID31. Experimental support of Adrian Hill is highly appreciated.*
Appendix A Lattice parameters at different temperatures and pressures
The various phase transitions as outlined in the main text are supported by the results of lattice parameter determinations at different pressures which are summarized in the following Tables IV to VII.
| Temperature (K) | Pressure (GPa) | (Å) | (Å) | (Å) | (degree) |
|---|---|---|---|---|---|
| 296 | 0.31 | 3.80876(3) | - | 6.25002(8) | - |
| 200 | 0.74 | 3.79060(2) | - | 6.21435(7) | - |
| 150 | 0.73 | 3.78497(2) | - | 6.20402(7) | - |
| 100 | 0.71 | 3.78560(1) | - | 6.20261(7) | - |
| 80 | 0.63 | 3.78785(2) | - | 6.20679(7) | - |
| 70 | 0.59 | 3.78886(2) | - | 6.20654(7) | - |
| 65 | 0.58 | 3.79004(3) | - | 6.2076(1) | - |
| 60 | 0.55 | 3.78979(2) | - | 6.2078(2) | - |
| 55 | 0.53 | 3.79845(7) | 3.78174(7) | 6.2125(2) | 90.191(3) |
| 50 | 0.49 | 3.80612(6) | 3.77699(5) | 6.2180(2) | 90.333(2) |
| 45 | 0.53 | 3.80975(7) | 3.77519(6) | 6.2187(2) | 90.399(2) |
| Temperature (K) | Pressure (GPa) | (Å) | (Å) | (Å) |
|---|---|---|---|---|
| 100 | 1.62 | 3.75664(1) | 6.1680(1) | |
| 80 | 1.63 | 3.75666(1) | 6.17239(9) | |
| 75 | 1.49 | 3.76208(2) | 6.17338(8) | |
| 70 | 1.47 | 3.76178(1) | 6.17552(8) | |
| 65 | 1.44 | 3.76172(2) | 6.17618(8) | |
| 60 | 1.42 | 3.76200(2) | 6.17541(9) | |
| 55 | 1.40 | 3.76965(6) | 3.75316(7) | 6.1785(2) |
| 50 | 1.36 | 3.77082(6) | 3.75216(6) | 6.1793(2) |
| 45 | 1.41 | 3.77332(5) | 3.75248(5) | 6.1805(2) |
| 40 | 1.40 | 3.77487(5) | 3.75197(5) | 6.1801(2) |
| 35 | 1.40 | 3.77614(5) | 3.75069(5) | 6.1820(2) |
| 30 | 1.37 | 3.77740(6) | 3.75090(6) | 6.1817(2) |
| 27.5 | 1.38 | 3.77788(6) | 3.75016(6) | 6.1814(2) |
| Temperature (K) | Pressure (GPa) | (Å) | (Å) |
|---|---|---|---|
| 100a | 2.47 | 3.72742(2) | 6.1377(2) |
| 80a | 2.44 | 3.72644(2) | 6.14246(9) |
| 60b | 2.36 | 3.71976(2) | 6.1563(2) |
| 40a | 2.29 | 3.7284(5) | 6.143(2) |
| 40c | 2.29 | 3.69615(2) | 6.1996(1) |
| 20c | 2.33 | 3.69469(2) | 6.2033(2) |
| Temperature (K) | Pressure (GPa) | (Å) | (Å) |
|---|---|---|---|
| 100a | 2.86 | 3.71343(1) | 6.1323(2) |
| 95a | 2.89 | 3.71017(1) | 6.1341(2) |
| 90b | 2.91 | 3.70464(1) | 6.1421(2) |
| 85a | 2.92 | 3.7085(1) | 6.125(5) |
| 85c | 2.92 | 3.69071(6) | 6.170(4) |
| 80a | 2.91 | 3.7065(2) | 6.130(6) |
| 80c | 2.91 | 3.68757(3) | 6.171 (2) |
| 75c | 2.92 | 3.68728(1) | 6.1719(3) |
| 70c | 2.92 | 3.68541(1) | 6.1773(3) |
| 65c | 2.89 | 3.68496(1) | 6.1753(2) |
| 60c | 2.89 | 3.68419(1) | 6.1773(2) |
| 55c | 2.88 | 3.68409(1) | 6.1764(2) |
| 50c | 2.87 | 3.68371(1) | 6.1802(2) |
| 45c | 2.9 | 3.68358(1) | 6.1798(2) |
| 40c | 2.9 | 3.68347(1) | 6.1794(2) |
References
- (1) Y. Kamihara, T. Watanabe, M. Hirano, and H. Hosono, J. Am. Chem. Soc. 130, 3296 (2008).
- (2) For a review of high pressure studies see, C. W. Chu and B. Lorenz, Physica C 469, 385 (2009).
- (3) B. Lorenz, K. Sasmal, R. P. Chaudhury, X. H. Chen, R. H. Liu, T. Wu, and C. W. Chu, Phys. Rev. B 78, 012505 (2008).
- (4) M. Kumar, M. Nicklas, A. Jesche, N. Caroca-Canales, M. Schmitt, M. Hanfland, D. Kasinathan, U. Schwarz, H. Rosner, and C. Geibel, Phys. Rev. B 78, 184516 (2008).
- (5) H. Takahashi, K. Igawa, K. Arii, Y. Kamihara, M. Hirano, and H. Hosono, Nature (London) 453, 376 (2008).
- (6) S. K. Mishra, R. Mittal, S. L. Chaplot, S. V. Ovsyannikov, D. M. Trots, L. Dubrovinsky, Y. Su, Th. Brueckel, S. Matsuishi, H. Hosono, and G. Garbarino, Phys. Rev. B 84, 224513 (2011).
- (7) R. Mittal, S. K. Mishra, S. L. Chaplot, S. V. Ovsyannikov, E. Greenberg, D. M. Trots, L. Dubrovinsky, Y. Su, Th. Brueckel, S. Matsuishi, H. Hosono, and G. Garbarino, Phys. Rev. B 83, 054503 (2011).
- (8) H. Takahashi, H. Okada, K. Igawa, K. Arii, Y. Kamihara, S. Matsuishi, M. Hirano, H. Hosono, K. Matsubayashi and Y. Uwatoko, J. Phys. Soc. Jpn. 77, Suppl. C 78 (2008).
- (9) H. Kotegawa, H. Sugawara, and H. Tou, J. Phys. Soc. Jpn. 78, 013709 (2009).
- (10) K. Igawa, H. Okada, H. Takahashi, S. Matsuishi, Y. Kamihara, M. Hirano, H, Hosono, K. Matsubayashi and Y. Uwatoko, J. Phys. Soc. Jpn. 78, 025001 (2009).
- (11) E. Colombier, S. L. Bud’ko, N. Ni, and P. C. Canfield, Phys. Rev. B 79, 224518 (2009).
- (12) M. S. Torikachvili, S. L. Bud’ko, N. Ni, and P. C. Canfield, Phys. Rev. Lett. 101, 057006 (2008).
- (13) W. Yu, A. A. Aczel, T. J. Williams, S. L. Bud’ko, N. Ni, P. C. Canfield, and G. M. Luke, Phys. Rev. B 79, 020511(R) (2009).
- (14) A. Kreyssig, M. A. Green, Y. Lee, G. D. Samolyuk, P. Zajdel, J. W. Lynn, S. L. Bud’ko, M. S. Torikachvili, N. Ni, S. Nandi, J. B. Leão, S. J. Poulton, D. N. Argyriou, B. N. Harmon, R. J. McQueeney, P. C. Canfield, and A. I. Goldman, Phys. Rev. B 78, 184517 (2008).
- (15) W. Uhoya, A. Stemshorn, G. Tsoi, Y. K. Vohra, A. S. Sefat, B. C. Sales, K. M. Hope, and S. T. Weir, Phys. Rev. B 82, 144118 (2010).
- (16) D. Kasinathan, M. Schmitt, K. Koepernik, A. Ormeci, K. Meier, U. Schwarz, M. Hanfland, C. Geibel, Y. Grin, A. Leithe-Jasper, and H. Rosner, Phys. Rev. B 84, 054509 (2011).
- (17) F.-C. Hsu, J.-Y. Luo, K.-W. Yeh, T.-K. Chen, T.-W. Huang, P. M. Wu, Y.-C. Lee, Y.-L. Huang, Y.-Y. Chu, D.-C. Yan, and M.-K. Wu, Proc. Natl. Acad. Sci. USA 105, 14262 (2008).
- (18) T. M. McQueen, A. J. Williams, P. W. Stephens, J. Tao, Y. Zhu, V. Ksenofontov, F. Casper, C. Felser, and R. J. Cava, Phys. Rev. Lett. 103, 057002 (2009).
- (19) Y. Mizuguchi, F. Tomioka, S. Tsuda, T. Yamaguchi, and Y. Takano, Appl. Phys. Lett. 93, 152505 (2008).
- (20) S. Medvedev, T. M. McQueen, I. A. Troyan, T. Palasyuk, M. I. Eremets, R. J. Cava, S. Naghavi, F. Casper, V. Ksenofontov, G. Wortmann, and C. Felser, Nature Mater. 8, 630 (2009).
- (21) S. Margadonna, Y. Takabayashi, Y. Ohishi, Y. Mizuguchi, Y. Takano, T. Kagayama, T. Nakagawa, M. Takata, and K. Prassides, Phys. Rev. B 80, 064506 (2009).
- (22) K.-W. Yeh, T.-W. Huang, Y.-L. Huang, T.-K. Chen, F.-C. Hsu, P. M. Wu, Y.-C. Lee, Y.-Y. Chu, C.-L. Chen, J.-Y. Luo, D.-C. Yan, and M.-K. Wu,, Europhys. Lett. 84, 37002 (2008).
- (23) M. H. Fang, H. M. Pham, B. Qian, T. J. Liu, E. K. Vehstedt, Y. Liu, L. Spinu, and Z. Q. Mao, Phys. Rev. B 78, 224503 (2008).
- (24) S. Rößler, D. Cherian, S. Harikrishnan, H. L. Bhat, S. Elizabeth, J. A. Mydosh, L. H. Tjeng, F. Steglich, and S. Wirth, Phys. Rev. B 82, 144523 (2010).
- (25) W. Bao, Y. Qiu, Q. Huang, M. A. Green, P. Zajdel, M. R. Fitzsimmons, M. Zhernenkov, S. Chang, M. Fang, B. Qian, E. K. Vehstedt, J. Yang, H. M. Pham, L. Spinu, and Z. Q. Mao, Phys. Rev. Lett. 102, 247001 (2009).
- (26) S. Li, C. de la Cruz, Q. Huang, Y. Chen, J. W. Lynn, J. Hu, Y.-L. Huang, F.-C. Hsu, K.-W. Yeh, M.-K. Wu, and P. Dai, Phys. Rev. B 79, 054503 (2009).
- (27) R. Hu, E. S. Bozin, J. B. Warren, and C. Petrovic, Phys. Rev. B 80, 214514 (2009).
- (28) E. E. Rodriguez, C. Stock, P. Zajdel, K. L. Krycka, C. F. Majkrzak, P. Zavalij, and M. A. Green, Phys. Rev. B 84, 064403 (2011).
- (29) S. Rößler, D. Cherian, W. Lorenz, M. Doerr, C. Koz, C. Curfs, Yu. Prots, U. K. Rößler, U. Schwarz, S. Elizabeth, and S. Wirth, Phys. Rev. B 84, 174506 (2011).
- (30) I. A. Zaliznyak, Z. J. Xu, J. S. Wen, J. M. Tranquada, G. D. Gu, V. Solovyov, V. N. Glazkov, A. I. Zheludev, V. O. Garlea, and M. B. Stone, Phys. Rev. B 85, 085105 (2012).
- (31) C. Zhang, W. Yi, L. Sun, X.-J. Chen, R. J. Hemley, H.-K. Mao, W. Lu, X. Dong, L. Bai, J. Liu, A. F. Moreira Dos Santos, J. J. Molaison, C. A. Tulk, G. Chen, N. Wang, and Z. Zhao, Phys. Rev. B 80, 144519 (2009).
- (32) J.-E. Jørgensen, J. S. Olsen, and L. Gerward, High Pressure Res. 31, 603 (2011).
- (33) Note that some authors use FeTe1-δ rather than Fe1+yTe. Since experimental evidence for substantial chalcogen vacancies is lacking, the latter notation is more frequently used. Here, FeTe0.92 corresponds to Fe1.086Te.
- (34) H. Okada, H. Takahashi, Y. Mizuguchi, Y. Takano, and H. Takahashi, J. Phys. Soc. Jpn. 78, 083709 (2009).
- (35) WinCSD, L. G. Akselrud, P. Y. Zavalii, Yu. Grin, V. K. Pecharsky, B. Baumgartner, and E. Wölfel, Mater. Sci. Forum 133-136, 335 (1993).
- (36) JANA: V. Petricek, M. Dusek and L. Palatinus, JANA 2006. The Crystallographic Computing System, Institute of Physics, Praha, Czech Republic (2006).
- (37) A. March, Z. Kristallogr. 81, 285 (1932).
- (38) W. A. Dollase, J. Appl. Cryst. 19, 267 (1986).
- (39) There are minor differences in the transition temperatures as determined by structural investigations at ambient pressure in this work, and for the sample with by thermodynamic and magnetic measurements.roessler2011 These small differences are assigned to the different cooling protocols and a possible difference in the estimated chemical composition.
- (40) I. Paul, A. Cano, and K. Sengupta, Phys. Rev. B 83, 115109 (2011).
- (41) Y. Mizuguchi, K. Hamada, K. Goto, H. Takatsu, H. Kadowaki, and O. Miura, Solid State Commun. 152, 1047 (2012).