First-order structural transition in the magnetically ordered phase of Fe1.13Te
Abstract
Specific heat, resistivity, magnetic susceptibility, linear thermal expansion (LTE), and high-resolution synchrotron X-ray powder diffraction investigations of single crystals Fe1+yTe (0.06 0.15) reveal a splitting of a single, first-order transition for 0.11 into two transitions for 0.13. Most strikingly, all measurements on identical samples Fe1.13Te consistently indicate that, upon cooling, the magnetic transition at precedes the first-order structural transition at a lower temperature . The structural transition in turn coincides with a change in the character of the magnetic structure. The LTE measurements along the crystallographic -axis displays a small distortion close to due to a lattice striction as a consequence of magnetic ordering, and a much larger change at . The lattice symmetry changes, however, only below as indicated by powder X-ray diffraction. This behavior is in stark contrast to the sequence in which the phase transitions occur in Fe pnictides.
pacs:
74.70.Xa, 65.40.De, 65.60.+aI Introduction
The recent discovery kamihara2008iron of superconductivity in iron-based LaFeAsO1-xFx (a member of the so-called 1111 family) with a transition temperature = 26 K ignited tremendous experimental and theoretical interest surrounding this family of compounds. The superconducting members of the ferropnictides exhibit transition temperatures as high as 56 K. wang2008thorium These materials display a strong competition between structural, magnetic, and superconducting transitions. One of the features common to both the high- copper oxide and Fe-based superconductors is that the superconductivity emerges when an antiferromagnetic order is suppressed by chemical substitution or doping. While the initial interest was driven by the discovery of superconductivity in different crystal systems with higher , the current emphasis is focused on understanding the origin of the magnetic order and its relation to the superconductivity. The members of the 1111 family undergo a structural transition () followed by a magnetic transition () at lower temperatures, de2008magnetic ; PhysRevLett.101.077005 ; luo2009evidence ; Jesche2010 whereas in the 122 compounds these two transitions occur simultaneously. PhysRevB.78.020503 ; PhysRevB.78.180504 ; PhysRevB.78.014523 Several theoretical models have been proposed for the possible microscopic mechanisms coupling the magnetic and structural transitions. Among these, the prominent ones are the itinerant-electron model based on the nesting properties of the Fermi surface, PhysRevB.79.134510 the local moment model favoring a spin-nematic-driven structural transition, fang2008theory ; xu2008ising and an implementation of orbital ordering into the double exchange model PhysRevB.80.224504 where the structural transition is induced by an orbital, rather than a magnetic, ordering. On the other hand, a phenomenological Ginzburg-Landau model shows that the magneto-elastic coupling between the different order parameters can explain some of the experimentally observed phase transition scenarios. cano2010interplay However, none of the theories developed up to now predict a possibility of a structural transition taking place well within the magnetically ordered phase, i.e. for magnetic ordering occurring at a higher temperature than the structural transition, , in Fe pnictides and chalcogenides.
Tetragonal Fe1+yTe, the non-superconducting phase, occurs only with excess iron in the range 0.06 0.15. Its crystal structure is intermediate between the PbO (10) and Cu2Sb (38) types. It may be regarded as either PbO type with less than 0.2 extra atoms per cell, or Cu2Sb with more than 0.8 unoccupied Fe sites, okamoto1990fe both described within the space group. The nature of the antiferromagnetism in this material is remarkably different in comparison to the FeAs superconductors. In the FeAs based systems, the propagation vector of the spin-density-wave (SDW) is () with respect to the tetragonal lattice. This corresponds to a wave vector connecting the and points in the Brillouin zone. In Fe1+yTe, in contrast, the corresponding wave vector is (, 0), i.e. it is rotated by 45∘ with respect to the ordering in the FeAs families. PhysRevLett.102.247001 ; PhysRevB.79.054503 ; Liu2010 This implies that in Fe1+yTe the nesting properties of the Fermi surface do not play any role in the origin of the antiferromagnetism. However, up to now it has been believed that, in similarity to the 122 family, the antiferromagnetic transition at around K is simultaneously accompanied by a first-order structural distortion to the monoclinic space group . PhysRevB.79.054503 With increasing amount of interstitial Fe the wave vector changes to an incommensurate (, 0), and the crystal structure adopts a higher symmetry (orthorhombic space group ) at low temperatures. PhysRevLett.102.247001 Moreover, a very recent neutron scattering experiment rodriguez2011magnetic revealed that the magnetic structure in Fe1+yTe is even more complex: at a critical concentration 0.124, the magnetic structure turns into an incommensurate helix.
Here, we report on concerted investigations on Fe1+yTe with 0.06 0.15, with focus on samples with 0.11 and 0.13, i.e. around the critical concentration. It is found that the decreases systematically from 70 K for 0.06 to 57 K for 0.11. Most importantly, we demonstrate that the magnetic and structural transitions in Fe1.13Te are separated in temperature by about 11 K, with the antiferromagetic ordering occurring at higher temperature than the structural transition. Our results show that the magnetic behavior in the pnictides and chalcogenides could be entirely different and cast a serious challenge to many existing theories of Fe superconductors.
II Experimental details
Single crystals Fe1+yTe were grown using a horizontal Bridgman setup. The details of the crystal growth procedure were similar to those described in Ref. [20], except for a different cooling rate. In the present case of Fe1+yTe, after furnace translation, the samples were cooled down at a rate of 5 ∘C/h from 950 ∘C to 700 ∘C, followed by cooling to room temperature with 25 ∘C/h. The crystals were characterized by Laue photographs, powder X-ray diffraction, chemical analysis, and EDXS. The composition was determined from the lattice parameters Koz calibrated for mass loss during growth, and EDXS. The specific heat was measured using a Quantum Design physical property measurement system (PPMS) with a heat-pulse relaxation technique. At each measured temperature data point, 2 % temperature rise and a measurement time with two time constants were used. The electrical resistivity was also measured using the PPMS whereas the magnetic susceptibility was obtained by means of a SQUID vibration sample magnetometer. The diffraction data were collected on the high-resolution powder diffraction beamline ID31 (wavelength of 39.992 pm) at the ESRF, Grenoble, using a liquid-He cryostat. A sensitive tilted-plate capacitive dilatometer rotter1998miniature with a resolution of relative length changes was employed to measure the linear thermal expansion (LTE) along the crystallographic axis.
III Results and discussion
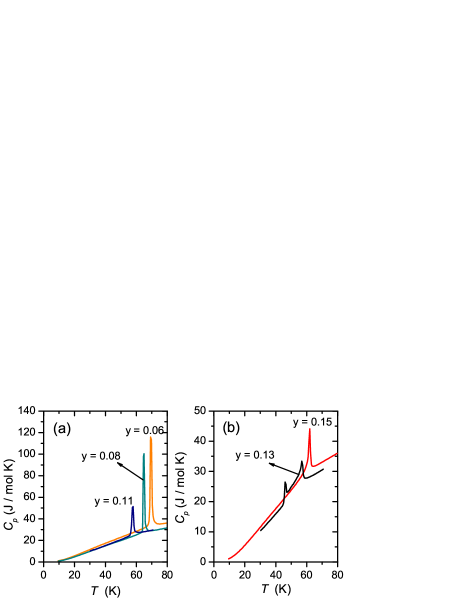
The temperature dependence of specific heat of Fe1+yTe for = 0.06, 0.08, 0.11, 0.13, and 0.15 is presented in Fig. 1. For = 0.06, shows a sharp first-order peak corresponding to a simultaneous magnetic and structural transition at 70 K. This transition temperature monotonically decreases to 57 K with increasing to 0.11. The transition temperature is drastically suppressed with respect to that in Fe1.06Te due to the increased amount of interstitial Fe, a finding consistent with previous studies. PhysRevB.80.174509 Instead of a continued suppression of , the further increased amount of interstitial Fe in Fe1.13Te gives rise to a dramatically different behavior, Fig. 1(b). Two clearly distinct transitions are observed: First, a -like transition at 57 K, followed by a first-order phase transition at 46 K. For even more interstitial Fe, = 0.15, the temperature at which the -like transition occurs increases to 63 K, but the low-temperature first-order transition could not be clearly resolved in the specific heat measurements.
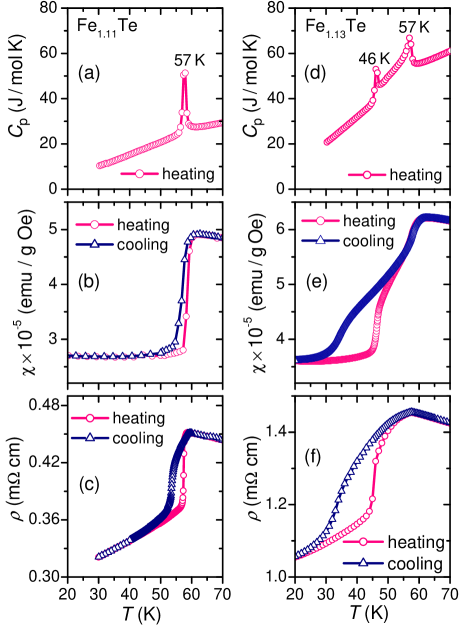
To investigate the nature of phase transitions in Fe1+yTe around the critical concentration where successive phase transitions occur, we conducted magnetic susceptibility and electrical resistivity measurements for = 0.11 and 0.13. In Fig. 2, and data are presented along with for these samples for comparison. in Fig. 2(a) clearly displays a sharp first-order transition at 57 K. This temperature corresponds to a simultaneous structural and SDW transition, . The coincident SDW transition is confirmed by a sudden decline in the magnetic susceptibility around 57 K, Fig. 2(b). The cooling and heating susceptibility cycles measured in a field of 0.1 T show a thermal hysteresis typical for a first-order phase transition. The in-plane ( plane) resistivity displays a corresponding transition from a semiconducting to metallic behavior, as can be seen in Fig. 2(c).
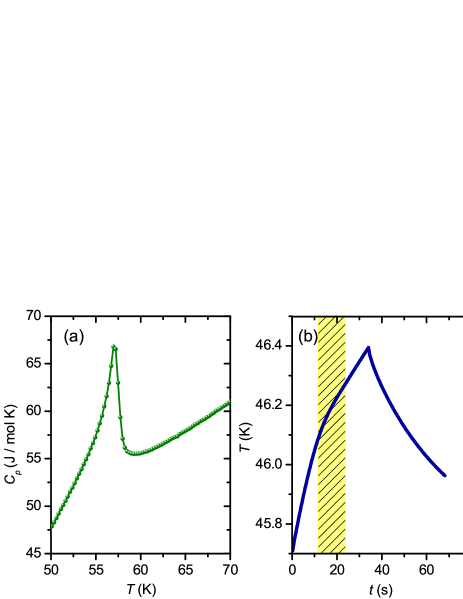
In Fig. 2(d), for Fe1.13Te is given. The high-temperature transition at = 57 K in Fig. 2(d) is unmistakable -like, proving that the phase transition is of second order, and can be described by a power law divergence. The -like shape of this transition is obvious in the high temperature-resolution data provided in Fig. 3(a). The transition at lower temperature, K, in Fe1.13Te is similar in shape to the single one observed in Fe1.11Te (see Fig. 2(a)), where a latent heat is involved and hence, is of first-order in nature. In order to confirm the first-order nature of the transition, the temperature-time relaxation curve is presented in Fig. 3(b). It clearly displays a temperature arrest around 46 K in the warming part (shaded region) of the relaxation curve. As expected for this case, it clearly displays a first-order nature of the transition. In the cooling part, however, the temperature arrest was not observed, suggesting that the first-order transition is spread over a wider temperature interval. This argument is also supported by a broader transition observed in the cooling measurement, Fig. 2(e). This finding, along with the results presented below, indicates that a change in the crystal structure occurs only at the low-temperature transition. With this assignment the lower values of just below suggest a discontinuous jump in the phononic background. This typically happens at a structural transition due to softened optical phonons.
A continuous transition followed by a first-order transition in Fe1.13Te can also be discerned from the susceptibility measurements shown in Fig. 2(e): first decreases continuously at around 57 K, followed by a sharp jump upon further reduction of temperature. A huge thermal hysteresis covering a width of 25 K in the field-cooled and heating protocols was found only at the low temperate transition. However, the thermal hysteresis in the resistivity is broader and remains up to the high temperature transition, Fig. 2(f). Here we note that similar successive phase transitions have also been observed in resistivity measurements on Fe1.086Te above an applied pressure of about 1 GPa. okada2009successive This suggests that the addition of interstitial Fe beyond produces similar effects like application of pressure on Fe1+yTe with smaller amount of interstitial Fe.
In order to unambiguously confirm the above assignment of the structural transition to K in Fe1.13Te we performed high-resolution synchrotron X-ray diffraction of the powdered single crystals at several selected temperatures. In Fig. 4, the diffraction data collected above (300 K, 64 K), between and (52 K), and below (40 K) are presented. The pattern at 300 K could be well fitted within the tetragonal space group, PhysRevLett.102.247001 ; PhysRevB.79.054503 see Fig. 4(b). Upon crossing = 57 K, the structure remains unchanged, i.e. tetragonal, as can be seen from the pattern at K. Note that at 52 K, the peak corresponding to the (200) reflection starts to broaden indicating a structural instability arising due to the fluctuations in the vicinity of the phase transition. Notably, the pattern at 40 K is clearly different. The observed splitting of the diffraction peaks, specifically of the tetragonal (200) at higher into (200) and (020) at 40 K see Fig. 4(a), is compatible with an orthorhombic symmetry below .
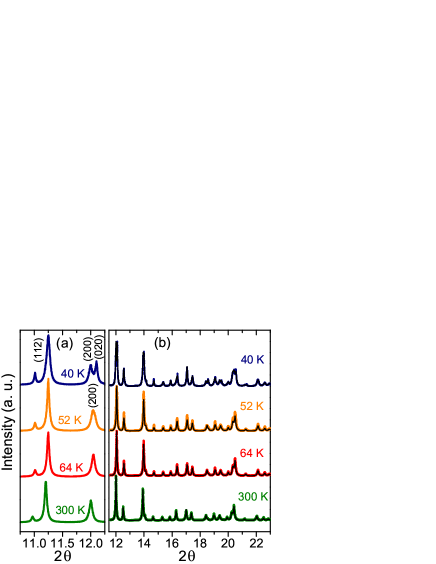
Moreover, the intensities observed at 40 K can be described by a structure model in the space group . This result is consistent with neutron scattering studies on Fe1.141Te. PhysRevLett.102.247001
In Fig. 5(a) and (b), we present the LTE and the corresponding LTE coefficient of the Fe1.13Te sample along the crystallographic axis. Upon cooling, the LTE first displays a shoulder at K due to the incommensurate antiferromagnetic order, followed by a broadened jump at the structural transition. A discontinuity corresponding to the latter transition is nicely resolved in at K, Fig. 5(b). The LTE curve very much resembles the one for upon cooling in Fig. 2(e). For increasing temperature, displays a large thermal hysteresis and a sharp increase at K due to the structural transition. However, the transition corresponding to the magnetic ordering in the warming cycle occurs at around 57 K, i.e. at a significantly lower temperature than the corresponding transition in the cooling cycle. This kind of reverse hysteresis is rather unusual for a continuous phase transition (see discussion below).
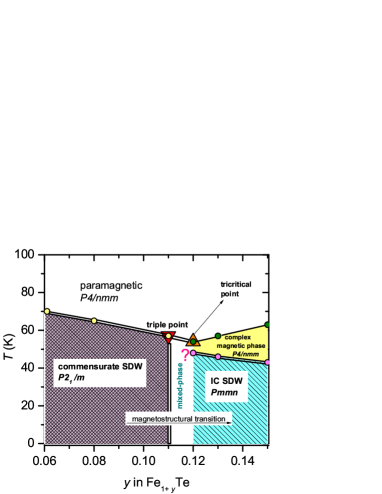
Combining our results with those from neutron scattering experiments PhysRevLett.102.247001 ; rodriguez2011magnetic allows a detailed interpretation of the magnetic and structural transitions in Fe1+yTe. For low Fe concentrations

within the range , the structural transition assigned to the monoclinic space group appears to take place simultaneously with magnetic ordering as a first-order magneto-elastic transition, as depicted in the schematic phase diagram Fig. 6. For Fe1.124Te, an incommensurate helix is found with a propagation vector r. l. u. where , which decreases to 0.4 with increasing temperature in an intermediate range 40 K K. rodriguez2011magnetic Within the same temperature range, this helicoid and an incommensurate SDW with different period are observed simultaneously. rodriguez2011magnetic This is assigned as a complex magnetic phase in Fig. 6. Symmetry considerations strongly restrict the possible phase transition mechanism for the formation of the helimagnetic state. The paramagnetic space group comprises only one-dimensional irreducible representations in the little group for propagation vectors . RevModPhys.40.359 ; tol dano1987landau Thus, a continuous transition from the paramagnetic into the helical state cannot take place as a mode instability according to standard Landau theory. DeGennes75 However, there are Lifshitz-type invariants that couple different irreducible representations and can (i) produce a helimagnetic state and (ii) give rise to the nucleation of kink-like modulations of the basic helical modulation on a mesoscopic length scale. Dz64 ; DeGennes75 ; tol dano1987landau ; Mukamel85 The existence of Lifshitz-invariants in helimagnets with strong phase-amplitude interaction causes unconventional magnetic ordering transitions UKR11 . Anisotropic magnetic couplings can cause continuous or discontinuous transitions. Mukamel85
The presence of such anisotropies in Fe1+yTe is suggested by the lock-in transition at and the marked magnetostructural transition in this composition range. Turner have proposed a model with localized Fe moment coupled to an orbital order, PhysRevB.80.224504 which could provide a microscopic mechanism for the magneto-elastic coupling that should vary with in Fe1+yTe. Thus, for a similar locking-in of the helix may occur owing to possible anisotropic couplings. But, this lock-in transition produces an incommensurate magnetic ordering. This can be understood phenomenologically, if the free energy of the structural order parameter contains dispersive couplings. tol dano1987landau Owing to the intrinsic disorder by the partially occupied Fe sublattice, strong pinning of the kink-like solitons, i.e. domain walls between regions with SDW and helical order, will occur. The very wide hysteresis in our LTE data is consistent with such a pinning. Thus, we explain our results in Fe1.13Te by a magnetostructural transformation of the helix in the tetragonal lattice state into a SDW with orthorhombic distortions subject to strong pinning. This is also in line with the observation of co-existing SDW and helicoidal order associated with different lattice structures in Fe1.124Te, which was detected by diffraction in neutron scattering experiments. rodriguez2011magnetic The transformation process can be pictured as a decomposition of the magnetic helix into an incoherent sequence of SDW sections with interspersed helicoidal kinks on a mesoscopic length scale.
Features of two successive phase transition have been earlier observed by Hu Hu2009 in Fe1.09Te and Fe1.14Te. However, they did not associate these transitions to individual magnetic and structural phase transitions. Instead, their results were explained based on the nesting properties of the Fermi surface: the higher level of excess Fe corresponds to larger size mismatch between cylindrical electron and hole Fermi surfaces. The two transitions may then represent successive SDW Fermi-surface nestings of separate electron-hole cylindrical pieces. However, neutron scattering studies PhysRevLett.102.247001 indicated that the Fermi surface nesting does not play a role in the magnetic ordering in Fe1+yTe. More recently, Zaliznyak Zaliznyak report data for Fe1.09Te which is very similar to those of our sample Fe1.13Te. From the neutron scattering studies on Fe1.1Te, Zaliznyak first find a structural distortion at = 63 K, followed by a magnetic ordering at = 57.5(5) K. At 45 K, a lock-in transition was observed at an incommensurate wave-vector (). The (201) lattice Bragg peak in their studies does not show a clear splitting down to 9 K. From their data,Zaliznyak it was not possible to distinguish between the monoclinic and the orthorhombic structures. Since no phase transition features were observed either in the susceptibility or in the specific heat at 63 K, the structural distortion at = 63 K was identified from the onset of broadening of (201) reflection. But, such a broadening may also be associated with a symmetry-preserving lattice striction caused by a strong magneto-elastic coupling close to . This distortion is followed by a change in the crystal symmetry at the first-order lock-in transition at 45 K, as observed in our high resolution diffraction data. Thus, we propose that the structural transition occurs simultaneously at a temperature where a change in the character of magnetic structure also takes place well within the magnetically ordered phase.
The symmetry changing structural phase-transition in the magnetically ordered phase is unusual in the parent compounds of Fe-superconductors. In the case of 1111 pnictides de2008magnetic ; PhysRevLett.101.077005 ; luo2009evidence ; Jesche2010 or partially Co substituted BaFe2As2 Chu2010 ; Pratt2009 and CaFe2As2,Chuang2010 where these two phase transitions occur separately, the structural transition always takes place at a higher temperature than . Within an effective Heisenberg-type local-moment (--) model, this splitting arises as a consequence of Ising-like magnetic couplings xu2008ising ; Fang2008 ; Qi2009 with a very weak interlayer interaction. In support of this theory, the temperature gap between and was experimentally found to increase with increasing distance between FeAs layers.luo2009evidence In the case of Fe1+yTe, however, the -lattice constant decreases with increasing . PhysRevLett.102.247001 ; Koz Yet the successive phase transitions occur for ; i.e., for the compositions with shorter -lattice constant. Thus, the microscopic mechanisms driving the phase transitions in Fe1+yTe seems to be fundamentally different from those in the case of Fe-arsenides.
IV conclusions
In conclusion, our thermodynamic, structural, and thermal
expansion data on Fe1.13Te give clear evidence for
magnetic ordering taking place at higher temperatures
than the structural phase transition. The structural
transition in turn coincides with a change in the nature of the magnetic structure.
This is exactly opposite to the behavior observed in the 1111-systems,
for which the magnetic transition occurs at lower
temperatures than the structural one. The exact nature
of the microscopic coupling mechanisms in Fe1+yTe needs
to be explored further as it appears to be key in
understanding the interplay between localized and itinerant
magnetism as well as superconductivity in Fe chalcogenides.
As the pairing mechanism in both cuprates and Fe-superconductors probably
involves spin fluctuations, understanding the nature of magnetic interactions is of utmost importance.
V Acknowledgements
We thank C. Geibel, Yu. Grin, Q. Si, F. Steglich, O. Stockert, P. Thalmeier, and L. H. Tjeng for stimulating discussions. This work is partially supported by DAAD - DST exchange program ID 50726385.
References
- (1) Y. Kamihara, T. Watanabe, M. Hirano, and H. Hosono, J. Am. Chem. Soc. 130, 3296 (2008).
- (2) C. Wang et al., Europhys. Lett. 83, 67006 (2008).
- (3) C. de La Cruz et al., Nature (London) 453, 899 (2008).
- (4) H.-H. Klauss et al., Phys. Rev. Lett. 101, 077005 (2008).
- (5) Y. Luo et al., Phys. Rev. B 80, 224511 (2009).
- (6) A. Jesche, C. Krellner, M. de Souza, M. Lang, and C. Geibel, Phys. Rev. B 81, 134525 (2010).
- (7) M. Rotter, M. Tegel, D. Johrendt, I. Schellenberg, W. Hermes, R. Pöttgen, Phys. Rev. B 78, 020503 (2008).
- (8) A. Jesche et al., Phys. Rev. B 78, 180504 (2008).
- (9) N. Ni, S. Nandi, A. Kreyssig, A. I. Goldman, E. D. Mun, S. L. Bud’ko, P. C. Canfield, Phys. Rev. B 78, 014523 (2008).
- (10) V. Barzykin and L. P. Gor’kov, Phys. Rev. B 79, 134510 (2009).
- (11) C. Fang, H. Yao, W. F. Tsai, J. P. Hu, and S. A. Kivelson, Phys. Rev. B 77, 224509 (2008).
- (12) C. Xu, M. Müller, and S. Sachdev, Phys. Rev. B 78, 020501 (2008).
- (13) A. M. Turner, F. Wang, and A. Vishwanath, Phys. Rev. B 80, 224504 (2009).
- (14) A. Cano, M. Civelli, I. Eremin, and I. Paul, Phys. Rev. B 82, 020408 (2010).
- (15) H. Okamoto and L. E. Tanner, J. Phase Equilib. 11, 371 (1990).
- (16) W. Bao et al., Phys. Rev. Lett. 102, 247001 (2009).
- (17) S. Li et al., Phys. Rev. B 79, 054503 (2009).
- (18) T. J. Liu et al., Nature Mater. 9, 718 (2010).
- (19) E. E. Rodriguez, C. Stock, P. Zajdel, K. L. Krycka, C. F. Majkrzak, P. Zavalij, M. A. Green, Phys. Rev. B 84, 064403 (2011).
- (20) S. Rößler, D. Cherian, and S. Harikrishnan, H. L. Bhat, S. Elizabeth, J. A. Mydosh, L. H. Tjeng, F. Steglich, S. Wirth, Phys. Rev. B 82, 144523 (2010).
- (21) C. Koz, U. Schwarz, Yu. Grin et al., to be published.
- (22) M. Rotter, H. Müller, E. Gratz, M. Doerr, and M. Loewenhaupt, Rev. Sci. Instrum. 69, 2742 (1998).
- (23) T. J. Liu et al., Phys. Rev. B 80, 174509 (2009).
- (24) H. Okada, H. Takahashi, Y. Mizuguchi, Y. Takano, and H. Takahashi, J. Phys. Soc. Jpn. 78, 083709 (2009).
- (25) C. J. Bradley and B. L. Davis, Rev. Mod. Phys. 40, 359 (1968).
- (26) J. C. Tolédano and P. Tolédano, The Landau theory of phase transitions (World Scientific, 1987).
- (27) P. G. de Gennes, Fluctuations Instabilities and Phase transitions, vol. 2 of NATO ASI Ser. B, ed. T. Riste (Plenum, New York, 1975).
- (28) I. E. Dzyaloshinskii, Sov. Phys. JETP 19, 960 (1964).
- (29) B. Schaub and D. Mukamel, Phys. Rev. B 32, 6385 (1985).
- (30) U. K. Rößler, A. A. Leonov, and A. N. Bogdanov, submitted to PRB (2011).
- (31) R. Hu, E. S. Bozin, J. B. Warren, and C. Petrovic, Phys. Rev. B 80, 214514 (2009).
- (32) I. A. Zaliznyak, Z. J. Xu, J. Wen, J. M. Tranquada, G. D. Gu, V. Solovyov, V. N. Glazkov, A. I. Zheludev, V. O. Garlea, and M. B. Stone, arXiv:1108.5968 (2011).
- (33) J. -H. Chu, J. G. Analytis, C. Kucharczyk, and I. R. Fisher, Phys. Rev. B 79, 014506 (2009).
- (34) D. K. Pratt, W. Tian, A. Kreyssig, J. L. Zarestky, S. Nandi, N. Ni, S. L. Bud’ko, P. C. Canfield, A. I. Goldman, and R. J. McQueeney, Phys. Rev. Lett. 103, 087001 (2009).
- (35) T. -M. Chuang, M. P. Allan, J. Lee, Y. Xie, N. Ni, S. L. Bud’ko, G. S. Boebinger, P. C. Canfield, and J. C. Davis, Science, 327, 181 (2010).
- (36) C. Fang, H. Yao, W. F. Tsai, J. P. Hu, and S. A. Kivelson Phys. Rev. B 77, 224509 (2008).
- (37) Y. Qi and C. Xu, Phys. Rev. B 80, 094402 (2009).