22email: ssc@tp4.rub.de 33institutetext: J. Becker Tjus 44institutetext: Ruhr-Universität Bochum, Fakultät für Physik & Astronomie, 44780 Bochum, Germany 55institutetext: F. Schuppan 66institutetext: Ruhr-Universität Bochum, Fakultät für Physik & Astronomie, 44780 Bochum, Germany
A possible GeV-radio correlation for starburst galaxies
Abstract
For star-forming regions, there is a correlation of radio and FIR-emission established. The radio emission is caused by synchrotron radiation of electrons, while the FIR emission is attributed to HII regions of OB stars and hot dust powered by those stars. Another possible correlation for star-forming regions might exist between the aforementioned radio emission and the gamma ray emission in the GeV regime. The GeV gamma ray emission of star-forming regions is dominated by the decay of neutral pions formed in collisions of cosmic ray (CR) protons accelerated at supernova remnants (SNRs) with ambient hydrogen, while the electrons generating the synchrotron emission are assumed to be accelerated at the same SNRs. Assuming the same spectral shape for the CR proton and electron distribution and a fixed ratio of CR protons to electrons, the proton- and electron-calorimetry of the star-forming regions can be tested. Furthermore, this provides a method to derive the magnetic field strength in the star-forming region complementary to the existing methods.
1 Introduction
A plot of the total gamma ray luminosity against the luminosity at 5 GHz for M82 and NGC 253 (both starburst galaxies), NGC 1068 and NGC 4945 (starburst- Seyfert composites) and 30 Doradus in the Large Magellanic Cloud and the Milky Way center reveals a trend, as Fig. 1 shows.
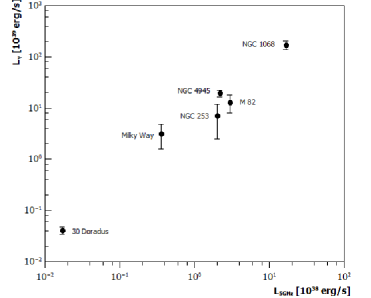
To interpret this possible correlation, a theoretical approach is followed: The emission of the objects dealt with is assumed to be dominated by SNRs inside the objects. The detected radio emission is attributed to synchrotron radiation of electrons accelerated at the SNRs, the GeV gamma rays are caused by the decay of neutral pions formed in collisions of protons accelerated at the SNRs with ambient protons:
| (1) | |||
| (2) |
Neutrinos are produced from charged pions, where searches are dominated by a background of atmospheric neutrinos so far Anatoli2012 . Both protons and electrons are probably accelerated at the same site, so it is assumed that their spectra have the same –or a very similar– shape, they only differ by a constant factor
| (3) |
To examine the trend in Fig. 1, both radiation processes are investigated in more detail in the following sections.
2 Electron synchrotron radiation Radio emission
The electron spectral energy distribution is assumed to be a simple power-law:
| (4) |
If each electron radiates all its energy at a single frequency , the emission coefficient can be written as:
| (5) | |||
| (6) |
using the expressions above, where is the elementary charge, is the gyrofrequency and is the Thomson cross-section. In order to obtain the radio luminosity of an object, the emission coefficient is multiplied by the average volume of an SNR and the number of SNRs, in the object:
| (7) | |||
| (8) |
By expressing the emission coefficient in terms of energy instead of frequency, the synchrotron flux can be written as:
| (9) |
where .
3 GeV gamma rays from pp-interaction
Following kelner_pp2006 , the differential proton flux in each object is derived from gamma ray observations under the assumption that these gamma rays are dominantly formed by pion decay from proton-proton interactions. The spectral shape of the primary proton flux is the same as that of the primary electrons (see eq. 1) and of the gamma rays from pion decay in the energy range of . The differential gamma ray luminosity is calculated as:
| (10) |
The calculation is done following kelner_pp2006 , where the -functional approach is used for energies below 100 GeV and the analytical approximation given there is used for higher energies.
4 Comparison and conclusions
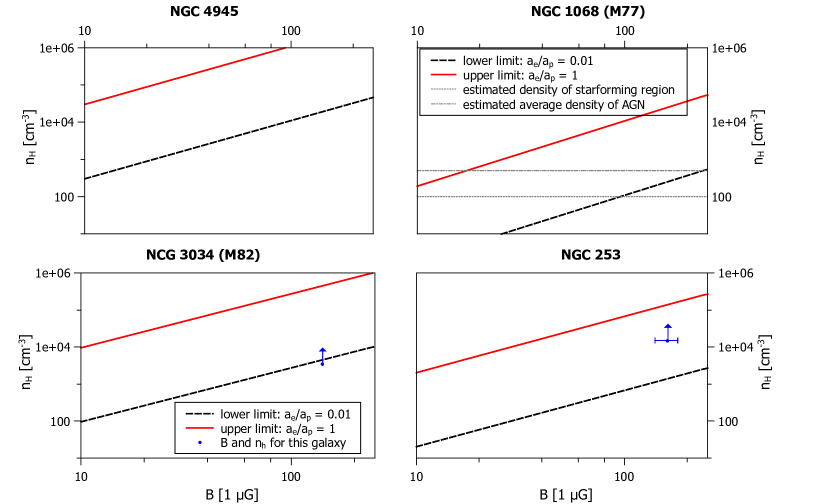
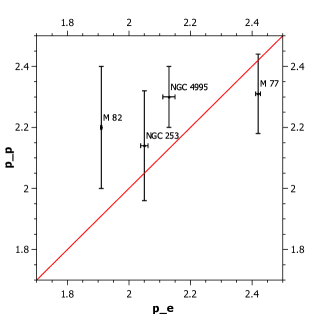
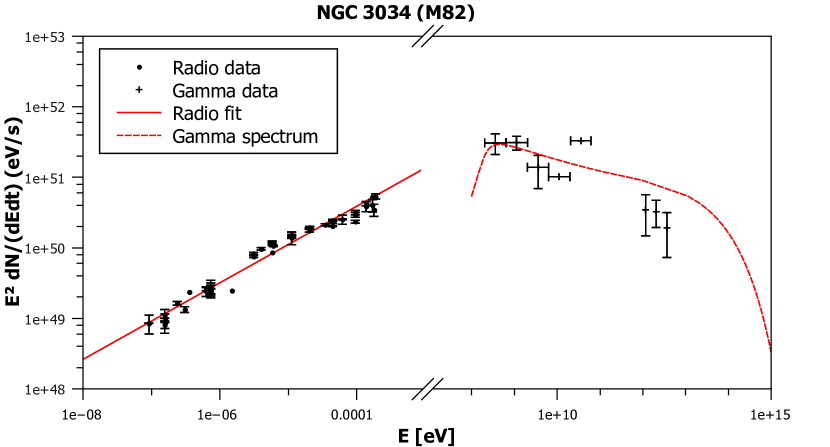
Combining the spectra as derived from protons and electrons, respectively, allows to model the SED for each object examined. In Fig. 4, this is shown for M82. The gamma ray luminosity and the spectral index for NGC 4945, 1068 and 3043 given by lenain2010 and for NGC 253 from HESS2012 are used to calculate . Using radio data, fits to the radio spectra are made to find the radio synchrotron index and the normalization of the primary electron spectrum, , for a magnetic field of G. From , the spectral index of the underlying primary electron spectrum is derived. The corresponding values of the calculation are given in Table 1, where cm-3 was assumed for the calculation of . The quantity depends on the magnetic field as , whereas depends on the average hydrogen density as . These expressions can be combined using the inequality in eq. (3). This allows to determine a possible range of combinations of the magnetic field strength and the average hydrogen density . This is done in Fig. 2. As can be seen, for each galaxy the observed values for the average hydrogen density and the magnetic field strength lie within the theoretically allowed range, which is the area between the lines corresponding to (dashed black line) and (solid red line). To test the assumption that the energy spectra of protons and electrons have the same shape, the electron and proton spectral indices of the individual galaxies have been calculated and are shown in Fig. 3.
| Source | = | ||||
|---|---|---|---|---|---|
| NGC 1068 | 1.45E+68 | 1.76E+69 | |||
| NGC 4945 | 6.16E+67 | 7.50E+66 | |||
| NGC 253 | 1.00E+66 | 1.77E+66 | |||
| NGC 3034 | 3.20E+66 | 9.60E+65 |
For a given average hydrogen density and an estimate of , this approach could be used to determine the magnetic field strength, complementary to the methods presented in thompson2006 and heesen2011 . For a given average hydrogen density, magnetic field strength and a fixed ratio for , this approach could be used to check whether the galaxy is calorimetric for both protons and electrons to the same extent. However, further improvement of the statistics is required to check the possible correlation of GeV gamma rays and radio emission from star-forming regions. Additionally, a more detailed theoretical examination has to be performed to establish this connection and gain new insights. The versatility of such a correlation strongly motivates further investigation in the future.
Acknowledgements.
We would like to thank B. Adebahr and R.J. Dettmar for helpful and inspiring discussions. We further acknowledge funding from the DFG, Forschergruppe ”Instabilities, Turbulence and Transport in Cosmic Magnetic Fields” (FOR1048, Project BE 3714/5-1), the support from Mercator Stiftung, with a contributing grant within the MERCUR project An-2011-0075, from the Junges Kolleg (Nordrheinwestfälische Akademie der Wissenschaften und der Künste) and the support by the Research Department of Plasmas with Complex Interactions (Bochum).References
- (1) Abramowski, A. and others: ”Spectral analysis and interpretation of the -ray emission from the Starburst galaxy NGC 253”, arXiv: 1205.5485; submitted to Astroph. Journal (2012)
- (2) Fedynitch, A., Becker Tjus, J. and Desidiati, P.: ”Influence of hadronic interaction models and the cosmic ray spectrum on the high energy atmospheric muon and neutrino flux”, arXiv:1206.6710; submitted to Phys. Rev. D. (2012)
- (3) Heesen, V. and others: ”Cosmic rays and the magnetic field in the nearby starburst galaxy NGC 253 III. Helical magnetic fields in the nuclear outflow”, Astron. & Astroph. 535, A79 (2011)
- (4) Kelner, S. R., Aharonian, F. A. and Bugayov, V. V.: ”Energy spectra of gamma rays, electrons, and neutrinos produced at proton-proton interactions in the very high energy regime”, Phys. Rev. D. 74:3 (2006)
- (5) Lenain, J.-P. and others: ”Seyfert 2 galaxies in the GeV band: jets and starburst”, Astron. & Astroph. 524, A72 (2010)
- (6) Matsushita, S. and others: ”Dense and Warm Molecular Gas and Warm Dust in Nearby Galaxies”, Publ. of the Astron. Society of Japan 62, 409 (2010)
- (7) Spinoglio, L. and others: ”The Far-Infrared Emission Line and Continuum Spectrum of the Seyfert Galaxy NGC 1068”, Astroph. Journal 623, 123 (2005)
- (8) Thompson, T. A. and others: ”Magnetic Fields in Starburst Galaxies and the Origin of the FIR-Radio Correlation”, Astroph. Journal 645, 186 (2006)