Herschel limits on far-infrared emission from circumstellar dust around three nearby Type Ia supernovae
Abstract
We report upper limits on dust emission at far-infrared (IR) wavelengths from three nearby Type Ia supernovae: SNe 2011by, 2011fe and 2012cg. Observations were carried out at m and m with the Photodetector Array Camera and Spectrometer (PACS) on board the Herschel Space Observatory. None of the supernovae were detected in the far-IR, allowing us to place upper limits on the amount of pre-existing dust in the circumstellar environment. Due to its proximity, SN 2011fe provides the tightest constraints, at a -level for dust temperatures assuming silicate or graphite dust grains of size m. For SNe 2011by and 2012cg the corresponding upper limits are less stringent, with for the same assumptions.
keywords:
circumstellar matter – supernovae: general – supernovae: individual: SN 2011by – supernovae: individual: SN 2011fe – supernovae: individual: SN 2012cg – dust, extinction.1 Introduction
The use of Type Ia supernovae (SNe Ia) as distance indicators remains essential for the study of the expansion history of the Universe and for explorations of the nature of dark energy (Goobar & Leibundgut, 2011). However, a lack of understanding of the progenitor systems and the requirement for empirically derived colour-brightness corrections represent severe limitations for precision cosmology. Information about the progenitor systems of SNe Ia can be obtained by searching for evidence of circumstellar material (CSM) associated with mass-loss prior to the explosion. In the single-degenerate model, a white dwarf (WD) accretes mass from its hydrogen-rich companion star until it reaches a mass close to the Chandrasekhar mass, at which point carbon ignites, triggering a thermonuclear explosion. In the double-degenerate model, a supernova results from the merger of two WDs. Thus, the detection of CSM arising from the transfer of matter to the WD by its non-degenerate binary companion would be a direct confirmation of the single-degenerate scenario. Dust may also be created in the circumstellar environment before the explosion, which would have important implications for observed colours of SNe Ia. This second scenario is the focus of this paper. The existence of CSM around nearby SNe Ia has been suggested by studies of sodium absorption lines (e.g. SNe 1999cl, 2006X and 2007le, Patat et al., 2007; Blondin et al., 2009; Simon et al., 2009; Sternberg et al., 2011). High-resolution spectra reveal the presence of time-variable and blueshifted Na I D features, possibly originating from CSM within the progenitor system. Studies of large samples of SNe Ia (Sternberg et al., 2011) find that half of all SNe Ia with detectable Na I D absorption at the host-galaxy redshift have Na I D line profiles with significant blueshifted absorption relative to the strongest absorption component, which indicates that a large fraction of SN Ia progenitor systems have strong outflows. Foley et al. (2012) also find that SNe Ia with blueshifted circumstellar/interstellar absorption systematically exhibit higher ejecta velocities and redder colours at maximum brightness relative to the rest of the SN Ia population.
Non-standard reddening has been noted in studies of individual and large samples of SNe Ia. For example, the colour excess indices of SN 2006X were studied in Folatelli et al. (2010), showing that the reddening is incompatible with the average extinction law of the Milky Way. Their findings augmented the large body of evidence indicating that the reddening of many SNe Ia show a steeper wavelength dependence () than that which is typically observed for stars in our Galaxy. Previously, Nobili & Goobar (2008) derived from a statistical study of 80 low redshift SNe Ia. Similarly, when the colour-brightness relation is fitted jointly with cosmological parameters in the SNe Ia Hubble diagram, using a wide range of SNe Ia redshifts, low values of are obtained (see e.g. Suzuki et al., 2012, for a recent compilation).
Wang (2005) and Goobar (2008) showed that multiple scattering on circumstellar (CS) dust could potentially help to explain the low values of observed in the sight lines of nearby SNe Ia. Amanullah & Goobar (2011) simulated the impact of thin CS dust shells located at radii () from the SN, containing masses , and find that this scenario would also perturb the optical lightcurve shapes and introduce “intrinsic” colour variations .
Thermal emission at IR wavelengths could be the “smoking gun” for the presence of CS dust. Pre-existing CS dust may be radiatively heated by absorption of UV/optical photons from the SN or collisionally heated by the SN shock. New dust grains could also be formed in SN Ia ejecta. Nozawa et al. (2011) model this process, and find that up to 0.2 of dust could condense days after the explosion.
Gerardy et al. (2007) observed two normal SNe Ia (SNe 2003hv and 2005df) at late phases ( days after explosion) with the Spitzer Space Telescope in the m wavelength range. The mid-IR spectral energy distributions (SEDs) and photometry are compatible with strong atomic line emission from the SN, and therefore exhibit no compelling indication of pre-existing or newly formed dust. Nozawa et al. (2011) compare their models with the Gerardy et al. (2007) photometry and derive an upper limit of of newly formed silicate dust. Furthermore, Gomez et al. (2012) studied the Kepler and Tycho supernova remnants (thought to be remnants of SNe Ia that exploded years ago) using observations in the m range and reported the detection of of warm dust (90 K). Their findings are consistent with the warm dust originating in the circumstellar (Kepler) and interstellar (Tycho) material swept up by the primary blast wave of the remnant.
In this paper, we present the earliest far-IR measurements of SNe Ia, within 45 days after explosion, using the Herschel Space Observatory (Pilbratt et al., 2010) from 70-160 m. We also derive limits on pre-existing dust in the CS environment of the three observed SNe.
2 Targets and Observations
Thermal emission from heated pre-existing CS dust would be difficult to detect in the near-IR, except for large masses and high temperatures, but could be detected at mid-IR wavelengths, e.g. with Spitzer. However, the degeneracy with the photospheric emission around m makes it challenging to discriminate between emission by dust and intrinsic light from the SN. Conversely, observations at longer wavelengths (beyond m) would be dominated by radiating dust, which motivates the use of Herschel observations for this study. 111At the time our targets were observed, only the Spitzer and m bands were operational.
To investigate the presence of CS dust shells, the observations were carried out within 45 days from the SN explosion in order to minimise the risk of confusion with any newly formed dust produced in the SN ejecta (as seen in core-collapse SNe; Kotak et al., 2009).
Another factor is the duration of the IR echo, which is expected to scale with the radius of the CS dust shell, . For a geometrically thin, spherically symmetric shell, the fraction of emitting dust mass perceived by the observer increases with time, reaching maximum at .
For shell radii, , the IR echo would be too short to be captured by our observations. However, in such a scenario, the CS dust would have been heated to high enough temperatures for its near-IR emission to dramatically change the early part of the observed lightcurves. For dust at radii , the IR echo ( months) is partially within our observing window. Thus, although our observational strategy may miss the IR echo maximum, it nonetheless represents a reasonable compromise for exploring possible pre-existing CS dust shells.
In this study we targeted three Type Ia SNe: SNe 2011by, 2011fe and 2012cg, selected based on their close proximity. Only one of these three SNe showed significant reddening at optical wavelengths (SN 2012cg), thus making a detection at far-IR wavelengths more challenging for the remaining two.
2.1 Herschel PACS data
The observations of SNe 2011by, 2011fe and 2012cg were obtained using the Photodetector Array Camera and Spectrometer (PACS; Poglitsch et al., 2010) on board Herschel. The mini scan-map observing mode was used with a scan speed of /s, resulting in a final map of with a homogeneous coverage in the central region (about in diameter). The full width at half maximum (FWHM) of the point spread function (PSF) at m and m are and respectively. The flux calibration uncertainty for the PACS and m bands are currently estimated to be smaller than 5% 222PACS Observer’s Manual, Section 3.3.. The colour corrections to the modeled dust emission spectra for the PACS and m bands are negligible (maximally %).
The data reduction was performed up to level2 using the Herschel Interactive Processing Environment (HIPE; Ott, 2010). Each target was observed for 4 hours, with simultaneous imaging in the m and m bands resulting in unconfused point source flux limits of approximately 5 and 10 mJy respectively.
In addition to our observations we also include analysis of archival data of the host galaxies of SNe 2011fe (M101 observed as part of the KINGFISH survey; Kennicutt et al., 2011) and 2012cg (NGC 4424 observed as part of the HeVICS survey; Davies et al., 2012). These observations were carried out in the large scan mode, with a medium scan map rate of /s resulting in maps with a /pixel resolution and an unconfused point source flux limit of approximately 25 mJy in the m band.
Photometry was performed by using a set of single apertures (with radii defined by the FWHM of the PSF) to estimate the far-IR flux at the SN positions; apertures were also used to determine the average sky background level on the map, and the background fluxes in the vicinity of the SN.
2.2 SN 2011by
SN 2011by was discovered 2011/04/26.823 by Zhangwei Jin and Xing Gao at R.A. = 11:55:45.56, Decl. = +55:19:33.8 at a location East and North of the center of the barred spiral galaxy NGC 3972 (, Tully et al., 2009). The SN reached a peak -band magnitude of on around May 9 with a colour excess of mag (Maguire et al., 2012).
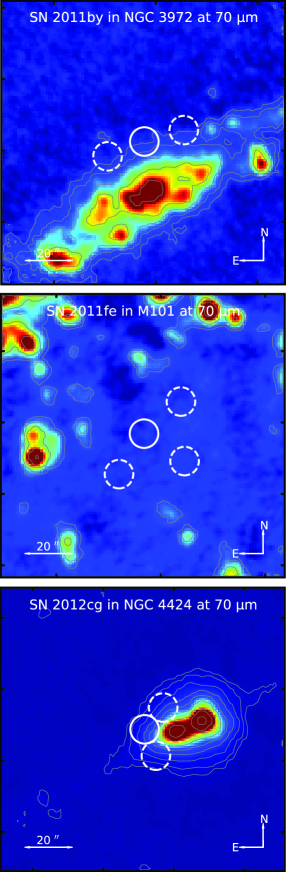
Our PACS m observations from 2011 May 24 (about two weeks after -band maximum) are shown in Fig. 1. The SN exploded in a region of significant host galaxy background emission. To derive upper limits on possible emission from pre-existing CS dust, we compare the flux at the SN position with the estimated host galaxy background flux in the vicinity (Tab. 1). The galactic emission was estimated by placing apertures along iso-flux contours. We measure no significant excess far-IR emission ( at m) with respect to the estimated host galaxy background at the location of SN 2011by .
2.3 SN 2011fe
SN 2011fe was discovered 2011/08/24.000 by the Palomar Transient Factory at R.A. = 14:03:05.81, Decl. = +54:16:25.4 (J2000) at a location West and South of the center of the nearby spiral galaxy M101 (, Shappee & Stanek, 2011). The SN reached a peak -band magnitude of on around September 10 (Matheson et al., 2012). The Galactic and host galaxy reddening, deduced from the integrated equivalent widths of the Na I D lines are and mag, respectively (Patat et al., 2011).
By analysing pre-explosion HST and Spitzer images, Li et al. (2011) and Nugent et al. (2011) are able to rule out red-giants and a majority of helium stars as the mass donating companion to the exploding WD. Early phase radio and X-ray observations (Horesh et al., 2012; Chomiuk et al., 2012; Margutti et al., 2012) report non-detections, yielding constraints on the pre-explosion mass-loss rate from the progenitor system . Although they are model dependent, these limits rule out a large portion of the parameter space of single-degenerate progenitor models for SN 2011fe. The absence of time-variant, blueshifted absorption features also rules out the presence of substantial amounts of CSM (Patat et al., 2011). In summary, previous observations are consistent with the progenitor of SN 2011fe being a binary system with a main sequence or a degenerate companion star.
Our Herschel PACS m data from 2011 October 02 (about 33 days after -band maximum) are shown in Fig. 1. SN 2011fe is located in a region with low host galaxy background emission. No excess far-IR emission is detected at the position of SN 2011fe ( at m). We also analysed archival data to obtain the far-IR flux before the explosion (described in § 2.1, Tab. 1). The measured background subtracted flux at the SN position is . There is no significant far-IR source evident at the location of the SN before or after the explosion.
2.4 SN 2012cg
SN 2012cg was discovered 2012/05/15.790 by the Lick Observatory Supernova Search at R.A. = 12:27:12.83, Decl. = +09:25:13.2 (J2000) at a location East and South of the peculiar SBa galaxy NGC 4424 (, Cortés et al., 2008). SN 2012cg reached a peak -band magnitude of on 2012 June 2. The SN show signs of host galaxy reddening, with a colour excess of mag derived from both optical photometry and high-resolution spectroscopy (Silverman et al., 2012; Marion et al., 2012).
Our Herschel PACS m data from 2012 June 11 (about 9 days after -band maximum) are shown in Fig. 1. SN 2012cg is located in a region of significant host galaxy far-IR emission. We derive upper limits on possible emission from pre-existing CS dust (Tab. 1) in a similar manner to SN 2011by, by comparing the flux at the SN position with the host galaxy background flux in the vicinity. We measure no excess far-IR emission ( at m) with respect to the estimated host galaxy background at the location of SN 2012cg .
In addition, we also analyse pre-explosion archival PACS m data (described in § 2.1). The background subtracted flux at the SN location is . There is no significant far-IR source evident at the location of the SN before or after the explosion.
3 Upper limits from dust models
To model the far-IR emission from pre-existing CS dust we consider the idealized case (described in Hildebrand, 1983; Fox et al., 2010) of an optically thin dust cloud of mass with dust particles of radius , emitting thermally at a single equilibrium temperature . The expected flux at a distance is,
| (1) |
where is the Planck blackbody function and the dust mass emissivity coefficient, , is
| (2) |
is the absorption efficiency and the dust bulk (volume) density, depending on grain composition. The expected emission depends on the choice of dust grain composition and size. Interstellar dust is well described by a mixture of silicate and graphitic grains of different sizes, and generally in the far-IR with and at m (Draine & Li, 2001). However, CS dust around SNe may well be dominated by either silicate or graphitic grains depending on the stellar atmosphere of the involved stars. Since we do not know the nature of the SNe Ia progenitor systems and their potential dust production mechanisms, we will consider separate scenarios of either silicate or graphite grains of radius m (described in Draine & Lee, 1984; Laor & Draine, 1993; Weingartner & Draine, 2001).
From the non-detections of the SNe in the PACS m and m passbands we calculate upper limits on the CS dust mass surrounding SNe 2011by, 2011fe and 2012cg.
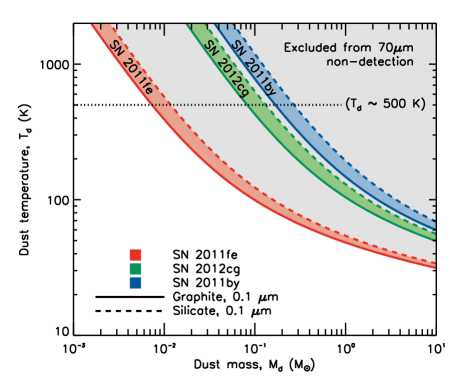
Fig. 2 shows the excluded dust mass range as a function of temperature for the three SNe, irrespective of heating mechanism. The upper limit on the dust temperature, set by the evaporation temperature of the dust grains (), corresponds to a minimal dust survival radius (Amanullah & Goobar, 2011). Detections of CSM around SNe Ia have been claimed at somewhat larger distances, (e.g. Patat et al., 2007). To derive an estimate of the expected temperature of CS dust at similar radii, , we follow the simple IR echo model in Fox et al. (2010) (see their Fig. 8b). For a typical peak SN bolometric luminosity of , radiatively heating a pre-existing dust shell of radius , graphitic dust grains of m will be heated to (silicate grains would be heated to even higher temperatures).
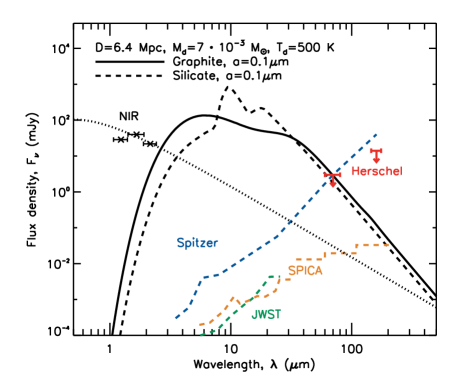
In what follows, we use as a point of reference (marked by the dotted line in Fig. 2). The expected dust SED for this specific temperature is shown in Fig. 3, along with the sensitivity of current and future mid- and far-IR facilities.
Due to its proximity, SN 2011fe yields the tightest constraints, at a -level, assuming graphitic dust grains of size m heated to temperatures (red solid line in Fig. 2). For silicate dust grains, the corresponding upper limit is M⊙ (red dashed line in Fig. 2). The upper limits for SN 2011by are weaker, at a -level for simliar assumptions (blue solid and dashed lines for graphitic and silicate dust grains in Fig. 2). For SN 2012cg, the upper limits are at a -level for assuming graphitic dust grains of size m heated to temperatures (green solid line in Fig. 2).
4 Summary and conclusions
Searches for evidence of CSM around SNe Ia are an important aspect in the efforts to understand the exact nature of these explosions and their use as accurate distance estimators. For the latter, the presence of pre-explosion CS dust could explain the empirically derived, non-standard reddening corrections that are applied to minimize the scatter in the SNe Ia Hubble diagram (Goobar, 2008).
In this work, we searched for far-IR emission from pre-existing CS dust around three nearby Type Ia SNe within a few weeks after maximum brightness. By considering the Herschel non-detections, we can exclude dust masses for dust temperatures at a -level for SN 2011fe, and the upper limits are one order of magnitude weaker for SNe 2011by and 2012cg, excluding dust masses .
Although these are the strictest upper limits on CS dust around newly exploded SNe Ia, our limits can not completely rule out the presence of CS dust as a contributing source to SN Ia reddening. Our sensitivity for CS dust masses ( to ) is about one-two order of magnitudes larger than the dust masses that have been suggested in simulations ( in Amanullah & Goobar, 2011).
While current instrumentation allows mainly for exploration of CS dust around SNe within the very local universe (), future missions such as JWST and SPICA, will have the potential to dramatically improve the sensitivity, as shown in Fig. 3.
The authors are grateful to the anonymous referee for useful comments that have significantly improved the paper. We also thank Hugh Dickinson, Ori Fox and Edvard Mörtsell for useful discussions and comments. RA would like to thank the Swedish National Space Board for financial support. AG acknowledges support from the Swedish National Research Council.
References
- Amanullah & Goobar (2011) Amanullah R., Goobar A., 2011, ApJ, 735, 20
- Blondin et al. (2009) Blondin S., Prieto J. L., Patat F., Challis P., Hicken M., Kirshner R. P., Matheson T., Modjaz M., 2009, ApJ, 693, 207
- Chomiuk et al. (2012) Chomiuk L. et al., 2012, ApJ, 750, 164
- Cortés et al. (2008) Cortés J. R., Kenney J. D. P., Hardy E., 2008, ApJ, 683, 78
- Davies et al. (2012) Davies J. I. et al., 2012, MNRAS, 419, 3505
- Draine & Lee (1984) Draine B. T., Lee H. M., 1984, ApJ, 285, 89
- Draine & Li (2001) Draine B. T., Li A., 2001, ApJ, 551, 807
- Folatelli et al. (2010) Folatelli G. et al., 2010, AJ, 139, 120
- Foley et al. (2012) Foley R. J. et al., 2012, ApJ, 752, 101
- Fox et al. (2010) Fox O. D., Chevalier R. A., Dwek E., Skrutskie M. F., Sugerman B. E. K., Leisenring J. M., 2010, ApJ, 725, 1768
- Gerardy et al. (2007) Gerardy C. L. et al., 2007, ApJ, 661, 995
- Gomez et al. (2012) Gomez H. L. et al., 2012, MNRAS, 420, 3557
- Goobar (2008) Goobar A., 2008, ApJL, 686, L103
- Goobar & Leibundgut (2011) Goobar A., Leibundgut B., 2011, Annual Review of Nuclear and Particle Science, 61, 251
- Hildebrand (1983) Hildebrand R. H., 1983, qjras, 24, 267
- Horesh et al. (2012) Horesh A. et al., 2012, ApJ, 746, 21
- Kennicutt et al. (2011) Kennicutt R. C. et al., 2011, PASP, 123, 1347
- Kotak et al. (2009) Kotak R. et al., 2009, ApJ, 704, 306
- Laor & Draine (1993) Laor A., Draine B. T., 1993, ApJ, 402, 441
- Li et al. (2011) Li W. et al., 2011, Nature, 480, 348
- Maguire et al. (2012) Maguire K. et al., 2012, MNRAS, 426, 2359
- Margutti et al. (2012) Margutti R. et al., 2012, ApJ, 751, 134
- Marion et al. (2012) Marion G. H. et al., 2012, The Astronomer’s Telegram, 4159, 1
- Matheson et al. (2012) Matheson T. et al., 2012, ApJ, 754, 19
- Nobili & Goobar (2008) Nobili S., Goobar A., 2008, A&A, 487, 19
- Nozawa et al. (2011) Nozawa T., Maeda K., Kozasa T., Tanaka M., Nomoto K., Umeda H., 2011, ApJ, 736, 45
- Nugent et al. (2011) Nugent P. E. et al., 2011, Nature, 480, 344
- Ott (2010) Ott S., 2010, in Astronomical Society of the Pacific Conference Series, Vol. 434, Astronomical Data Analysis Software and Systems XIX, Mizumoto Y., Morita K.-I., Ohishi M., eds., p. 139
- Patat et al. (2007) Patat F. et al., 2007, Science, 317, 924
- Patat et al. (2011) Patat F. et al., 2011, arXiv:1112.0247
- Pilbratt et al. (2010) Pilbratt G. L. et al., 2010, A&A, 518, L1
- Poglitsch et al. (2010) Poglitsch A. et al., 2010, A&A, 518, L2
- Shappee & Stanek (2011) Shappee B. J., Stanek K. Z., 2011, ApJ, 733, 124
- Silverman et al. (2012) Silverman J. M. et al., 2012, ApJL, 756, L7
- Simon et al. (2009) Simon J. D. et al., 2009, ApJ, 702, 1157
- Sternberg et al. (2011) Sternberg A. et al., 2011, Science, 333, 856
- Suzuki et al. (2012) Suzuki N. et al., 2012, ApJ, 746, 85
- Tully et al. (2009) Tully R. B., Rizzi L., Shaya E. J., Courtois H. M., Makarov D. I., Jacobs B. A., 2009, AJ, 138, 323
- Wang (2005) Wang L., 2005, ApJL, 635, L33
- Weingartner & Draine (2001) Weingartner J. C., Draine B. T., 2001, ApJ, 548, 296