email: {a.vilanova, r.f.p.v.pelt}@tue.nl,
2 Institut für Simulation und Graphik, Otto-von-Guericke-Universität Magdeburg
email: bernhard.preim, rocco.gasteiger, mathias.neugebauer@ovgu.de
3 Computer Science and Engineering, Wright State University
email: thomas.wischgoll@wright.edu,
Visual Exploration of Simulated and Measured Blood Flow
Abstract
Morphology of cardiovascular tissue is influenced by the unsteady behavior of the blood flow and vice versa. Therefore, the pathogenesis of several cardiovascular diseases is directly affected by the blood-flow dynamics. Understanding flow behavior is of vital importance to understand the cardiovascular system and potentially harbors a considerable value for both diagnosis and risk assessment. The analysis of hemodynamic characteristics involves qualitative and quantitative inspection of the blood-flow field. Visualization plays an important role in the qualitative exploration, as well as the definition of relevant quantitative measures and its validation. There are two main approaches to obtain information about the blood flow: simulation by computational fluid dynamics, and in-vivo measurements. Although research on blood flow simulation has been performed for decades, many open problems remain concerning accuracy and patient-specific solutions. Possibilities for real measurement of blood flow have recently increased considerably by new developments in magnetic resonance imaging which enable the acquisition of 3D quantitative measurements of blood-flow velocity fields. This chapter presents the visualization challenges for both simulation and real measurements of unsteady blood-flow fields.
Keywords:
Blood Flow, Phase-Contrast MRI, Flow Visualization, 3D Unsteady Flow, Computational Fluid Dynamics
1 Introduction
Cardiovascular disease (CVD) is a class of conditions affecting the heart and blood vessels, with an estimated overall prevalence of over thirty percent of the American population AmericanHeart:2010 , and is currently the leading cause of death worldwide WorldHealthOrganization:2011 .
Diagnosis of CVD typically involves an evaluation of both the anatomical structure and function, while the behavior of blood flow is still rarely inspected. The flow behavior is, nevertheless, of vital importance to the cardiovascular system. Morphology of cardiovascular tissue is significantly influenced by the unsteady behavior of flowing blood and vice versa. Therefore, blood flow analysis potentially harbors a considerable value for both diagnosis and risk assessment. A wide range of pre-clinical research indicates that flow behavior directly relates to medical conditions Gatehouse:2005 ; Morbiducci:2009 .
In particular, congenital heart diseases imply anomalous hemodynamics that strongly influence the progression and treatment of the innate defects. For the adult case, a noteworthy application is the aortic dissection, which is caused by a tear in the inner aortic wall. This allows blood to flow between the disintegrated layers of the vessel wall, resulting in a high risk of rupture. Again, the blood flow behavior plays a predominant role in the course of the condition. Decision support in case of cerebral aneurysms is one of the main applications of blood flow analysis. Blood flow is essential for the assessment of risk of rupture, urgency of treatment in case of multiple aneurysms, selection of treatment strategy (e.g., coiling/stenting, neurosurgical clipping).
The analysis of hemodynamic characteristics involves qualitative and quantitative inspection of the blood flow field. Physicians in clinical research investigate both the spatiotemporal flow behavior, as well as derived measures, such as the mean flux or cardiac output. The analysis of the blood flow data often requires complex mental reconstruction processes by the physician. Visualization plays an important role in the qualitative exploration, as well as the definition of relevant quantitative measures and its validation.
There are two main approaches to obtain information about the blood flow: simulations (i.e., computational fluid dynamics) and in-vivo measurements. Both of these methodologies can obtain information about the unsteady blood flow characteristics, where each has different advantages and disadvantages.
Although research on simulations of blood flow has been active for several decades, still a lot of open problems remain concerning accuracy and patient-specific solutions. Recently, research around measurement of blood flow has increased considerably. Developments in magnetic resonance imaging (MRI) have made the acquisition of 3D quantitative measurements of blood flow velocities fields possible. Furthermore, several vendors have made essential postprocessing software to inspect the data clinically available. Therefore, clinical pilot studies have been possible and have shown the relevance and potential of this data. Furthermore, the MRI acquisition development towards 7 and 9 Tesla machines have the potential to provide the required resolution and signal-to-noise ratios (SNR) to analyze blood flow in smaller vessels compared to the main arteries around the heart.
In this chapter, we will consider the visualization challenges for both simulations and in-vivo measurements of unsteady flow fields. We will present a review of the existing literature, the main challenges related to blood flow visualization and analysis, as well as the open issues.
2 Blood Flow Simulation
One way of determining blood flow within a vascular system is through simulation. This approach involves two major steps. First, the vascular structure needs to be segmented, and the geometry of the vessel boundary determined as accurately as possible. Next, a Computational Fluid Dynamics (CFD) model simulates the blood flow within the reconstructed geometry. The next sections will discuss these steps in more detail.
2.1 Grid Generation
In order to simulate blood flow with CFD, the boundary conditions of the underlying mathematical model have to be defined properly. In case of vascular flow, the boundary conditions are defined by two different components: the first one is the the geometric boundary of the vessels; the second one consists of the inflow and outflow characteristics as defined by the circulatory system.
There are different ways of identifying the vessel boundary. Typically, some imaging technique is used to generate a scan of the vascular structure for which the flow is supposed to be simulated, for example a Computed Tomography (CT) scan. In order to extract the vascular structure from such a volumetric image, the data needs to be segmented. Simple thresholding based on the intensity value can be used. However, this may not be sufficient for anatomical structures where significant perfusion and noise occurs, such as the heart. More sophisticated segmentation techniques are necessary, for example, gradient-based thresholding techniques tend to produce better results in those cases.
The segmentation process also has great influence on the overall accuracy of the simulation. Basic intensity thresholding techniques, for example, determine individual voxel locations as being part of the vessel boundary. However, it is unlikely that the vessel boundary is located precisely at such a voxel location, especially given that the volumetric data set only imposes an artificial grid on the organ at hand. Therefore, the accuracy can be improved by using segmentation techniques that operate at a sub-voxel level, e.g., Marching Cubes algorithm Lorensen:1987 .
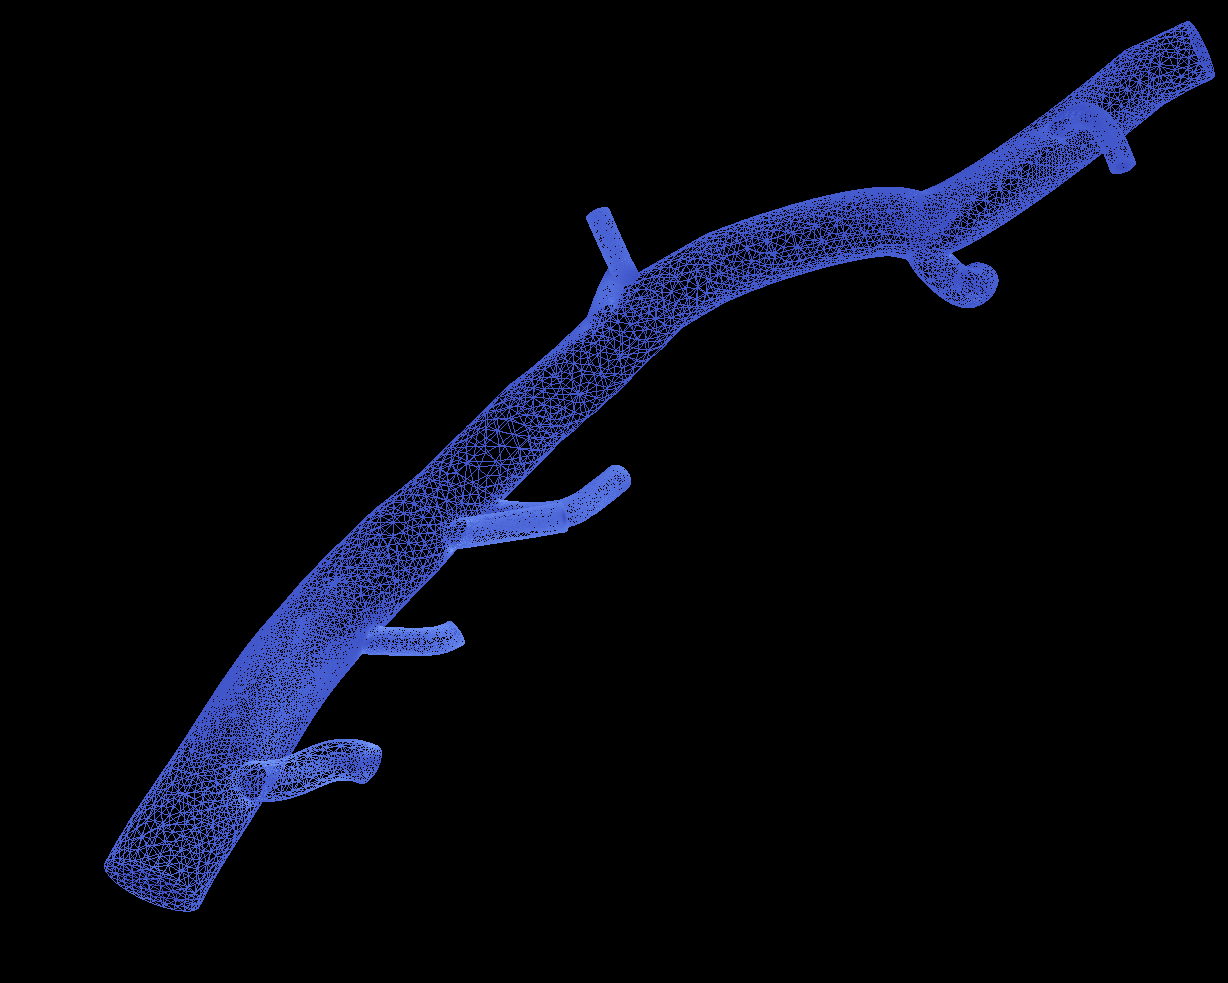
The downside of the Marching Cubes algorithm, however, is that it only operates with a fixed intensity threshold across the entire data set. Since typically a point spread function with a radius greater than one has to be assumed for most imaging techniques, this may cause errors in the boundary geometry, overestimating larger vessels and underestimating smaller vessels. Gradient-based approaches can achieve better results in these cases identifying the location where the maximal gradient value is assumed to find a more accurate estimate for the exact location of the vessel boundary Wischgoll:2008 . The geometric model resulting from the segmentation step can then be further refined, for example by using smoothing or rounding off the transitions at vessel bifurcations Oeltze:2005 , resulting in a vessel boundary that can be used for a CFD simulation. Figure 1(a) shows an example of such a vessel boundary generated based on a CT scan using gradient-based thresholding with sub-voxel precision.
2.2 Computational Fluid Dynamics Model
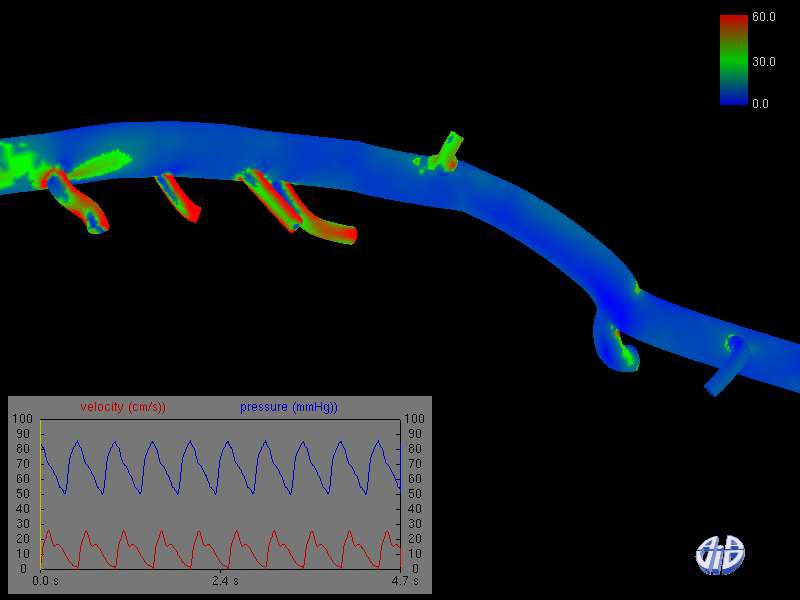
In addition to the geometric boundary of the vascular structure inflow, outflow, and wall boundary conditions have to be defined properly for the CFD simulation Cebral2005 ; Venugopal2007 . Inflow and outflow conditions arise from the fact that the current vascular structure has to be isolated from the rest of the arterial system. In practice, the flow rate or the speed profile at the inlets and the pressure at the outlets are utilized for a cardiac cycle. These quantities are obtained based on experimental measurements or by time-resolved Phase-contrast MRI flow measuring from the patient (see subsequent section). boundary condition arises from the fact that the vessel wall is distensible, which may influence the local hemodynamic and vice versa Torii2009 . However, typically no proper characterization of the arterial wall, such as modulus of elasticity, wall thickness, or pressure wave that form at the wall, is available or is difficult to measure noninvasively Cebral2005 . Thus, a rigid wall is assumed in most cases, which also decreases the numerical computation time. With all boundary conditions defined, the flow can be computed based on the 3D unsteady Navier-Stokes equations for an incompressible Newtonian fluid. Typically, common CFD solvers are used for this step, for example ANSYS Fluent or OpenFOAM. The resulting velocity and pressure of the blood flow can subsequently be used for further analysis. For example, the computation of the dimensionless Reynolds number Cebral2009 . The Reynolds (Re) number characterizes the local flow behaviour in terms of laminar (Re ) or turbulent (Re ). In addition to velocity and pressure values, other hemodynamic quantities are obtained during the simulation. An important quantity is the wall shear stress (WSS), which represents the tangential force produced by blood moving across the vessel surface. It is known that WSS has an influence on the tissue structure of the vessel wall and it is likely that WSS plays an important role in initiation, growth and rupture of cerebral aneurysms Nixon2010 . The WSS can be computed based on the velocity field and the geometry Huo:2009 ; Cebral2009 . Figure 1(b) shows the result of such a CFD simulation using the inlet pressure and velocity based on a typical heart rate. This simulation is based on 124 time steps. For each time step, a grid size of 500,000 cells was used to accurately represent the vascular structure resulting in close to 900MB of data. CFD simulations give blood flow information at high resolution. However, CFD simulations are based on models with assumptions and simplifications which make it difficult to obtain patient-specific accurate results.
3 Blood Flow Measurement
3.1 Acquisition Methods
Measured blood flow information is mostly obtained by quantitative ultrasound (US) acquisition (see chapter 5). US is a cost-effective modality, providing flow information at high spatiotemporal resolution. However, US acquisition requires a skilled operator, is generally subject to a substantial amount of noise, and volumetric measurements of the vector velocity field are not possible. Consequently, this modality is less suitable for challenging cardiovascular conditions. Alternatively, computed tomography provides a limited number of blood flow acquisition sequences while delivering better signal-to-noise ratios. CT has the drawback of not measuring flow directly and exposing the patient to harmful radiation, which is impermissible for young patients. Instead, we focus on non-invasive Phase-Contrast (PC) MRI acquisition, which is the only modality providing volumetric quantitative measurements of blood flow velocities throughout the cardiac cycle. A typical size of such a volumetric data is voxels with velocity vectors with a resolution of mm per voxel, and a time series of 20 to 25 steps per cardiac cycle.
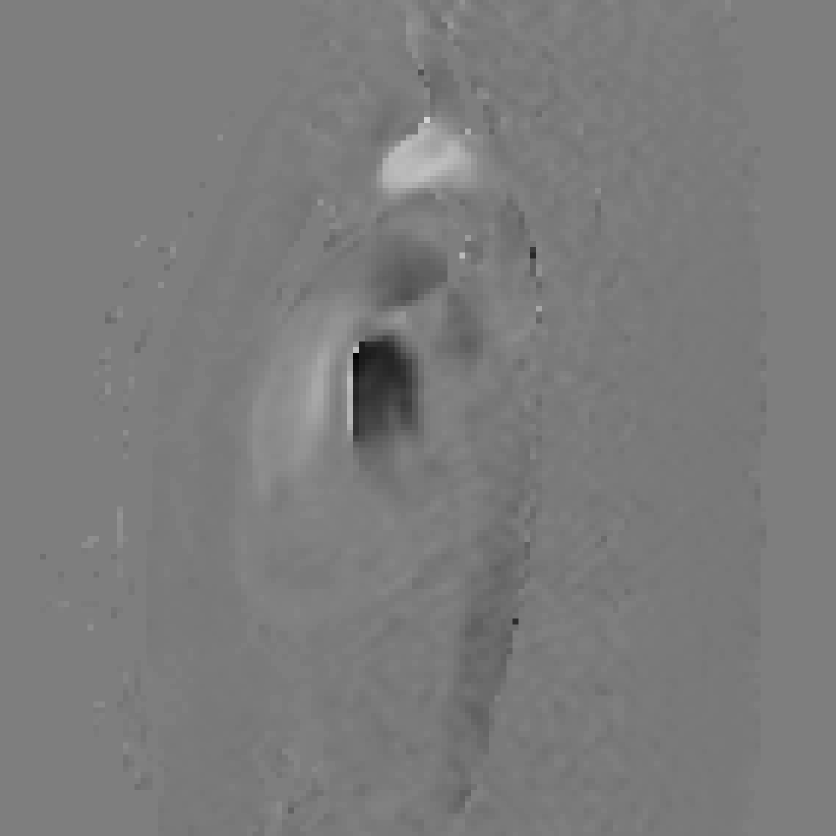
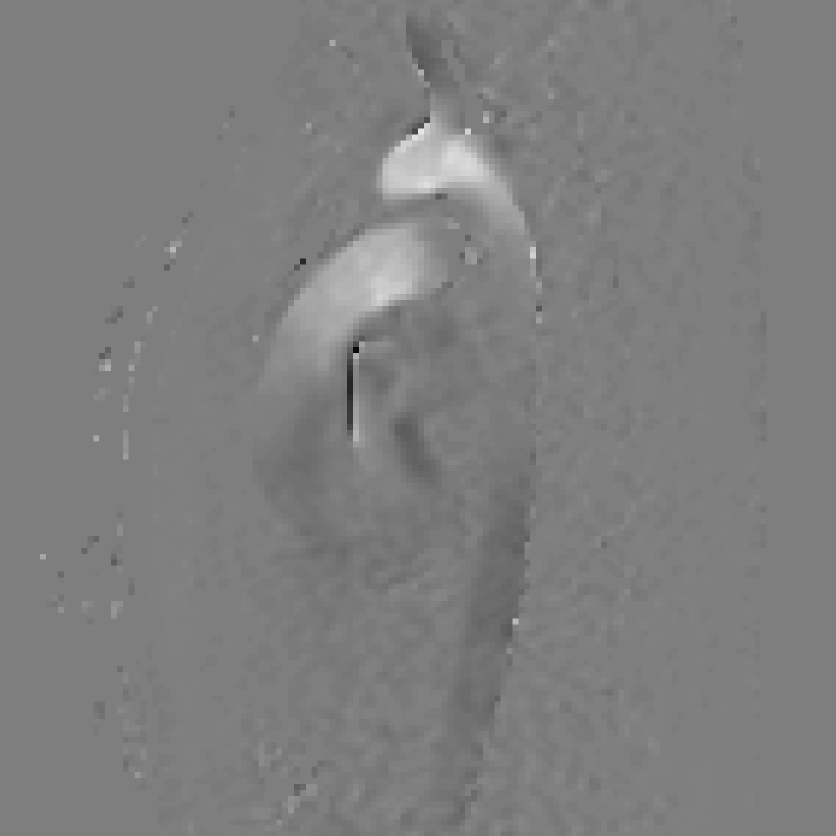
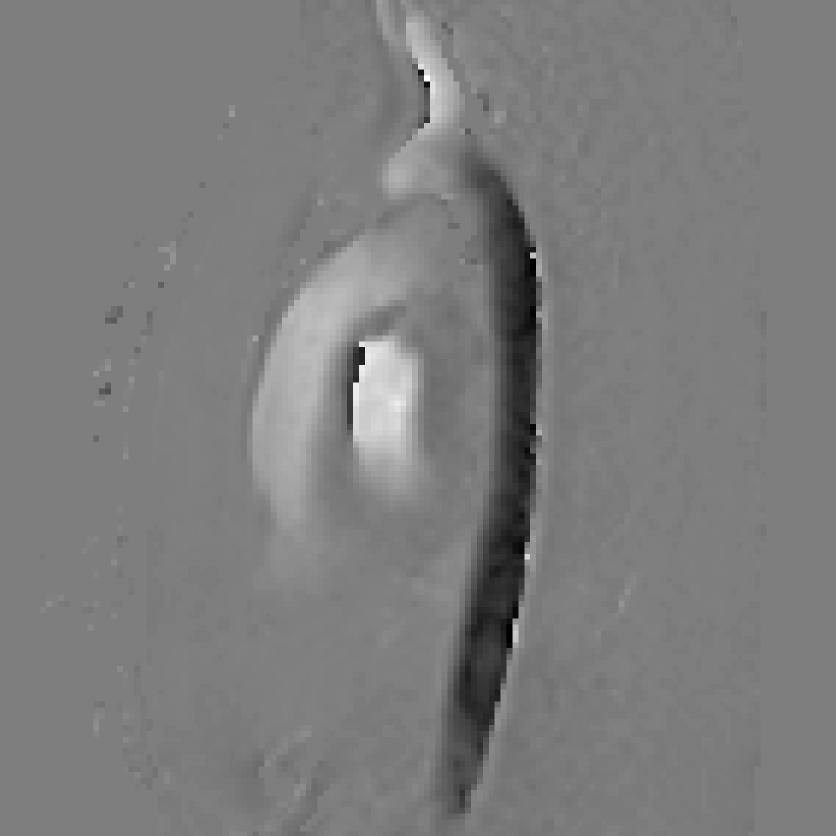
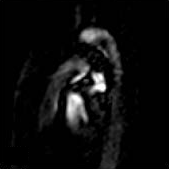
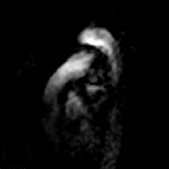
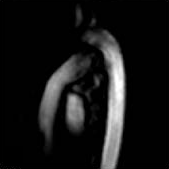
Phase-contrast MRI sequences enable acquisition of flow data that is linearly related to the actual blood flow velocities, capturing both speed and direction. This linear relation is described by the velocity encoding (VENC) acquisition parameter, representing the largest speed that can be measured unambiguously and is typically defined in centimeters per second. The range of the imposed speed limit, for example (-100 cm/s, 100 cm/s], corresponds to the phase extremities, i.e., and radians. If a suitable VENC is chosen, PC-MRI provides a data set with great correspondence to the actual blood flow velocity field greil:2002 . As a consequence, the acquired data allows for quantitative analysis of the blood flow behavior. PC cine MRI sequences support the acquisition of volumetric blood flow data throughout the cardiac cycle, generating a 4D blood flow velocity field pelc:1991 ; markl:2003 . There are two customary approaches to reconstruct the acquired raw data to the desired flow images bernstein:1991 : phase (PC-P) and magnitude (PC-M) reconstruction. Figure 2 depicts a single slice of the reconstructed 4D flow data, at a certain point in time. The top row, Figures 2(a) - (c), represents the blood flow data in the three patient-oriented orthogonal directions, encoding both speed and directions of the blood flow quantitatively. This data is commonly referred to as the phase (PC-P) reconstruction. The bottom row, Figures 2 (d) - (f), represents the blood flow data in three directions, encoding only speed. This data is commonly referred to as the complex difference or magnitude (PC-M) reconstruction. Even though the blood flow direction cannot be resolved from the PC-M reconstruction, the resulting data is inherently less prone to the uncorrelated noise that is typical for the PC-P reconstructed data.
3.2 Noise and Artifacts
Measurements come with imperfections which complicate the meaningful quantitative analysis of the flow data. In particular, measures derived from the data are sensitive to relatively small errors in the flow measurements. Inaccuracies are caused by a combination of many factors, associated with the MRI hardware, imaging sequences and their parametrization, and patient movement. For sensitive cardiac applications, the generally accepted objective is to acquire flow data with less than 10% error Gatehouse:2010 .
The parametrization of the imaging sequence has a large influence on the accuracy of flow measurements. The parametrization directly influences the spatial and temporal resolution greil:2002 . In particular quantitative analysis of small vessels (e.g., in the brain) becomes cumbersome at low resolution arheden:2001 .
Besides user parametrization, motion is an important cause of imaging artifacts. There are three major causes of tissue displacement due to patient movement: motion artifacts by peristaltic motion, artifacts caused by contraction of the heart muscle, and respiration. Contraction of the heart muscle artifacts can be considerably reduced during acquisition. The impact of the respiratory motion can also be largely suppressed, by exploiting the relatively motionless period after exhalation.
In addition, flow measurements are subject to general MRI artifacts, largely due to hardware imperfections common in all MRI scans Bernstein:1998 . A relevant artifact for flow is due to the fast gradient switching which induces eddy currents in the electromagnetic field. This causes background phase errors in the image, which manifest as slowly varying image gradients in both the spatial and temporal domains. These effects are difficult to predict and therefore challenging to correct Gatehouse:2010 ; Rolf:2011 . The conventional MRI noise follows a Rician distribution. For flow imaging, it can be shown that the noise in flow regions depends on the velocity encoding speed and is inversely proportional to the SNR of the corresponding magnitude image lotz:2005 . Hence, the VENC parameter should be chosen as small as possible, while capturing the full dynamic range of the actual flow. The decision about the VENC value is often not easy to make.
There are additional artifacts that are specific to flow data. For instance, aliasing, or phase wrapping, erroneously introduces regions with opposite flow directions. Whenever the actual blood flow speed transcends the VENC value, a phase wrap occurs. Several methods have been devised to correct these artifacts caused by a single phase wrap through postprocessing yang:1996 ; langley:2009 . Another flow-specific artifact is misregistration where blood flow regions are shifted from the stationary tissue. This is due to the time between the phase encoding and frequency encoding gradients. These artifacts can be corrected by adding a bipolar gradient to each phase encoding gradient vlaardingerbroek:1999 .
The flow imaging sequences are based on the assumption that the blood flow velocities are constant at the time of measurement. Hence, measurements of accelerated flows are less accurate and can cause undesirable artifacts. Accelerated flows can be found in pulsatile flows, stenotic flows, or jets that can cause so-called flow voids at relatively low spatial resolutions. To verify whether this behavior has occurred, black blood scans are often employed to inspect the vessel delineation.
4 Visual Exploration
4.1 Visualization of the Anatomical Context
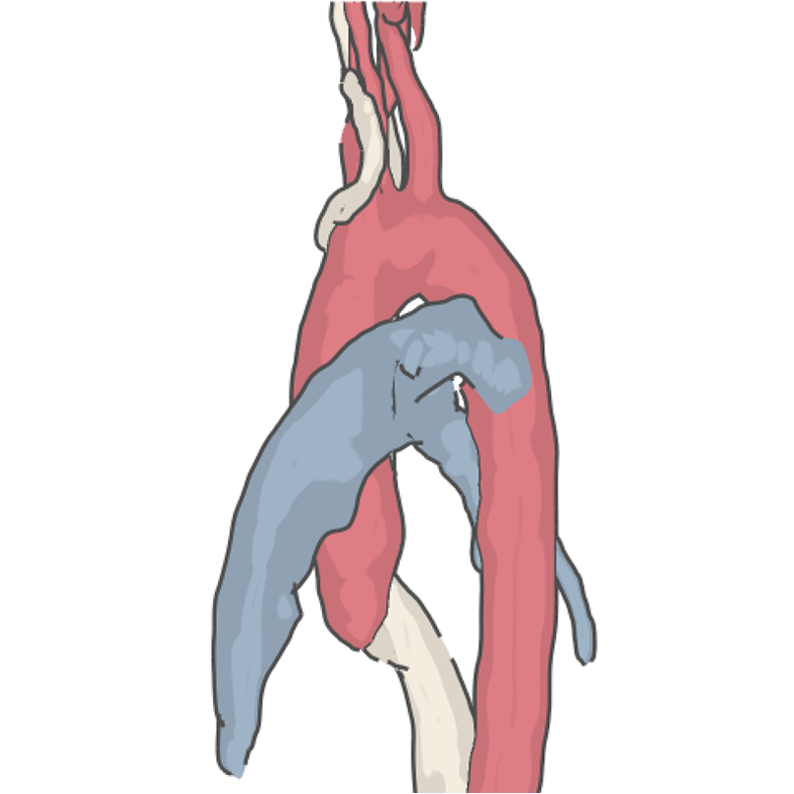
The visual exploration of blood flow data is usually focused on a rather small anatomical region. In case of simulated blood flow data, this represents the domain where the simulation was performed. It may be necessary to present this focus region embedded in a somehow larger context to better understand the location of a pathology and the in- and outflow regions. Such a visualization goal may be achieved with a coordinated focus-and-context view, where the detail view presents only the target region and the context view provides the big picture with additional anatomical context. An integrated focus-and-context view is mentally easier to interpret. A reasonable strategy is to employ distance-based transfer functions Tappenbeck_2006_SimVis , where the distance to the target anatomy is mapped to opacity in order to hide distant vascular structures. This strategy is illustrated in Figure 3. The specific choice of colours and opacity as well as the amount of information to be displayed requires careful discussions with physicians Neugebauer_2009_CARS . Such a visualization may be a first step in a pipeline of exploration and analysis, as it presents an overview and needs to be followed by a more local analysis.
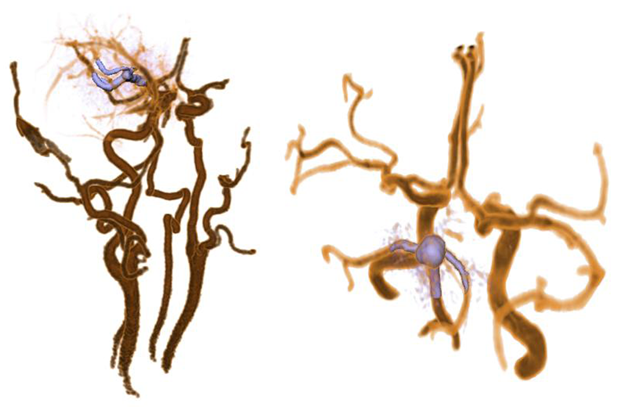
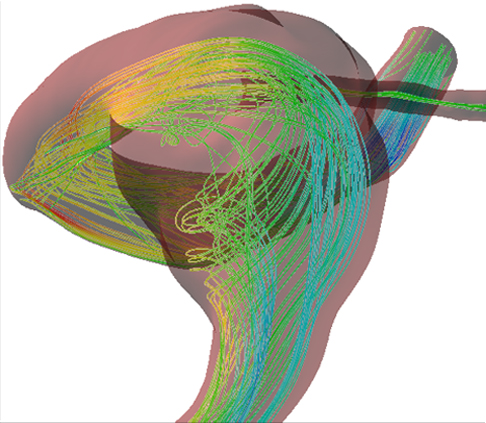
The flow strongly depends on local variations of the enclosing vascular structures. Large changes in flow speed occur at stenotic regions, and turbulent flow occurs primarily at bifurcations or strongly curved areas. Thus, it is important to investigate the morphology of anatomical structures and the internal flow simultaneously. In case of simulated flow, such an integrated analysis may reveal that a significant flow feature is due to a small variation of the surface, which may result from an inaccuracy in the segmentation. The simplest idea to display flow and vascular anatomy at the same time is to render the vascular surface transparently. However, depending on the transparency level, either the vascular anatomy is hardly recognizable, or the internal flow is strongly obscured by the vessel wall.
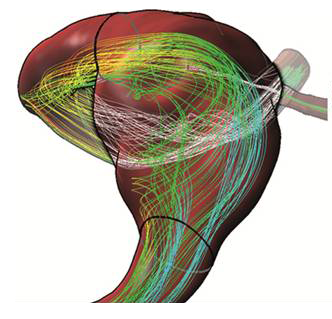
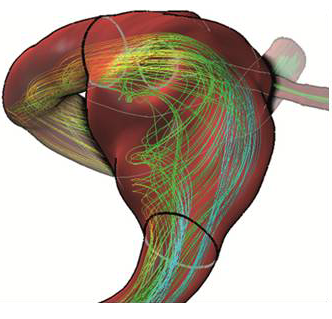
As a remedy, smart visibility techniques Viola:2005 , such as ghosted views, may be employed. The flow may be considered as an important object and the vessel walls transparency is modified to reveal flow lines. This idea has been realized by Gasteiger et al. Gasteiger_2010_VCBM . The specific solution to provide ghosted view visualizations is based on a Fresnel reflection model Schlick:1993 , where the reflection term is replaced by opacity. In Figure 4 a comparison of that technique with conventional semi-transparent rendering is presented. Gasteiger et al. refined their technique by an integration of landmarks described in the next section, and the ability to remove all hidden flow lines to further reduce visual clutter (see Figure 4).
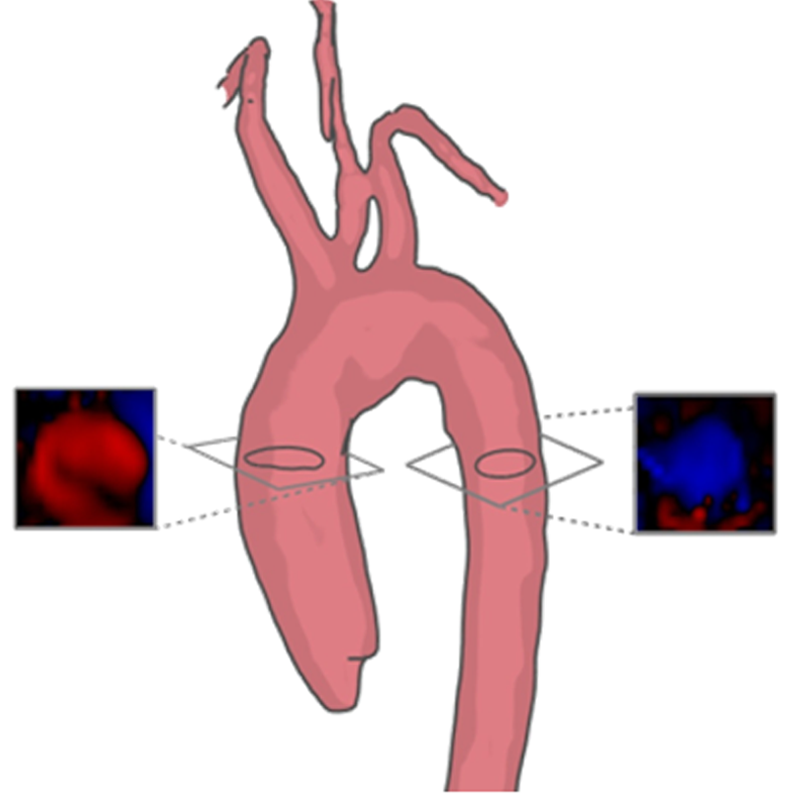
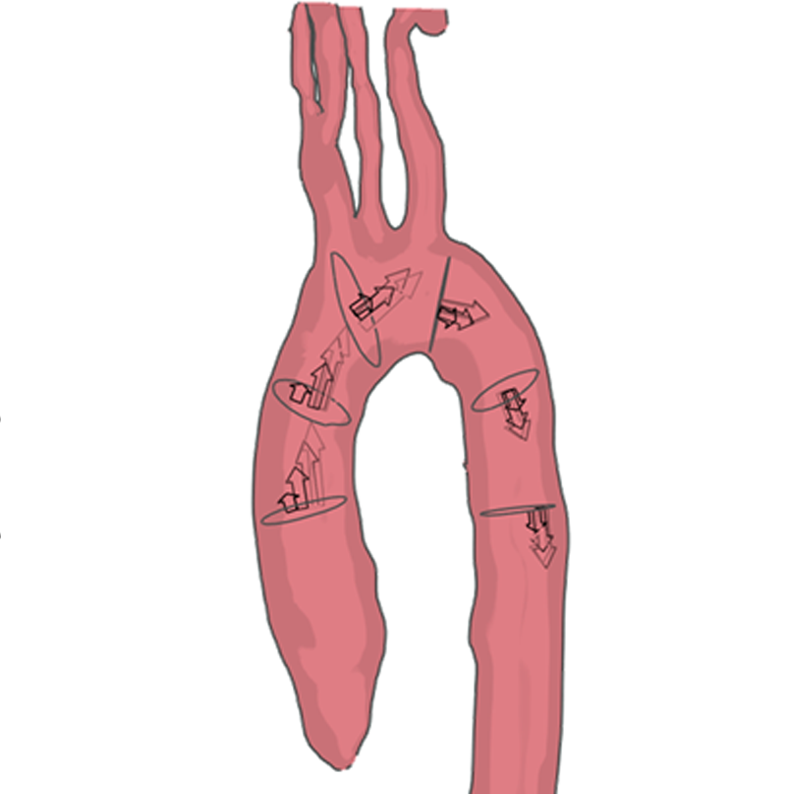
Van Pelt et al. Pelt:2010 presented an anatomical context based on methods inspired by medical illustrations, where the detail is removed while the morphological information is preserved(see Figure 5). To this end, they used cel-shaded silhouettes, combined with superimposed occluding contours. Hidden contours were visible during viewpoint interactions in order to resolve occlusion problems and to clarify spatial relations. Their user evaluation showed that these methods had a positive impact for the purpose of anatomical context representation of the flow.
4.2 Localization of Anatomical Landmarks
The exploration of vascular structures and the embedded flow benefits strongly from geometric descriptors that enable a carefully guided or constrained interaction. Such geometric descriptors may also be used to decompose the relevant anatomy in meaningful subregions to ease the exploration of complex flow data.
A widely used geometric descriptor is the vessel centerline, determined by a skeletonization algorithm (see, e.g., Kirbas:2004 ). The vessel centerline is often used in order to move a cross-sectional plane that is always aligned perpendicular to the centerline, presenting the maximum-sized area. In conventional vessel analysis packages, the cross-sectional view displays the intensity values from the original image data, e.g., the CT Hounsfield values. In case of blood flow data, this strategy may be used to present any scalar value derived from the flow or the flow data itself, e.g., by using some glyph mapping. Van Pelt et al. Pelt:2010 presented this cross-sectional visualization approach for the main arteries (see Figure 5).
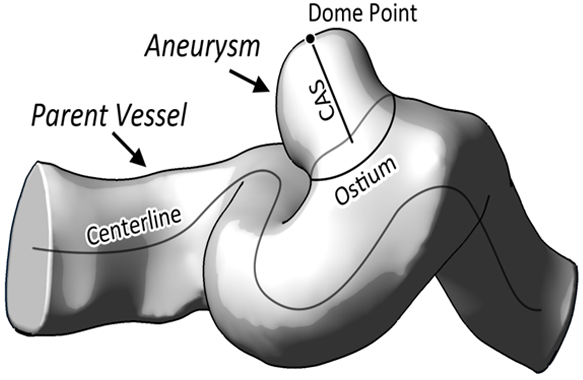
Better support for exploration tasks may be achieved by detecting and analyzing further anatomical landmarks of a particular region. Once these landmarks are identified, they may be used for labeling and for guiding movements in the complex 3D anatomy. The choice of such landmarks is specific for a particular anatomical region. We describe and illustrate this principle for the specific example of cerebral aneurysms. First, it is essential to understand which landmarks are actually important to characterize the local vessel anatomy. Neugebauer et al. Neugebauer_2010_VMV questioned a couple of neuroradiologists to draw cerebral aneurysms and extracted characteristic points commonly used by them. The following points were deemed essential (see Figure 6).
-
•
the dome point of an aneurysm,
-
•
the (curved) ostium plane, where the blood enters the aneurysm, and
-
•
a so-called central aneurysm axis (the closest connection between the parent vessel’s centerline and the dome point)
These landmarks may be utilized for example to move a plane along the central aneurysm axis or to employ the ostium plane as the seeding region, where streamline integration starts. The robust and precise detection is challenging due to the large variety of pathologic situations. Nevertheless even if it is successful only in about 90 percent of the cases, it provides a valuable support (see Neugebauer et al. Neugebauer_2010_VMV for a description of landmark extraction in saccular cerebral aneurysms). A similar landmark extraction process can be significant for other anatomical regions as well, since it provides a familiar reference frame for medical doctors. Constrained navigation does not necessarily mean that it is impossible to deviate from a predefined path. There are many variants to combine a preference direction with free exploration where the user is attracted to the predefined path, but may deviate. For a general discussion of constrained navigation techniques, see Hanson et al.Hanson:1997 and more recently Elmqvist and Tudoreanu Elmqvist:2008 .
4.3 Exploration of Surface Flow Scalar Features
Blood flow simulations result in flow data as well as scalar flow features, such as pressure, speed and wall shear stress (WSS). It is known that WSS plays an essential role in the understanding of initiation and progression of vascular diseases. A simple solution to display scalar flow features is to show the surface of the relevant vascular region with a color-coded scalar flow feature.
The disadvantage of this simple solution is that only a small portion of the surface is visible at the same time. Map projections, which unfold an anatomical structure onto a plane, allow the visualization of the whole scalar information simultaneously. However, a map exhibits distortions (not all spatial relations, such as distances or angles can be preserved) and, even worse, a simple map is very hard to relate to the complex 3D anatomy of pathologic vessels. One promising approach is to combine a faithful 3D anatomy representation and a map view, where interaction in both views are synchronized. It is inspired by map views in other areas of medical diagnosis, such as the Bull’s eye plot in cardiology and stretched curved planar reformations in vessel diagnosis Kanitsar:2002 .
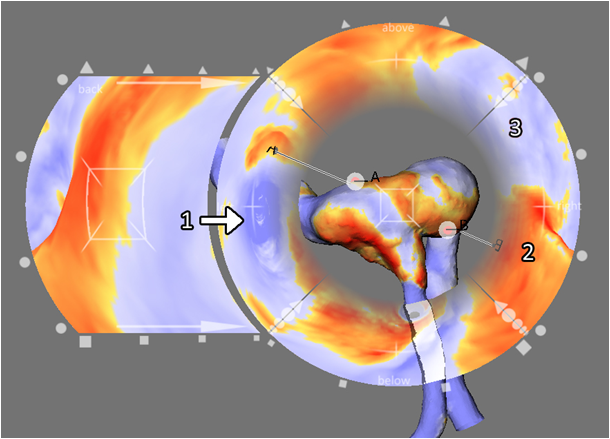
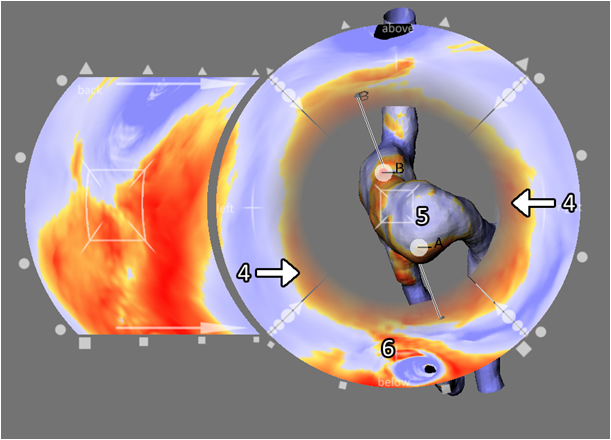
Neugebauer et al. Neugebauer_2009_Eurovis introduced a map display for scalar flow features, where the 3D anatomy model is presented in a central part and flow features of the surrounding sides are presented as flat regions of a map of the anatomical view. The map views and the 3D anatomy view are linked to depict positions of interest selected by the user (see Figure 7). This enables a systematic exploration of all regions. Neuroradiologists emphasized that this technique enables a better exploration of scalar flow features.
Despite encouraging feedback obtained by Neugebauer et al., more evaluation and corresponding refinements are necessary to make this strategy broadly applicable. While in principle their approach is applicable to unsteady flows, it is likely that modifications are necessary if the scalar flow features change over time, leading to frequent changes of both views. Furthermore, flow information is volumetric. Although some measures are meaningful on the vessel wall, several flow features can only be analyzed through full volumetric visualization.
4.4 Blood Flow Probing
Time consuming segmentation is a necessary step in most tools for the inspection of measured flow data. Many tools incorporate functionality for local 2D segmentation of the vasculature gyrotools:2011 . This step is necessary not just to provide the anatomical context, as described in section 4.1, but also to limit the domain where the vector field is considered valid. Due to the acquisition process, measured flow data presents values outside the vessel boundaries. This limits direct applicability of some visualization methods, such as integral lines or particle traces.
Segmentation techniques have been developed to directly segment measured 4D flow data. These methods are based on the assumption that the flow outside the vessel boundary exhibits incoherent behavior chung:2004 ; solem:2004 ; persson:2005 . Van Pelt et al. Pelt:2011b presented an extension of active surfaces to segment flow. Krishnan et al. Krishnan:2011 introduce a segmentation technique based on Finite-Time Lyaponov Exponents (FTLE). The main drawback of these methods is that they will fail in some pathologies due to the characteristics of the flow, e.g., areas with slow flow.
Most flow visualization techniques require seeding or region selection as initialization. The main reason for the selection is to avoid the clutter that visualizing the flow in the full domain supposes. The definition of the seeding region is usually done by probing in the volume domain, often with the help of segmentation.
Van Pelt et al. Pelt:2010 presented a semi-automatic technique to probe cross-sections of anatomical data avoiding full segmentation ( see Figure 5). If anatomical data is not available an option for cross-sectional placement is to use the so called temporal maximum intensity projection (TMIP). For each voxel position of the TMIP scalar volume, the maximum speed is determined along the time axis of the 4D flow data. Hence, each voxel with a bright intensity indicates that a flow velocity with a substantial speed has occurred there at least once during the cardiac cycle. This probing method has several drawbacks: it assumes tubular structures, so it is only valid for vessels, and it does not consider the movement of the vessels during the heart cycle.
In later work, Van Pelt et al Pelt:2011a presented a probing technique to allow fast qualitative inspection, avoiding full segmentation. The user positions a 3D virtual probe on the viewing plane with common 2D interaction metaphors. An automatic fitting of the probe is provided for the third dimension, i.e., the viewing direction. Using the available velocity information of the measured blood flow field, the probe is aligned to this field. In particular, the automated fitting aligns the orientation of the long axis of the virtual probe to be tangential to the average local blood flow orientation. The probe is the basis for further visualizations (see Figure 9).
Van Pelt et al. Pelt:2010 also investigated different local seeding strategies based on the vessel center (e.g., radial or circular) concluding that fixed template seeding cannot accommodate flow variations. Krishnan et al. Krishnan:2011 presented a seeding strategy based on the segmentation of flow maps Soni:2008 . Flow maps are based on the end position of the particle after integration or advection. It is expected that this seeding strategy will adapt to real flow patterns.
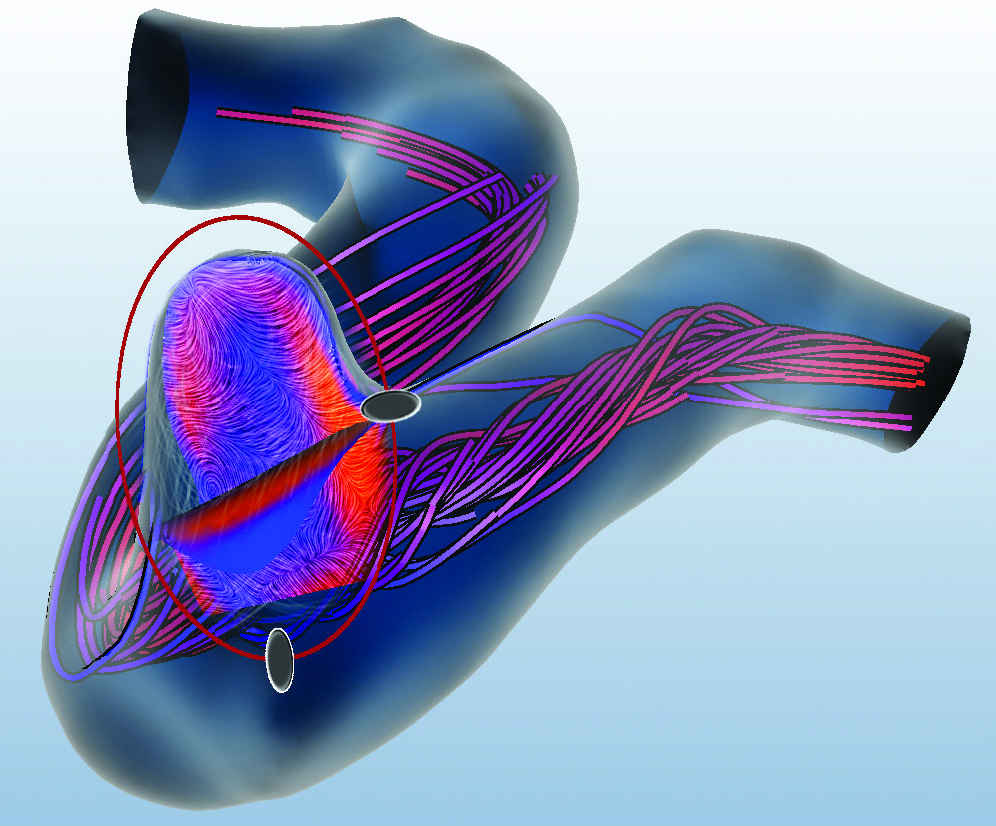
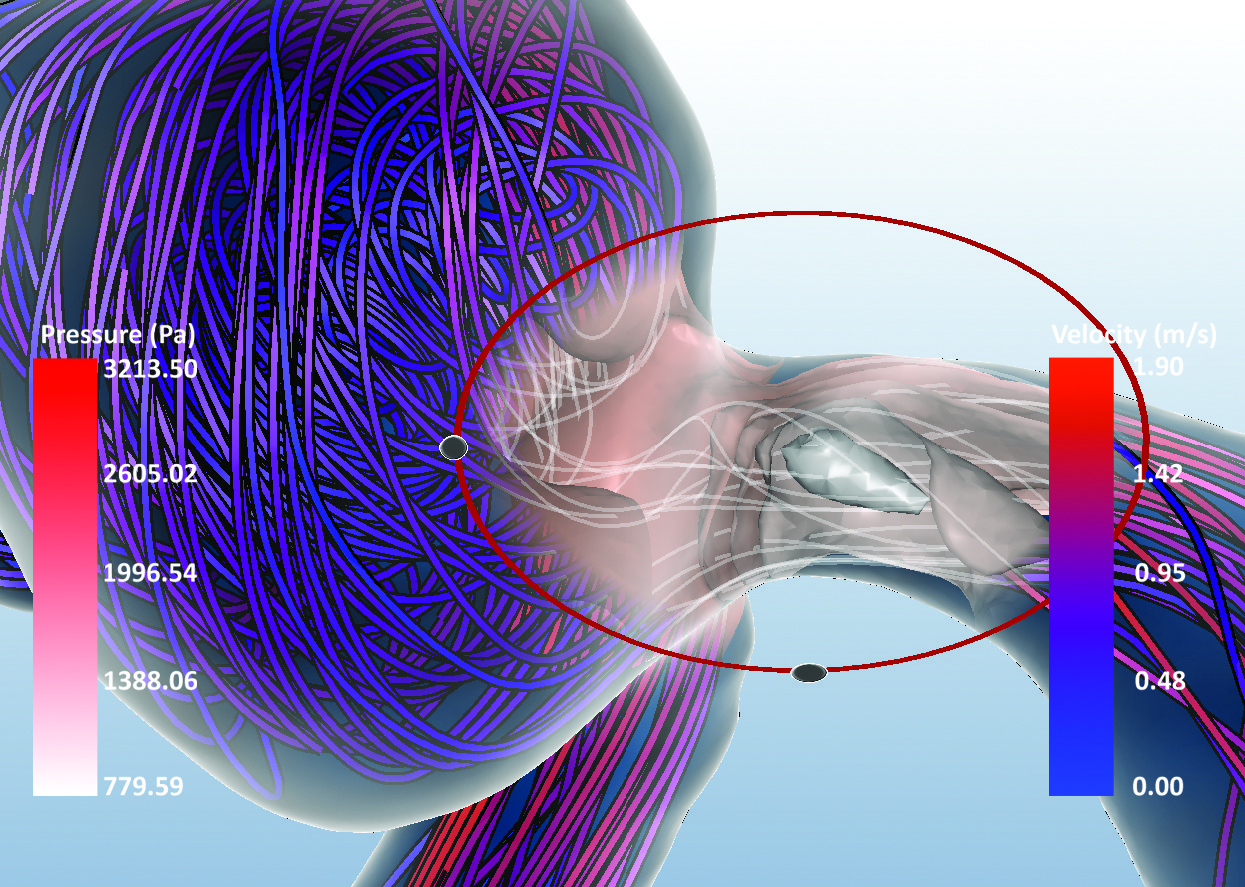
In visualization, focus-and-context approaches are commonly used to avoid clutter. Gasteiger et al. Gasteiger_2011_VIS propose the FlowLens which is a user-defined 2D magic lens. This lens combines flow attributes by showing a different attribute and visualization within and outside the lens. Additionally, they incorporate a 2.5D lens to enable probing and slicing through the flow. To simplify the interface, they provide scopes which are task-based. Each scope consists of pairs of focus vs. context attributes, and propose visualization templates to represent each pair (see Figure 8).
4.5 Blood Flow Visualization
Flow visualization has been an active field of research for decades. It has developed a large number of methods for inspecting flow data, and there are different review articles that define and classify these techniques Post:2003 ; Laramee:2004 . Although these techniques can be directly applied to blood flow fields, it is important to note that not all techniques are meaningful due to the characteristics of the data, e.g., measured data has low temporal resolution. Furthermore, the chosen visualization should be comprehensible to physicians and clinical researchers. In other words, the features shown should be linked to an intuitive understanding of the flow, and the pathology. In the remainder of this section, we will present the most common blood flow visualization techniques that have been proposed in literature, and their variations.
One of the most common ways to depict flow is using integral curves. There are two main approaches used for blood flow the so-called streamlines and pathlines. These integral curves represent the trajectory that a massless particle would follow through the vector field. Streamlines assume steady flow, so the vector field does not change in time. Pathlines are the extension of the streamlines that convey the temporal behavior of unsteady flow fields. Therefore, pathlines are the curves to depict particles trajectories in the vascular system. However, streamlines are still often used to depict instantaneous flow-field structure. In measured flow data, where the temporal resolution is low, streamlines can be informative, since error is accumulated at each integration step of the pathlines, and therefore the reliability of the lines decreases rapidly. Streaklines are another category of integral curves which have been used less often for blood flow. Streaklines are generated by a continuous seeding through time. Each point of the line corresponds to a seed that is continuously integrated through time.
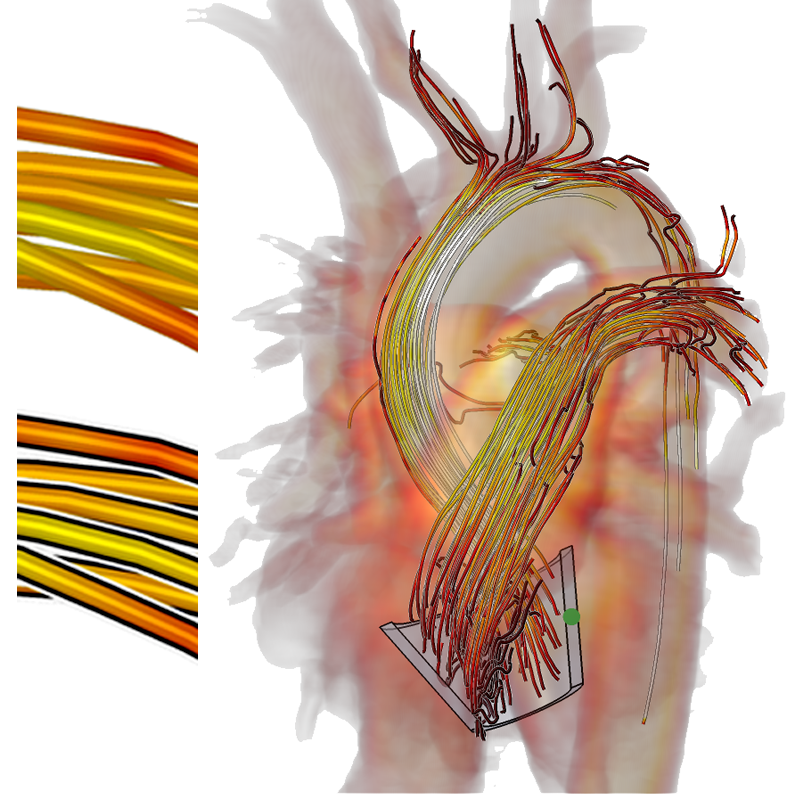
Integral curves are often rendered as illuminated lines or shaded tuboids. Perception of the spatial relations between pathlines is improved by means of halos everts:2009 . Van Pelt et al. Pelt:2011a additionally applied contours in order to enhance the structure of the pathlines (see Figure 9(a)). Two types of seeding strategies are also proposed by Van Pelt et al Pelt:2010 . On the one hand, lines may be seeded statically from a fixed position in space and time. On the other hand, integration curves may be seeded dynamically, tracing the lines from a fixed spatial location, and varying seed time with the current time frame of the cardiac cycle. Dynamically seeded pathlines consist of comparatively short traces. Although the covered temporal range is relatively narrow, the pathlines are more reliable, and provide an approximative depiction of the pulse-wave in the cardiovascular system. The drawback is that it does not provide enough information on a large scale; it only provides sufficient local information.
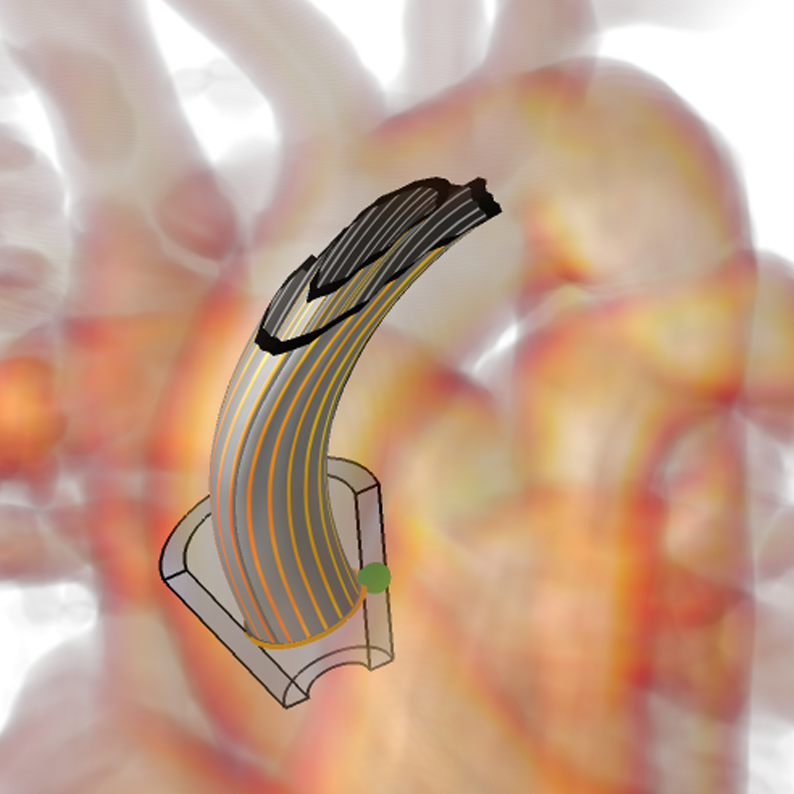
Integral surfaces are a generalization of integral lines. Integral surfaces are formed by a continuum of integral curves. The surfaces enable surface shading techniques which improve the perception of 3D structures. Integral surfaces are initialized by a seeding curve which defines the topological connection between the integral curves. Depending on the integral curve used there exist: streamsurfaces, pathsurfaces and streaksurface. Integral surfaces have been recently studied for blood flow Krishnan:2011 ; Pelt:2011a .
The seeding curve used for initialization is crucial for the correct interpretation of the integral surface. Krishnan et al. Krishnan:2011 define the seeding curve as the boundary of segmented regions based on flow maps. Van Pelt et al. Pelt:2011a presented cross-shaped and tube-shaped patterns of the integral surfaces (see Figure 9(b)). Integral surfaces allow shading and texturing. For example, for tube-shaped surfaces stripes texturing emphasizes the rotational motion around the centerline. The color may convey various derived measures of the blood flow. In the user evaluation of Van Pelt et al. Pelt:2011a , the integral surfaces were considered valuable to explore the local rotational aspects of the flow.
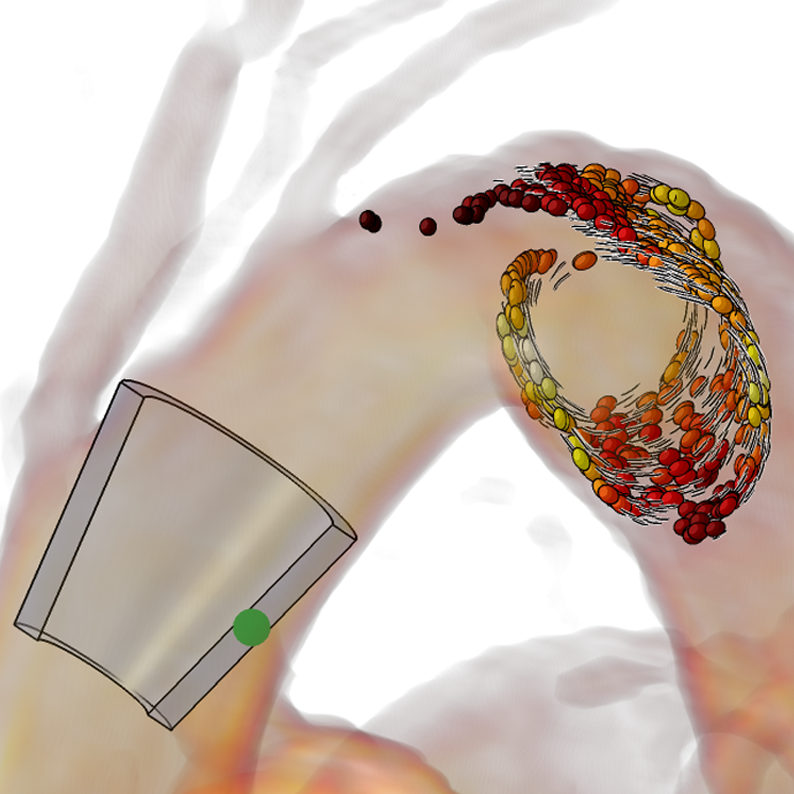
Particle systems are readily applied to blood flow. Commonly, particles are depicted as spheres nvidia:2010 , or otherwise represented by small integral curves gyrotools:2011 . Both approaches convey blood flow speed through color, while direction information is captured by temporal cohesion of the animated particles. Integral curves additionally provide a short history of the particle trajectory. Both conventional approaches employ the available visual cues, such as color and shape, to capture only the blood flow velocity information. Van Pelt et al. Pelt:2011a propose an illustrative particle-based approach that captures the velocity information by means of shape, keeping the color cue available for more elaborate blood flow characteristics. They mimic techniques often used to convey motion in comic books by deforming a ball at high-speed motion, and adding speed lines to improve the perception of direction (see Figure 9(c)).
Visual clutter remains an important issue in 4D blood flow field visualizations. Usually, this clutter is avoided by user biased interaction methods which can miss important properties of the flow. Grouping vector field areas with meaningful similar characteristics, i.e., clustering, can help in developing techniques to improve the visual exploration and minimize the user bias. Some work exists in the clustering of static 3D vector fields Telea:1999 ; Garcke:2000 ; Li:2006 ; Kuhn:2011 while little research has been conducted to extend it to 3D unsteady flow fields Yu:2007 . Developing and extending these techniques to blood flow data is an interesting research direction. The main challenge is to provide a clustering that has a meaning for the user, and an adequate visualization technique that enables efficient exploration of the clusters.
5 Discussion and Open Issues
Simulated and measured blood flow data have been two distinct research fields that have developed in parallel. Simulation data is based on many assumptions, it is difficult to make it patient-specific, and also validation is a challenge. Measured flow data, on the other hand, represents the patient-specific flow, but it has a lot of limitation concerning resolution, artifacts, and noise in the data. An interesting direction is to combine both methods to strengthen each other. For example, measured data can be used as boundary conditions for a simulation, or simulation methods could be used to compensate for the lack of temporal resolution.
Blood flow data sets are considerably large data sets since they consist on a time series of vector-field volumes. The issue of dealing with large data will be of increasing importance given the improvements in spatial and/or temporal resolution that are expected.
Recently, new blood flow visualization techniques have been developed. Many decisions with respect to seeding, segmentation, integral curves, the use of illustration techniques are rather ad-hoc decisions based on intuition. It is important to link the decision to the users’ needs. Additionally a more thorough exploration of the design space and comparisons of existing methods is needed. A major challenge is that this data is new to the domain experts, and it is challenging for them to identify the relevant features to visualize.
The existing methods are rather complex visual representations that overwhelm a considerable portion of the target user group. Future research should address simplifications of the blood flow by either clustering flow or by detecting and emphasizing relevant features. Existing techniques for flow field analysis may serve as orientation, but certainly need to be combined with the in-depth knowledge of domain experts regarding the relevance of certain blood flow characteristics. A better understanding of specific tasks, decisions and relevant information is necessary to support blood flow exploration with a guided workflow-based interaction.
Radiologists need to prepare reports where they summarize their findings verbally including relevant images. A better understanding of such reports may help to better support reporting, e.g., in case of cardiovascular diseases. While current applications are strongly focused on measured cardiac flow and simulated cerebral blood flow, advances in image acquisition will lead to further applications, e.g., where renal or liver flow is represented.
References
- (1) American Heart Association: Heart and stroke statistics (2010) http://www.americanheart.org/statistics/.
- (2) World Health Organization: Cardiovascular diseases (CVDs) (2011) http://www.who.int/mediacentre/factsheets/fs317/.
- (3) Gatehouse, P., Keegan, J., Crowe, L., Masood, S., Mohiaddin, R., Kreitner, K.F., Firmin, D.: Applications of phase-contrast flow and velocity imaging in cardiovascular mri. European Radiology 15 (2005) 2172–2184 10.1007/s00330-005-2829-3.
- (4) Morbiducci, U., Ponzini, R., Rizzo, G., Cadioli, M., Esposito, A., De Cobelli, F., Del Maschio, A., Montevecchi, F., Redaelli, A.: In vivo: Quantification of helical blood flow in human aorta by time-resolved three-dimensional cine phase contrast magnetic resonance imaging. Annals of Biomedical Engineering 37 (2009) 516–531 10.1007/s10439-008-9609-6.
- (5) Lorensen, W.E., Cline, H.E.: Marching cubes: A high resolution 3d surface construction algorithm. In: Proceedings of the 14th annual conference on Computer graphics and interactive techniques. SIGGRAPH ’87, New York, NY, USA, ACM (1987) 163–169
- (6) Wischgoll, T., Choy, J.S., Ritman, E., Kassab, G.S.: Validation of image-based extraction method for morphometry of coronary arteries. Annals of Biomedical Engineering 36(3) (2008) 356–368
- (7) Oeltze, S., Preim, B.: Visualization of vasculature with convolution surfaces: Method, validation and evaluation. IEEE Transactions on Medical Imaging 24(4) (2005) 540–548
- (8) Cebral, J.R., Castro, M.A., Appanaboyina, S., Putmann, C.M., Millan, D., Frangi, A.F.: Efficient Pipeline for Image-Based Patient-Specific Analysis of Cebral Aneurysm Hemodynamics:Technique and Sensitivity. IEEE Transaction on Medical Imaging 24(4) (2005) 457–467
- (9) Venugopal, P., Valentino, D., Schmitt, H., Villablanca, J.P., Viñuela, F., Duckwiler, G.: Sensitivity of patient-specific numerical simulation of cerebal aneurysm hemodynamics to inflow boundary conditions. Journal of neurosurgery 106(6) (2007) 1051–1060
- (10) Torii, R., Oshima, M., Kobayashi, T., Takagi, K., Tezduyar, T.E.: Fluid-structure interaction modeling of blood flow and cerebral aneurysm: significance of artery and aneurysm shapes. Computer Methods in Applied Mechanics and Engineering 198(45-46) (2009) 3613–3621
- (11) Cebral, J.R., Putman, C.M., Alley, M.T., Hope, T., Bammer, R., Calamante, F.: Hemodynamics in normal cerebral arteries: qualitative comparison of 4d phase-contrast magnetic resonance and image-based computational fluid dynamics. Journal of engineering mathematics 64(4) (2009) 367–378
- (12) Nixon, A.M., Gunel, M., Sumpio, B.E.: The Critical Role of Hemodynamics in the Development of Cerebral Vascular Disease. Neurosurgery 112(6) (2010) 1240–1253
- (13) Huo, Y., Kaimovitz, B., Lanir, Y., Wischgoll, T., Hoffman, J.I., Kassab, G.S.: Biophysical model of spatial heterogeneity of myocardial flow. Biophysical Journal 96(10) (2009) 4035–4043
- (14) Greil, G., Geva, T., Maier, S.E., Powell, A.J.: Effect of acquisition parameters on the accuracy of velocity encoded cine magnetic resonance imaging blood flow measurements. Magnetic Resonance Imaging 15(1) (2002) 47–54
- (15) Pelc, N.J., Herfkens, R.J., Shimakawa, A., Enzmann, D.R.: Phase contrast cine magnetic resonance imaging. Magnetic Resonance Quarterly 7 (Oct 1991) 229–254
- (16) Markl, M., Chan, F.P., Alley, M.T., L.Wedding, K., Draney, M.T., Elkins, C.J., Parker, D.W., Taylor, C.A., Herfkens, R.J., Pelc, N.J.: Time resolved three dimensional phase contrast MRI. Magnetic Resonance Imaging 506 (2003) 64
- (17) Bernstein, M.A., Ikezaki, Y.: Comparison of phase-difference and complex-difference processing in phase-contrast MR angiography. Magnetic Resonance Imaging 1(2) (1991) 725–729
- (18) Gatehouse, P.D., Rolf, M.P., Graves, M.J., Hofman, M.B., Totman, J.J., Werner, B., Quest, R.A., Liu, Y., Spiczak von, J., Dieringer, M., Firmin, D.N., Rossum van, A., Lombardi, M., Schwitter, J., Schulz-Menger, J., Kilner, P.J.: Flow measurement by cardiovascular magnetic resonance: a multi-centre multi-vendor study of background phase offset errors that can compromise the accuracy of derived regurgitant or shunt flow measurements. Journal of Cardiovascular Magnetic Resonance 12(5) (January 2010)
- (19) Arheden, H.k., Saeed, M., Törnqvist, E., Lund, G., Wendland, M.F., Higgins, C.B., Stå hlberg, F.: Accuracy of segmented MR velocity mapping to measure small vessel pulsatile flow in a phantom simulating cardiac motion. Journal of Magnetic Resonance Imaging 13(5) (May 2001) 722–728
- (20) Bernstein, M.A., Zhou, X.J., Polzin, J.A., King, K.F., Ganin, A., Pelc, N.J., Glover, G.H.: Concomitant gradient terms in phase contrast MR: Analysis and correction. Magnetic Resonance in Medicine 39(2) (1998) 300–308
- (21) Rolf, M.P., Hofman, M.B.M., Gatehouse, P.D., Markenroth-Bloch, K., Heymans, M.W., Ebbers, T., Graves, M.J., Totman, J.J., Werner, B., van Rossum, A.C., Kilner, P.J., Heethaar, R.M.: Sequence optimization to reduce velocity offsets in cardiovascular magnetic resonance volume flow quantification - a multi-vendor study. Journal of Cardiovascular Magnetic Resonance 13(1) (January 2011) 18
- (22) Lotz, J., Döker, R., Noeske, R., Schüttert, M., Felix, R., Galanski, M., Gutberlet, M., Meyer, G.P.: In vitro validation of phase-contrast flow measurements at 3 T in comparison to 1.5 T: precision, accuracy, and signal-to-noise ratios. Journal of Magnetic Resonance Imaging 21(5) (May 2005) 604–610
- (23) Yang, G.Z., Burger, P., Kilner, P.J., Karwatowski, S.P., Firmin, D.N.: Dynamic range extension of cine velocity measurements using motion-registered spatiotemporal phase unwrapping. Journal of Magnetic Resonance Imaging 6(3) (1996) 495–502
- (24) Langley, J., Zhao, Q.: Unwrapping magnetic resonance phase maps with Chebyshev polynomials. Journal of Magnetic Resonance Imaging 27(9) (November 2009) 1293–1301
- (25) Vlaardingerbroek, M.T., den Boer, J.A.: Magnetic Resonance Imaging. Springer (1999)
- (26) Tappenbeck, A., Preim, B., Dicken, V.: Distance-Based Transfer Function Design: Specification Methods and Applications. In: Proc. of Simulation und Visualisierung. (2006) 259–274
- (27) Neugebauer, M., Gasteiger, R., Diehl, V., Beuing, O., Preim, B.: Automatic generation of context visualizations for cerebral aneurysms from MRA datasets. International Journal of Computer Assisted Radiology and Surgery (CARS) 4 (Supplement 1) (Juni 2009) 112–113
- (28) Viola, I., Kanitsar, A., Groller, M.E.: Importance-driven feature enhancement in volume visualization. IEEE Transactions on Visualization and Computer Graphics 11 (July 2005) 408–418
- (29) Gasteiger, R., Neugebauer, M., Kubisch, C., Preim, B.: Adapted Surface Visualization of Cerebral Aneurysms with Embedded Blood Flow Information. In: Eurographics Workshop on Visual Computing for Biology and Medicine (EG VCBM). (2010) 25–32
- (30) Schlick, C.: A Customizable Reflectance Model for Everyday Rendering. In: Proc. of Fourth Eurographics Workshop on Rendering. (1993) 73–83
- (31) van Pelt, R., Oliván Bescós, J., Breeuwer, M., Clough, R.E., Gröller, M.E., ter Haar Romenij, B., Vilanova, A.: Exploration of 4D MRI blood flow using stylistic visualization. IEEE Transactions on Visualization and Computer Graphics 16(6) (2010) 1339–1347
- (32) Kirbas, C., Quek, F.: A review of vessel extraction techniques and algorithms. ACM Comput. Surv. 36 (2004) 81–121
- (33) Neugebauer, M., Diehl, V., Skalej, M., Preim, B.: Geometric Reconstruction of the Ostium of Cerebral Aneurysms. In Koch, R., Kolb, A., Rezk-Salama, C., eds.: VMV 2010 - Vision, Modeling, Visualization. (2010) 307–314
- (34) Hanson, A.J., Wernert, E.A.: Constrained 3d navigation with 2d controllers. In: Proceedings of the 8th conference on Visualization ’97. VIS ’97, IEEE Computer Society Press (1997) 175–182
- (35) Elmqvist, N., Tudoreanu, M.E., Tsigas, P.: Evaluating motion constraints for 3d wayfinding in immersive and desktop virtual environments. In: Proc. of the ACM SIGCHI conference on Human factors in computing systems. CHI ’08, New York, NY, USA, ACM (2008) 1769–1778
- (36) Kanitsar, A., Fleischmann, D., Wegenkittl, R., Felkl, P., Gröller, E.: CPR: curved planar reformation, IEEE Computer Society (2002) 37–44
- (37) Neugebauer, M., Gasteiger, R., Beuing, O., Diehl, V., Skalej, M., Preim, B.: Map Displays for the Analysis of Scalar Data on Cerebral Aneurysm Surfaces. In: Computer Graphics Forum (EuroVis). Volume 28 (3). (2009) 895–902
- (38) Pruessmann, K., Boesiger, P., Kozerke, S., U. Dydak (Gyrotools): GTFlow. http://www.gyrotools.com/products/gt-flow.html (last visited)
- (39) Chung, A.C.S., Noble, J.A., Summers, P.: Vascular Segmentation of Phase-Contrast Magnetic Resonance Angiograms Based on Statistical Mixture Modeling and Local Phase Coherence. IEEE Transactions on Medical Imaging 23(12) (2004) 1490–1507
- (40) Solem, J.E., Persson, M., Heyden, A.: Velocity Based Segmentation in Phase-Contrast MRI Images. In: Medical Image Computing and Computer-Assisted Intervention. (2004) 459–466
- (41) Persson, M., Solem, J.E., Markenroth, K., Svensson, J., Heyden, A.: Phase contrast MRI segmentation using velocity and intensity. Scale Space and PDE Methods in Computer Vision 3459 (Mar 2005) 119–130
- (42) van Pelt, R., Nguyen, H., Haar Romeny, B., Vilanova, A.: Automated segmentation of blood flow regions in large thoracic arteries using 3D-cine PC-MRI measurements. International Journal of Computer Assisted Radiology and Surgery (2011) 1–8 10.1007/s11548-011-0642-9.
- (43) Krishnan, H., Garth, C., Guhring, J., Gulsun, M., Greiser, A., Joy, K.: Analysis of time-dependent flow-sensitive pc-mri data. Visualization and Computer Graphics, IEEE Transactions on PP(99) (2011) 1
- (44) van Pelt, R., Oliván Bescós, J., Breeuwer, M., Clough, R., Gröller, M., ter Haar Romeny, B., Vilanova, A.: Interactive virtual probing of 4d mri blood flow. IEEE Transactions on Visualization and Computer Graphics (2011) to appear.
- (45) Soni, B., Thompson, D., Machiraju, R.: Visualizing particle/flow structure interactions in the small bronchial tubes. IEEE Transactions on Visualization and Computer Graphics 14 (2008) 1412–1427
- (46) Gasteiger, R., Neugebauer, M., Beuing, O., Preim, B.: The FLOWLENS: A Focus-and-Context Visualization Approach for Exploration of Blood Flow in Cerebral Aneurysms. IEEE Transactions on Visualization and Computer Graphics 17 (2011) to appear
- (47) Post, F.H., Vrolijk, B., Hauser, H., Laramee, R.S., Doleisch, H.: The state of the art in flow visualisation: Feature extraction and tracking. Computer Graphics Forum 22(4) (2003) 775–792
- (48) Laramee, R.S., Hauser, H., Doleisch, H., Vrolijk, B., Post, F.H., Weiskopf, D.: The state of the art in flow visualization: Dense and texture-based techniques. Computer Graphics Forum 23(2) (2004) 203–221
- (49) Everts, M.H., Bekker, H., Roerdink, J.B., Isenberg, T.: Depth-dependent halos: illustrative rendering of dense line data. IEEE Transactions on Visualization and Computer Graphics 15 (2009) 1299–1306
- (50) S. Venkataraman (NVidia): 4D visualization of cardiac flow. http://www.nvidia.com/content/GTC-2010/pdfs/2009_GTC2010.pdf GPU technology conference, 2010.
- (51) Telea, A., van Wijk, J.J.: Simplified representation of vector fields. In: Proceedings of the conference on Visualization ’99: celebrating ten years. VIS ’99, Los Alamitos, CA, USA, IEEE Computer Society Press (1999) 35–42
- (52) Garcke, H., Preuer, T., Rumpf, M., Telea, A., Weikard, U., van Wijk, J.: A continuous clustering method for vector fields. In: Proceedings of the conference on Visualization ’00. VIS ’00, Los Alamitos, CA, USA, IEEE Computer Society Press (2000) 351–358
- (53) Li, H., Chen, W., Shen, I.F.: Segmentation of discrete vector fields. IEEE Transactions on Visualization and Computer Graphics 12 (2006) 289–300
- (54) Kuhn, A., Lehmann, D.J., Gaststeiger, R., Neugebauer, M., Preim, B., Theisel, H.: A clustering-based visualization technique to emphasize meaningful regions of vector fields. In: Proc. of Vision, Modeling, and Visualization (VMV 2011), Eurographics Assosciation (2011) 191–198
- (55) Yu, H., Wang, C., Ma, K.L.: Parallel hierarchical visualization of large time-varying 3d vector fields. In: Proceedings of the 2007 ACM/IEEE conference on Supercomputing. SC ’07, New York, NY, USA, ACM (2007) 24:1–24:12