Galaxy Gas Fractions at High-Redshift: The Tension between Observations and Cosmological Simulations
Abstract
CO measurements of 1-4 galaxies have found that their baryonic gas fractions are significantly higher than galaxies at =0, with values ranging from 20-80%. Here, we suggest that the gas fractions inferred from observations of star-forming galaxies at high- are overestimated, owing to the adoption of locally-calibrated CO-H2 conversion factors (). Evidence from both observations and numerical models suggest that varies smoothly with the physical properties of galaxies, and that can be parameterised simply as a function of both gas phase metallicity and observed CO surface brightness. When applying this functional form, we find in galaxies with . Moreover, the scatter in the observed - relation is lowered by a factor of two. The lower inferred gas fractions arise physically because the interstellar media of high- galaxies have higher velocity dispersions and gas temperatures than their local counterparts, which results in an that is lower than the =0 value for both quiescent discs and starbursts. We further compare these gas fractions to those predicted by cosmological galaxy formation models. We show that while the canonically inferred gas fractions from observations are a factor of 2-3 larger at a given stellar mass than predicted by models, our rederived values for =1-4 galaxies results in revised gas fractions that agree significantly better with the simulations.
keywords:
galaxies:formation-galaxies:high-redshift-galaxies:starburst-galaxies:ISM-ISM:molecules1 Introduction
Recent technological advances in (sub)millimetre-wave telescope facilities have allowed for the detection of star-forming H2 gas in large numbers of galaxies at high-redshift via the proxy molecule 12CO (hereafter, CO; Greve et al., 2005; Tacconi et al., 2006; Coppin et al., 2008; Tacconi et al., 2008; Bothwell et al., 2010; Dannerbauer et al., 2009; Wagg et al., 2009; Carilli et al., 2010; Daddi et al., 2010b, a; Genzel et al., 2010; Riechers et al., 2010; Riechers, 2010; Tacconi et al., 2010; Geach et al., 2011; Casey et al., 2011; Riechers et al., 2011a, b; Wang et al., 2011, see Solomon & Vanden Bout (2005) for a summary of pre-2005 references).
A major finding from these studies is that, at a given stellar mass, early Universe galaxies tend to be significantly more gas rich than their present-day counterparts, with baryonic gas fractions111This includes a 36% correction for Helium. (hereafter defined as = ) ranging from (e.g. Daddi et al., 2010b; Tacconi et al., 2010). This is consistent with both observational and theoretical results that suggest that even gas rich disc galaxies at 2 are able to form stars rapidly enough that they are comparable to the most extreme merger-driven starburst events in the local Universe (Daddi et al., 2005; Hopkins et al., 2010; Davé et al., 2010).
However, there is a tension between the inferred gas fractions of high- galaxies and galaxy formation models. Hydrodynamic cosmological simulations typically account for the simultaneous growth of galaxies via accretion of gas from the intergalactic medium (e.g. Keres et al., 2003) as well as the consumption of gas by star formation. A generic feature of these simulations is that the star formation rate of “main sequence galaxies” (galaxies not undergoing a starburst event) is roughly proportional to the accretion rate, and that galaxies tend to have weakly declining gas fractions as their stellar masses increase. Broadly, at a given stellar mass, galaxies in simulations have baryonic gas fractions a factor of 2-3 less than observed gas fractions. This is seen both in hydrodynamic simulations, as well as semi-analytic models (Lagos et al., 2011). As an example, Davé et al. (2010) find very few galaxies in a simulated Mpc (comoving) volume with stellar mass M☉ with gas fractions greater than 30%. This is in contrast to observations which infer gas fractions in comparable mass galaxies up to 80%.
One potential solution is that the inferred gas masses from high- galaxies are systematically too large. H2 masses are typically calculated using the luminosity of the CO (J=1-0) emission line222In fact only a few studies directly observe CO (J=1-0) at high-. Typically, higher rotational states are observed, and then down-converted to the ground state via an assumption about the CO excitation., and then converted to an H2 mass via a CO-H2 conversion factor 333 is alternatively monikered , or the -factor. The two are related via (cm)= (M☉ (K-km s-1)-1). In this paper, we utilise as notation for the CO-H2 conversion factor.. In the literature, is typically used bimodally with one value for “quiescent/disc mode” star formation, and a lower value for “starburst/merger mode”. In the Galaxy and Local Group, is observed to be relatively constant with an average (Blitz et al., 2007; Fukui & Kawamura, 2010). In contrast, dynamical mass modeling of local galaxy mergers suggests that should be lower in these galaxies by a factor of 2-10 (Downes & Solomon, 1998; Narayanan, 2011). Despite an observed dispersion in inferred values from local mergers, a value of is typically uniformly applied to these starbursts.
At higher redshifts, it is more unclear which of the two bimodal values of to use. For example, for a star-forming disc galaxy that may be undergoing rapid collapse in kiloparsec scale clumps and forming stars at rates M☉yr-1 (i.e. comparable to local galaxy mergers), is the appropriate the locally-calibrated “quiescent/disc” value, or the “starburst/merger” value? Similarly, should high-redshift Submillimetre galaxies (SMGs), which are potentially forming stars up to an order of magnitude faster than local mergers, utilise the locally-calibrated “starburst/merger” value? Typically, observational studies use the locally-calibrated quiescent/disc value for high- discs, and the local starburst/merger value for high- SMGs.
Recent observational evidence by Tacconi et al. (2008); Bolatto et al. (2008); Leroy et al. (2011); Genzel et al. (2012); Schruba et al. (2012) and Papadopoulos et al. (2012), as well as theoretical work by Ostriker & Shetty (2011); Narayanan et al. (2011b); Shetty et al. (2011a, b) and Feldmann et al. (2012) have suggested that perhaps the picture of a bimodal is too simplistic, and that may depend on the physical environment of the interstellar medium (ISM). This picture was expanded upon by Narayanan et al. (2012) who developed a functional form for the dependence of on the CO surface brightness and gas-phase metallicity of a galaxy. When applying this model to observations of high- galaxies, Narayanan et al. (2012) found that on average, high- disc galaxies have values a factor of a few lower than present-epoch discs, and high- SMGs have values lower than present-day ultraluminous infrared galaxies (ULIRGs), with some dispersion. Physically, this means that for a given observed CO luminosity, the inferred H2 gas mass should be systematically less than what one would derive using values calibrated to local galaxies. This owes to warmer and higher velocity dispersion molecular gas in high- galaxies which gives rise to more CO intensity at a given H2 column density. The model form for presented by Narayanan et al. (2012) finds success in matching local observations of discs and ULIRGs (Narayanan et al., 2011b), as well as observed CO-H2 conversion factors for low metallicity systems.
Building on these results, in this paper, we reexamine CO detections from high- galaxies utilising the physically motivated functional form for presented in Narayanan et al. (2012), rather than the traditional bimodal form. We compare our results to those of cosmological hydrodynamic simulations, and show that while the inferred gas fractions derived from the traditional conversion factor are much larger than those predicted by models, the Narayanan et al. (2012) model form for brings these values down, and in reasonable agreement with simulations. A principle result of the work we will present is that the typical gas fraction of a high- galaxy is typically , rather than as is inferred when utilising traditional values. In § 2, we describe the literature data utilised here; in § 3, we present our main results, and in § 4, we summarise.
2 Methodology
2.1 Literature Data
We examine CO detections of both inferred high- disc galaxies as well as Submillimetre Galaxies with masses ranging from M☉ in stellar mass444The limits on stellar masses is highly dependent on which literature stellar masses for SMGs we use (Michałowski et al., 2009; Hainline et al., 2011).. A large number of literature SMGs are compiled by Bothwell et al. (2012), and include 16 new detections presented in that paper. The compilation by Bothwell et al. includes detections from Neri et al. (2003); Greve et al. (2005); Tacconi et al. (2006); Casey et al. (2009); Bothwell et al. (2010) and Engel et al. (2010). Other SMGs included in our work are compiled in Genzel et al. (2010). The inferred disc galaxies are taken primarily from the compilation of Genzel et al. (2010) and Daddi et al. (2010b). These include galaxies from the SINS sample (Förster Schreiber et al., 2009), as well as BzK-selected galaxies Daddi et al. (2004). Finally, we include optically-faint radio galaxies (OFRGs) with CO detections from the Casey et al. (2011) sample.
In our sample, a large number of the BzK and SINS galaxies have been imaged and found to have rotationally dominated gas, consistent with a disc-like morphology. The SMGs are oftentimes assumed to be mergers, though there is some debate over this (Davé et al., 2010; Narayanan et al., 2009, 2010b; Hayward et al., 2010, 2011, 2012). The OFRGs are of unknown origin. As we will discuss in § 3, the global morphology is irrelevant for our model form for , and the general results in this paper.
The observational papers that we draw from had to make a number of assumptions. Our philosophy is to simply utilise those assumptions in this paper, and not make any adjustments to assumed numbers. The reason for this is to isolate the effects of applying our model on the inferred gas fractions. For example, as we will discuss, CO surface brightnesses are required in order to employ the Narayanan et al. (2012) model for . When direct measurements are reported, we utilise those. Otherwise, we make the same size assumption that is made in the paper we draw from. Similarly, a number of the detections presented in the aforementioned papers utilised millimetre-wave telescopes, meaning that the observed transition is of higher-lying CO lines in the rest frame. Conversion to the ground state CO (J=1-0) line then occurs via an assumption of CO excitation. Again, we simply utilise the conversion from excited CO lines to CO (J=1-0) as presented in the paper we pull the data from. This said, the assumed excitation ladders in the literature are all relatively similar.
It is worth a quick word on the stellar masses of the SMGs in our sample. There is an ongoing literature debate regarding the stellar masses of high-redshift SMGs. Specifically, for the same SMGs, Michałowski et al. (2009) and Hainline et al. (2011) find differing stellar masses by up to an order of magnitude (with the Hainline masses being lower). Some attempts to understand the origin of the discrepancy have been reported by Michałowski et al. (2012). In this work, we remain agnostic as to which stellar masses are “correct”, and present our results in terms of both sets of observations when relevant.
2.2 Revised CO-H2 Conversion Factors for Observed Galaxies
As discussed in § 1, we utilise the functional form of derived in Narayanan et al. (2012) to re-calculate the H2 gas masses from the high- galaxies in our sample. In this model, the CO-H2 conversion factor can be expressed as
| (1) |
where has units of M☉ pc-2/K-km s-1, is the gas-phase metallicity in units of solar, and is the luminosity-weighted CO intensity over all GMCs in a galaxy. While is a difficult quantity to observe, in the limit of uniform distribution of luminosity from the ISM in a galaxy, this reduces to the where is the area observed ( is the CO surface brightness). If the light distribution is actually rather concentrated (and most of the area observed is in dim pixels), the true surface brightness of the pixels which emit most of the light will increase, and the true will be even lower than what is calculated by Equation 1. This will cause the gas fractions to decrease even further from what utilising the Narayanan et al. (2012) model for derives, thus enhancing our results. The CO surface brightness () serves as a physical parameterisation for the H2 gas temperature and velocity dispersion, both of which affect the velocity-integrated CO line intensity555For optically thick gas. at a given H2 gas mass.
The functional form for also depends on a gas-phase metallicity. Physically, varies with the gas-phase metallicity due to the growth of CO-dark molecular clouds in low-metallicity gas. In this regime, the required dust to protect CO from photodissociating radiation is not present, but the H2 is abundant enough to self-shield for survival. For the galaxies in question, metallicity measurements are typically not available. Hence, we assume a solar metallicity () for all galaxies. Based on the 2 mass-metallicity relation, galaxies of mass M☉ typically have metallicities of order solar (Erb et al., 2006). Thus, an assumption of is likely reasonable. We test the validity of this assumption by examining the effect of including a stellar mass-metallicity relation. Following Erb et al. (2006), we assume all galaxies above M☉ have , and that the metallicity evolves as ()0.3 for lower mass galaxies. The gas fractions in this test do not deviate by more than 10% compared to our assumption that 666We note that there is one galaxy which varies by . This is the lowest mass galaxy in the Hainline et al. (2011) stellar mass determinations.. This is because of the weak dependence of metallicity on stellar mass, the weak dependence of on metallicity, and the fact that gas fractions depend on stellar mass as well as gas mass.
It is worth noting that the results in this paper are not entirely dependent on the model for given in Equation 1. A compilation of observations result in a very similar relation. Ostriker & Shetty (2011) showed that and are related via a powerlaw in observed galaxies; a conversion of to via the relation = (and a linear relationship between and ) gives an - relation that is nearly identical to the model form in Equation 1. Similarly, while we assume for the observed galaxies analysed in this work, we note that the model power-law relation between and is very similar to what has been observed in samples of low-metallicity galaxies (Bolatto et al., 2008; Leroy et al., 2011; Genzel et al., 2012). In this sense, the forthcoming results in this paper could be derived entirely from empirical observational evidence.
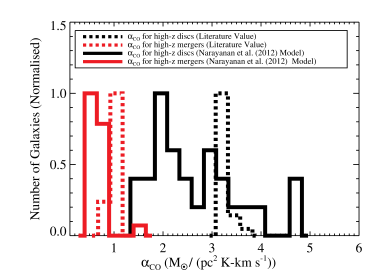
In Figure 1, we plot histograms of the literature values used in the observations of the galaxies analysed in this work (black), as well as our re-derived values based on Equation 1 (red). We divide the lines into high- mergers (where SMGs are assumed to be mergers in this figure and hereafter) and high- discs so that the reader can see the relative difference between our derived values and the original ones. While the range of values is similar in both cases, there is significantly more power toward low values when utilising our model for both high- discs and high- mergers.

3 Results and Discussion
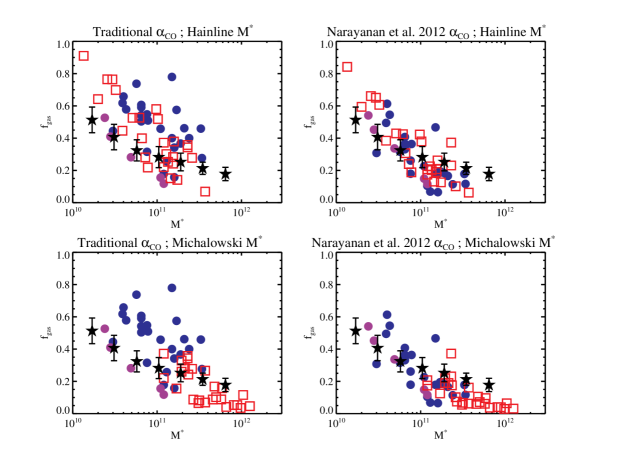
We first examine the effect of modifying from the traditional bimodal values to the Narayanan et al. (2012) model on the - relation in high- galaxies. In Figure 2, we show the - relation for all galaxies in our sample utilising both the Michałowski et al. (2009) and Hainline et al. (2011) stellar masses. The left panels show the relationship for the observed galaxies when using the traditional bimodal , and the right panels when applying Equation 1. In order to compare with galaxy formation simulations, we overlay the mean - relation from the cosmological hydrodynamic calculations of Davé et al. (2010) denoted by stars. The error bars in the stars denote the range in possible values for the simulated galaxies in a given stellar mass bin. The simulated galaxies mostly represent “main-sequence” galaxies which are not typically undergoing a starburst event.
When examining the left panels in Figure 2, it is evident that the observed galaxies all have substantially higher gas fractions at a given stellar mass than the simulations. While lower-mass systems can be biased to somewhat higher gas fractions because they are (in part) selected by far-infrared luminosity, we have tried applying similar cuts to simulations and find that this cannot explain the difference. In contrast, when applying a CO-H2 conversion factor which varies smoothly with physical environment, the inferred H2 gas masses from the CO line measurements drop and come into better agreement with the simulations. Depending on the stellar mass adopted for the SMGs, the gas fractions can drop by up to a factor of 3 for a given galaxy.
The reason for the drop in gas fraction when using the Narayanan et al. (2012) model for versus the traditional bimodal value is due to the typical environments of high- galaxies. The gas fractions of high- discs are typically large enough that, absent substantial internal feedback, large kpc-scale clumps of gas become unstable and fragment (Springel et al., 2005; Ceverino et al., 2010; Hopkins et al., 2011). These clumps can have large internal velocity dispersions (), and warm gas temperatures owing to high star formation rates (; Narayanan et al., 2011a). High velocity dispersions and warm gas causes increased CO line luminosity for a given H2 gas mass, and reduces (Narayanan et al., 2011b). Because of this, in our model, high- disc galaxies tend to have lower777Increased UV photons produced in high SFR galaxies do have the potential to photodissociate CO. However, these galaxies tend to have large dust to gas ratios. Increased dust columns allow GMCs to reach quickly, and shield CO from photodissociation throughout the bulk of the GMC (Narayanan et al., 2012). values than the traditional present-epoch “quiescent/disc” value (though larger than the traditional present-epoch “starburst/merger” value; Figure 1). The mean derived for high- discs is 2.5, approximately half that of the Daddi et al. (2010b) and Magdis et al. (2011) measurements of high- BzK galaxies.
A similar effect is true for high- starburst galaxies. Owing to extreme star formation rates (potentially up to a thousand M☉yr-1; Narayanan & Davé, 2012), the gas temperatures and velocity dispersions in violent 2 mergers exceed those of even present-day ULIRGs. Hence, the average is lower than the average ULIRG value today. Our average derived value for the high- galaxies in our sample is . Magdis et al. (2011) finds an upper limit of the of a =4 SMG of 1, and Tacconi et al. (2008) finds a reasonable fit to their observed SMGs with an of unity.
The combined effect of our modeling is that for high- discs is typically lower than that of the traditional =0 “quiescent/disc” value, and for high- starbursts is lower than that of the traditional =0 “starburst/merger” value (Figure 1). Employing our model consequently lowers gas masses, and brings gas fractions into better agreement with cosmological galaxy formation models. This is quantitatively shown in Figure 3, where we plot the residuals between the observed data and models for both the traditional , as well as that derived from the Narayanan et al. (2012) functional form.
The usage of our model form of reduces the scatter in the - relation in observed galaxies by a factor at a given . To calculate the reduction in scatter, we compare the standard deviation in galaxy gas fractions within a limited range of stellar masses (). Much of the scatter in the original - relation arises from using the bimodal values. In contrast, our model form of varies smoothly with the physical conditions in the ISM in a galaxy, and has no knowledge as to whether or not the global morphology of a galaxy is a merger or a disc. So, if some high- disc galaxies actually have physical conditions in their ISM comparable to starbursts, then their values will be lower than the canonical “quiescent/disc” (Figure 1). The vice-versa is true for high- SMGs and OFRGs. When accounting for the continuum in physical properties in the ISM of high- galaxies (rather than binning them bimodally), the scatter in the observed - relation reduces substantially. The correlation coefficient between the observed gas fractions and modeled ones increases by (from to for both the Michalowski and Hainline masses.
The usage of the Michałowski et al. (2009) masses result in observed below the simulations for the highest mass galaxies. This could reflect either an overestimate of masses, or perhaps physical processes that are neglected in the Davé et al. (2011) simulations where most SMGs (the most massive galaxies) are quiescent, main-sequence objects. Potential neglected physical processes include starbursts which may deplete gas (e.g. Narayanan et al., 2009, 2010a, 2010b; Hayward et al., 2011), or a stage of gas consumption without replenishment (that ultimately ends in passive galaxies).
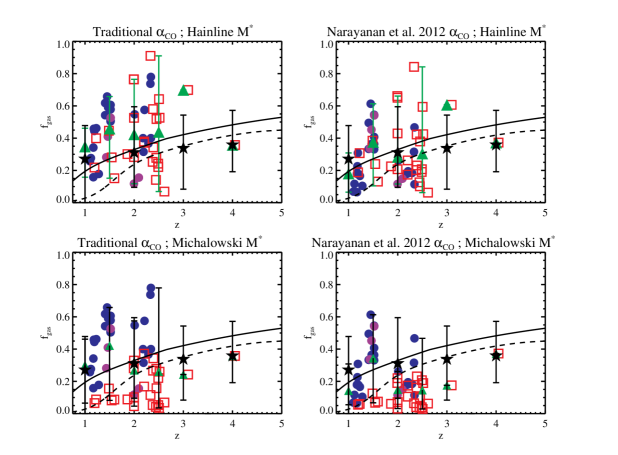
Utilising our model additionally results in better agreement between the observed cosmic evolution of the gas fraction of galaxies with redshift and modeled evolution. In Figure 4, we plot the observed gas fractions of the galaxies in our literature sample against their redshifts. To help guide the eye, we overplot the mean values (with dispersion) in redshift bins of 0.5. We show the predicted values from the analytic model of Davé et al. (2011) for halos of mass (at =0) and M☉ by the solid and dashed lines respectively, and the simulated points from Davé et al. (2010) by the stars.
When comparing the mean observed values to the predictions from analytic arguments and cosmological simulations, we again see that when using the traditional calibrated to local values, the inferred gas fractions are significantly higher than the predictions from models. When applying the Narayanan et al. (2012) model for , the mean values come into better agreement with simulations. The scatter (as measured as the standard deviation in gas fractions between ) decreases by when utilising our model form for as compared to the traditional values888We note that to properly evaluate the evolution of the gas fraction of galaxies with redshift, one would ideally examine the same limited stellar mass range at each redshift interval. Given the limited number of CO detections at high-, however, this is currently infeasible. An examination of the galaxies in Figure 2 shows that the majority of our galaxies reside in a stellar mass range of log. The lack of clean sample selection is evident in the marginal increase in the already weak correlation coefficients: the correlation coefficient increases from to for the Hainline masses, and remains roughly constant at for the Michalowski masses. Forthcoming work will address the cosmic evolution of galaxy gas fractions in more detail..
It is important to note that it is the normal star-forming galaxies (e.g. the BzK galaxies represented by the filled blue circles) that come into better agreement with the simulations. On the other hand, SMGs, represented by the open red squares in Figure 4, have lower gas fractions than the models predict. This is because SMGs are not typical galaxies at high-, but rather rare massive outliers, and therefore not reflected in the predictions for an average galaxy at high-.
Comparing the results of this paper to other galaxy formation models is nontrivial. For example, when comparing to galaxies above Lbol L☉ , the gas fractions returned from our model are significantly lower than those predicted by recent semi-analytic models (SAMs). Lagos et al. (2011) utilised the Durham SAM to predict the H2 content in galaxies over cosmic time. As shown by Bothwell et al. (2012), these models substantially over predict the H2 gas fraction as a function of redshift. However, comparing to galaxies above Lbol L☉ produces better agreement, however (C. Lagos, private communication). Popping et al. (2012) utilised an indirect methodology to derive the H2 content in observed galaxies. By inverting the Schmidt relation, and using the Blitz & Rosolowsky (2006) pressure-based prescription for deriving the H2/HI ratio, these authours found a gas fraction-stellar mass relation in good agreement with those derived from CO measurements. Implicit in this model, however, is an assumption of an conversion factor in setting the normalisation of the observed Schmidt relation. In this sense, the measurement is not entirely independent of the methods used in CO-derived gas fractions.
4 Summary
Observed baryonic gas fractions from high-redshift galaxies as inferred from CO measurements are typically higher at a given stellar mass or redshift than cosmological galaxy formation models would predict. These differences can amount to a factor of 2-3 in gas fraction.
We suggest that the observed gas fractions are overestimated due to the usage of locally-calibrated CO-H2 conversion factors (). If scales inversely with the CO surface brightness from a galaxy (as both numerical models and empirical observational evidence suggest), then both high- disc galaxies and high- mergers will have lower average values than their =0 analogs. This means that for a given CO luminosity, there will be less underlying H2 gas mass.
Applying a functional form for (Equation 1) decreases the inferred H2 gas masses by a factor of , and brings them into agreement with cosmological galaxy formation models. Similarly, the usage of our model reduces the scatter in the observed - relation by a comparable amount. Galaxy gas fractions decrease monotonically with increasing stellar mass, while the average gas fraction of galaxies in a given stellar mass range increases with redshift.
Acknowledgements
DN acknowledges support from the NSF via grant AST-1009452 and thanks Claudia Lagos and Gergö Popping for helpful conversations. RD was supported by the NSF under grant numbers AST-0847667 and AST-0907998. We additionally thank the anonymous referee for helpful suggestions that improved the presentation of these results. Computing resources were obtained through grant number DMS-0619881 from the National Science Foundation.
References
- Blitz et al. (2007) Blitz, L., Fukui, Y., Kawamura, A., Leroy, A., Mizuno, N., & Rosolowsky, E. 2007, in Protostars and Planets V, ed. B. Reipurth, D. Jewitt, & K. Keil, 81–96
- Blitz & Rosolowsky (2006) Blitz, L. & Rosolowsky, E. 2006, ApJ, 650, 933
- Bolatto et al. (2008) Bolatto, A. D., Leroy, A. K., Rosolowsky, E., Walter, F., & Blitz, L. 2008, ApJ, 686, 948
- Bothwell et al. (2012) Bothwell, M. S., Smail, I., Chapman, S. C., Genzel, R., Ivison, R. J., Tacconi, L. J., Alaghband-Zadeh, S., Bertoldi, F., Blain, A. W., Casey, C. M., Cox, P., Greve, T. R., Lutz, D., Neri, R., Omont, A., & Swinbank, A. M. 2012, arXiv/1205.1511
- Bothwell et al. (2010) Bothwell, M. S. et al. 2010, MNRAS, 405, 219
- Carilli et al. (2010) Carilli, C. L. et al. 2010, ApJ, 714, 1407
- Casey et al. (2009) Casey, C. M., Chapman, S. C., Beswick, R. J., Biggs, A. D., Blain, A. W., Hainline, L. J., Ivison, R. J., Muxlow, T. W. B., & Smail, I. 2009, MNRAS, 1231
- Casey et al. (2011) Casey, C. M., Chapman, S. C., Neri, R., Bertoldi, F., Smail, I., Coppin, K., Greve, T. R., Bothwell, M. S., Beswick, R. J., Blain, A. W., Cox, P., Genzel, R., Muxlow, T. W. B., Omont, A., & Swinbank, A. M. 2011, MNRAS, 415, 2723
- Ceverino et al. (2010) Ceverino, D., Dekel, A., & Bournaud, F. 2010, MNRAS, 404, 2151
- Coppin et al. (2008) Coppin, K. E. K., Swinbank, A. M., Neri, R., Cox, P., Alexander, D. M., Smail, I., Page, M. J., Stevens, J. A., Knudsen, K. K., Ivison, R. J., Beelen, A., Bertoldi, F., & Omont, A. 2008, MNRAS, 389, 45
- Daddi et al. (2004) Daddi, E. et al. 2004, ApJ, 617, 746
- Daddi et al. (2005) —. 2005, ApJ, 631, L13
- Daddi et al. (2010a) —. 2010a, ApJ, 714, L118
- Daddi et al. (2010b) —. 2010b, ApJ, 713, 686
- Dannerbauer et al. (2009) Dannerbauer, H., Daddi, E., Riechers, D. A., Walter, F., Carilli, C. L., Dickinson, M., Elbaz, D., & Morrison, G. E. 2009, ApJ, 698, L178
- Davé et al. (2011) Davé, R., Finlator, K., & Oppenheimer, B. D. 2011, arXiv/1108.0426
- Davé et al. (2010) Davé, R., Finlator, K., Oppenheimer, B. D., Fardal, M., Katz, N., Kereš, D., & Weinberg, D. H. 2010, MNRAS, 404, 1355
- Downes & Solomon (1998) Downes, D. & Solomon, P. M. 1998, ApJ, 507, 615
- Engel et al. (2010) Engel, H., Tacconi, L. J., Davies, R. I., Neri, R., Smail, I., Chapman, S. C., Genzel, R., Cox, P., Greve, T. R., Ivison, R. J., Blain, A., Bertoldi, F., & Omont, A. 2010, ApJ, 724, 233
- Erb et al. (2006) Erb, D. K., Shapley, A. E., Pettini, M., Steidel, C. C., Reddy, N. A., & Adelberger, K. L. 2006, ApJ, 644, 813
- Feldmann et al. (2012) Feldmann, R., Gnedin, N. Y., & Kravtsov, A. V. 2012, ApJ, 747, 124
- Förster Schreiber et al. (2009) Förster Schreiber, N. M. et al. 2009, ApJ, 706, 1364
- Fukui & Kawamura (2010) Fukui, Y. & Kawamura, A. 2010, ARA&A, 48, 547
- Geach et al. (2011) Geach, J. E., Smail, I., Moran, S. M., MacArthur, L. A., Lagos, C. d. P., & Edge, A. C. 2011, ApJ, 730, L19
- Genzel et al. (2010) Genzel, R. et al. 2010, MNRAS, 407, 2091
- Genzel et al. (2012) —. 2012, ApJ, 746, 69
- Greve et al. (2005) Greve, T. R. et al. 2005, MNRAS, 359, 1165
- Hainline et al. (2011) Hainline, L. J., Blain, A. W., Smail, I., Alexander, D. M., Armus, L., Chapman, S. C., & Ivison, R. J. 2011, ApJ, 740, 96
- Hayward et al. (2012) Hayward, C. C., Jonsson, P., Kereš, D., Magnelli, B., Hernquist, L., & Cox, T. J. 2012, MNRAS, 424, 951
- Hayward et al. (2011) Hayward, C. C., Kereš, D., Jonsson, P., Narayanan, D., Cox, T. J., & Hernquist, L. 2011, ApJ, 743, 159
- Hayward et al. (2010) Hayward, C. C., Narayanan, D., Jonsson, P., Cox, T. J., Kereš, D., Hopkins, P. F., & Hernquist, L. 2010, Conference Proceedings for UP2010: Have Observations Revealed a Variable Upper End of the Initial Mass Function? Treyer, Lee, Seibert, Wyder, Neil eds. arXiv/1008.4584
- Hopkins et al. (2011) Hopkins, P. F., Keres, D., Murray, N., Quataert, E., & Hernquist, L. 2011, arXiv/1111.6591
- Hopkins et al. (2010) Hopkins, P. F., Younger, J. D., Hayward, C. C., Narayanan, D., & Hernquist, L. 2010, MNRAS, 402, 1693
- Keres et al. (2003) Keres, D., Yun, M. S., & Young, J. S. 2003, ApJ, 582, 659
- Lagos et al. (2011) Lagos, C. D. P., Baugh, C. M., Lacey, C. G., Benson, A. J., Kim, H.-S., & Power, C. 2011, MNRAS, 418, 1649
- Leroy et al. (2011) Leroy, A. K., Bolatto, A., Gordon, K., Sandstrom, K., Gratier, P., Rosolowsky, E., Engelbracht, C. W., Mizuno, N., Corbelli, E., Fukui, Y., & Kawamura, A. 2011, ApJ, 737, 12
- Magdis et al. (2011) Magdis, G. E., Daddi, E., Elbaz, D., Sargent, M., Dickinson, M., Dannerbauer, H., Aussel, H., Walter, F., Hwang, H. S., Charmandaris, V., Hodge, J., Riechers, D., Rigopoulou, D., Carilli, C., Pannella, M., Mullaney, J., Leiton, R., & Scott, D. 2011, ApJ, 740, L15
- Michałowski et al. (2012) Michałowski, M. J., Dunlop, J. S., Cirasuolo, M., Hjorth, J., Hayward, C. C., & Watson, D. 2012, A&A, 541, A85
- Michałowski et al. (2009) Michałowski, M. J., Hjorth, J., & Watson, D. 2009, arXiv/0905.4499
- Narayanan (2011) Narayanan, D. 2011, arXiv/1112.1073
- Narayanan et al. (2011a) Narayanan, D., Cox, T. J., Hayward, C. C., & Hernquist, L. 2011a, MNRAS, 412, 287
- Narayanan et al. (2009) Narayanan, D., Cox, T. J., Hayward, C. C., Younger, J. D., & Hernquist, L. 2009, MNRAS, 400, 1919
- Narayanan & Davé (2012) Narayanan, D. & Davé, R. 2012, MNRAS, 423, 3601
- Narayanan et al. (2010a) Narayanan, D., Dey, A., Hayward, C. C., Cox, T. J., Bussmann, R. S., Brodwin, M., Jonsson, P., Hopkins, P. F., Groves, B., Younger, J. D., & Hernquist, L. 2010a, MNRAS, 407, 1701
- Narayanan et al. (2010b) Narayanan, D., Hayward, C. C., Cox, T. J., Hernquist, L., Jonsson, P., Younger, J. D., & Groves, B. 2010b, MNRAS, 401, 1613
- Narayanan et al. (2011b) Narayanan, D., Krumholz, M., Ostriker, E. C., & Hernquist, L. 2011b, MNRAS, 418, 664
- Narayanan et al. (2012) Narayanan, D., Krumholz, M. R., Ostriker, E. C., & Hernquist, L. 2012, MNRAS, 421, 3127
- Neri et al. (2003) Neri, R. et al. 2003, ApJ, 597, L113
- Ostriker & Shetty (2011) Ostriker, E. C. & Shetty, R. 2011, ApJ, 731, 41
- Papadopoulos et al. (2012) Papadopoulos, P. P., van der Werf, P., Xilouris, E., Isaak, K. G., & Gao, Y. 2012, ApJ, 751, 10
- Popping et al. (2012) Popping, G., Caputi, K. I., Somerville, R. S., & Trager, S. C. 2012, arXiv/1201.3826
- Riechers et al. (2010) Riechers, D. A., Carilli, C. L., Walter, F., & Momjian, E. 2010, ApJ, 724, L153
- Riechers et al. (2011a) Riechers, D. A. et al. 2011a, ApJ, 739, L32
- Riechers et al. (2011b) —. 2011b, ApJ, 739, L31
- Riechers (2010) Riechers, D. A. o. 2010, ApJ, 720, L131
- Schruba et al. (2012) Schruba, A., Leroy, A. K., Walter, F., Bigiel, F., Brinks, E., de Blok, W. J. G., Kramer, C., Rosolowsky, E., Sandstrom, K., Schuster, K., Usero, A., Weiss, A., & Wiesemeyer, H. 2012, arXiv/1203.4321
- Shetty et al. (2011a) Shetty, R. et al. 2011a, MNRAS, 412, 1686
- Shetty et al. (2011b) —. 2011b, MNRAS, 415, 3253
- Solomon & Vanden Bout (2005) Solomon, P. M. & Vanden Bout, P. A. 2005, ARA&A, 43, 677
- Springel et al. (2005) Springel, V., Di Matteo, T., & Hernquist, L. 2005, MNRAS, 361, 776
- Tacconi et al. (2006) Tacconi, L. J. et al. 2006, ApJ, 640, 228
- Tacconi et al. (2008) —. 2008, ApJ, 680, 246
- Tacconi et al. (2010) —. 2010, Nature, 463, 781
- Wagg et al. (2009) Wagg, J., Kanekar, N., & Carilli, C. L. 2009, ApJ, 697, L33
- Wang et al. (2011) Wang, R. et al. 2011, AJ, 142, 101