Thermal to Nonthermal Energy Partition at the Early Rise Phase of Solar Flares
Abstract
In some flares the thermal component appears much earlier than the nonthermal component in X-ray range. Using sensitive microwave observations we revisit this finding made by Battaglia et al. (2009) based on thorough analysis of RHESSI data. We have found that nonthermal microwave emission produced by accelerated electrons with energy of at least several hundred keV, appears as early as the thermal soft X-ray emission indicative that the electron acceleration takes place at the very early flare phase. The non-detection of the hard X-rays at that early stage of the flares is, thus, an artifact of a limited RHESSI sensitivity. In all considered events, the microwave emission intensity increases at the early flare phase. We found that either thermal or nonthermal gyrosynchrotron emission can dominate the low-frequency (optically thick) part of the microwave spectrum below the spectral peak occurring at 3-10 GHz. In contrast, the high-frequency optically thin part of the spectrum is always formed by the nonthermal, accelerated electron component, whose power-law energy spectrum can extend up to a few MeV at this early flare stage. This means that even though the total number of accelerated electrons is small at this stage, their nonthermal spectrum is fully developed. This implies that an acceleration process of available seed particles is fully operational. While, creation of this seed population (the process commonly called ‘injection’ of the particles from the thermal pool into acceleration process) has a rather low efficiency at this stage, although, the plasma heating efficiency is high. This imbalance between the heating and acceleration (in favor of the heating) is difficult to reconcile within most of available flare energization models. Being reminiscent of the trade off between the Joule heating and runaway electron acceleration, it puts additional constraints on the electron injection into the acceleration process. As a byproduct of this study, we demonstrate that for those cases when the optically thick part of the radio spectrum is dominated by the thermal contribution, the microwave spectral data yields reliable estimates of the magnetic field and source area at the early flare phase.
Subject headings:
Sun: filaments — Sun: flares — Sun: radio radiation — Sun: UV radiation1. Introduction
The most prominent flare manifestations are explosive plasma heating and particle acceleration. The balance between thermal and nonthermal energy content varies during the flare and from one flare to another. The particle acceleration is widely believed to dominate at the impulsive phase; these electrons, after being accelerated, propagate along closed magnetic field lines from coronal acceleration sites towards denser low corona and chromosphere. A direct diagnostics of the nonthermal electrons comes from hard X-ray observations of the bremsstrahlung as the flare-accelerated electrons collide with ions. The bremsstrahlung intensity is proportional to the ambient density; so the bulk of the hard X-ray (HXR) emission comes typically from the chromospheric footpoints where the precipitating flare-accelerated electrons lose most of their energy. In contrast, coronal HXR emission from the very acceleration sites is difficult to detect except cases of acceleration in very dense flaring loops (Bastian et al., 2007; Xu et al., 2008). However, it is difficult here to isolate the directly accelerated component because of essential in-situ Coulomb losses, whose effect depends on both transport regime and particle energy. Another class of events in which the coronal HXR emission is easier to detect is the partially occulted flares where the intense footpoints are not visible (see Masuda et al., 1995; Wang et al., 1995; Krucker et al., 2010), and a review by Krucker et al. (2008)). Analysis of such cases, however, suffers from the fact that the full flare energy balance is unavailable since the footpoint information is missing. Fortunately, the situation is greatly improved if microwave observations are used to complement the X-ray data. The radio emissions produced directly at the coronal acceleration site can be firmly separated from other competing radio components, in favorable cases, allowing us to study the acceleration region directly (Fleishman et al., 2011).
In addition to the main flare phase showing copious electron acceleration; observations provide strong evidence for a pre-flare coronal activity unrelated to evaporation driven by precipitating electrons (Harra et al., 2001). Sometimes there is a prominent coronal soft X-ray (SXR) emission occurring several minutes before the impulsive phase start (Fárník & Savy, 1998). Further important knowledge about the pre-flare activity has been obtained from RHESSI spectral observations at the low-energy range, 3 – 20 keV. Krucker et al. (2008) called this flare period with a pronounced gradual increase of the SXR emission occurring minutes before the detectable onset of the HXR emission the early flare phase. The flares occurred on 2002 July 23 (Lin et al., 2003; Asai et al., 2006) and 2003 November 03 (Veronig et al., 2006) represent vivid examples of flares with the early phase.
The study of flare energization in the form of plasma heating and particle acceleration at this early phase is of particular interest, because it can clarify how the flare energy release is initiated and what mechanisms are responsible for partition of the released energy between the thermal and nonthermal components. For example, recently Battaglia et al. (2009) have analyzed four flares and have demonstrated that morphology of these events showed one hot coronal source only, while the footpoints appeared much later, at the onset of the nonthermal HXR emission. Remarkably, the X-ray spectra of these coronal sources at the early phase were nicely fit as purely thermal. Battaglia et al. (2009) concluded that (i) the early flare phase is purely thermal; (ii) the detected increase of the thermal plasma emission measure (EM) requires some chromospheric evaporation, and (iii) the heat conduction is needed to drive this chromospheric evaporation. On the other hand Siarkowski et al. (2009) have studied the early phase in two simple flares, and concluded that the process of electron acceleration can occur during the early phase of flares; well before the impulsive stage.
Microwave observations of the 2002 July 23 flare (Asai et al., 2006, 2009) favor the non-thermal alternative (see, also, White et al., 2011). Holman et al. (2003) examined HXR features of this flare, and reported that the nonthermal energy, even before the impulsive phase, was quite large. So, there is yet no clear and consistent picture of how the flare/preflare energy is released, and in what proportions it is divided between the thermal and nonthermal components. In particular, if the plasma is primarily heated by Coulomb losses of accelerated electrons, or directly by the energy release remains an open, fundamental problem (see, e.g. Petrosian & Liu, 2004; Liu & Fletcher, 2009).
In this study we address this fundamental problem using microwave data (from various instruments), which is more sensitive to the nonthermal electron component than the HXR data. Along with other available microwave data, we use an essentially new input for the early phase study: the radio imaging at 5.7 GHz, which is indeed of primary importance since this frequency falls into the spectral peak region of the radio emission from the coronal sources at the early phase. Note, that the first observation of the 5.7 GHz early coronal source was performed back in 1992, well before the RHESSI era during X9 limb flare on 1992 November 02 (Altyntsev et al., 1999). The brightness center at 5.7 GHz was 10 Mm higher than the 17 GHz footpoint source.
Observationally, this study can be facilitated by the fact that the preflare coronal sources are often reasonably compact and weak. So the role of source inhomogeneity and contribution from competing emission mechanisms, otherwise essential, can be relatively minor in this case. Our event list consists of two (of four) events from Battaglia et al. (2009) list complemented by three more events suitable for the analysis. No appropriate microwave data is available for two other events from Battaglia et al. (2009) list. For the modeling of the microwave spectra we take into account both thermal and nonthermal electron components (Benka & Holman, 1992; Fleishman & Kuznetsov, 2010).
In all the cases, we firmly detected a nonthermal electron population as early as the thermal emission appeared. The energy content of the nonthermal electron population remained small and inessential for the plasma heating, indicative that the thermal plasma is heated by the flare energy release directly. In three (of five) cases, the low-frequency optically thick part of the microwave spectrum was entirely formed by SXR-producing thermal plasma, which offers a precise diagnostics of the source effective area and magnetic field. The source area (and thus, presumably the source volume) was found to grow in all these three events indicative that no chromospheric evaporation was needed to account for the EM increase. The observed EM increase is well consistent with a growing source but without any change of the thermal electron density. Although the overall nonthermal electron energy (and number density) content was small in all the cases, the acceleration mechanism was fully operational, and powerful enough to produce a well-developed nonthermal power–law tails of the accelerated electron spectra, up to a few MeV, typical also for the impulsive flare phase. This implies that the key distinction between the ‘normal’ flare and the early flare phase is in remarkably different efficiency of forming a seed suprathermal electron population via their extraction from the thermal pool. As soon as this seed population is formed, it is efficiently transformed to a power–law nonthermal distribution by the main acceleration process. Stated another way, the processes of electron injection from the thermal pool and their further acceleration are driven by distinctly different physical processes. The former process seems to be responsible for the energy partition between the thermal and nonthermal components, in the way that the stronger the plasma heating the weaker the injection, and vice versa.
2. Instrumentation and observations
The events under study were observed by a number of radio instruments: The Nobeyama Radio Polarimeters (NoRP, Torii et al., 1979; Nakajima et al., 1985) record total and circularly polarized intensities (Stokes parameters I and V) at 1, 2, 3.75, 9.4, 17, 35, and 80 GHz (Stokes I only). We also used the Radio Solar Telescope Network (RSTN) data. One second temporal resolution data were taken at 8 selected frequencies (0.245, 0.41, 0.61, 1.415, 2.695, 4.995, 8.8, 15.4 GHz) from Learmonth station, Australia.


The Nobeyama Radioheliograph (NoRH, Nakajima et al., 1994) obtains images of the Sun at 17 GHz (Stokes I and V) and 34 GHz (Stokes I). The NoRH angular resolution is around 10 arcseconds at 17 GHz, and 6 arcseconds at 34 GHz. Siberian Solar Radio Telescope (SSRT; Smolkov et al., 1986; Grechnev et al., 2003) produces microwave images at 5.7 GHz. In some events we also used one-dimensional brightness distributions measured with NS and EW arms of the SSRT. To analyze the most recent event in our event list (2011 February 15) in greater detail, we take advantage of more complete microwave observations obtained from new instruments developed by the SSRT team: the spectropolarimeter recording the total power data at 2.3, 3.0, 4.0, 5.0, 6.0, 7.0 and 8.0 GHz (SP 2–9), and the 10-antenna prototype of the multifrequency heliograph (mSSRT) observing at 5.1, 5.5, 6.3, 6.9 and 7.6 GHz (Lesovoy et al., 2009; Lesovoi et al., 2012).
We also use magnetograms from the Michelson Doppler Imager (MDI, Scherrer et al., 1995), and EUV images from the Extreme-Ultraviolet Imaging Telescope (EIT, Delaboudinière et al., 1995) on SOHO; as well as X-ray data from the Ramaty High-Energy Solar Spectroscopic Imager (RHESSI, Lin & RHESSI Team, 2002) and Fermi Gamma-ray Space Telescope (Meegan et al., 2009).
Flares on 2003 November 13 (N01E80) and 2004 January 6 (N05E89). These two flares from the Battaglia et al. (2009) event list occurred during the SSRT observing time. The RHESSI corrected count rate light curves in 6–12 keV and 25–50 keV are shown in Figure 1. The early phase is marked by the dotted vertical lines (04:55:40–04:57:12 UT and 06:13–06:16 UT) and corresponds to the time interval of gradual increase of the 6–12 keV light curve before appearance of the 25-50 keV emission enhancement (see Figure 1 from Battaglia et al., 2009). The microwave light curves recorded with the NoRP, NoRH and the SSRT are also shown. Note that the microwave emission at frequencies below 10 GHz appeared well before the impulsive phase.

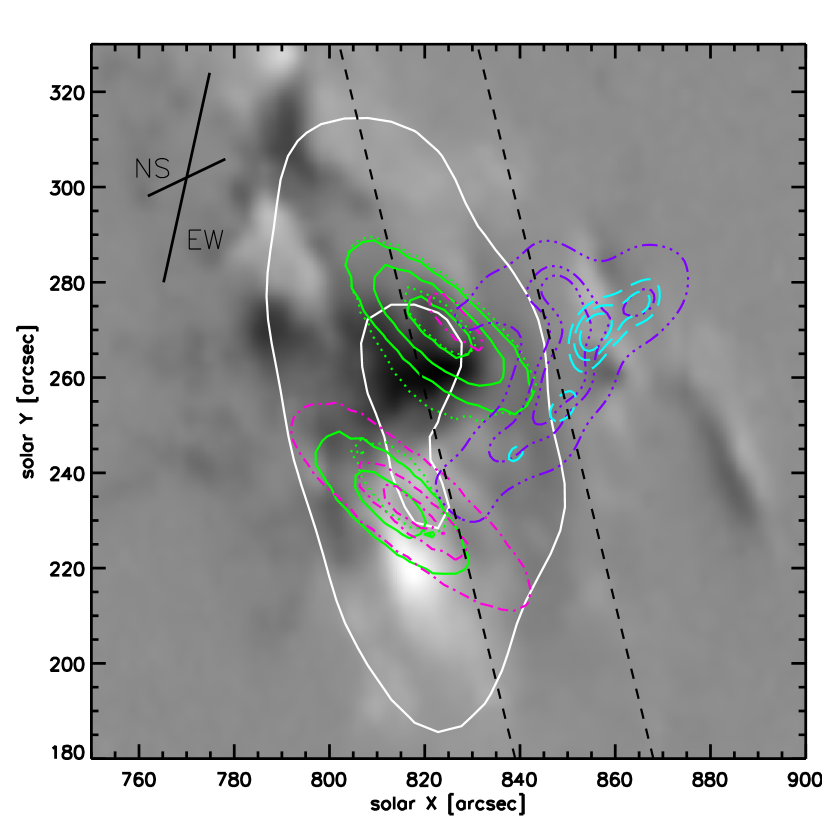
Images of the microwave sources at 5.7 GHz are shown in Figure 2 before the flare and at the early flare phase. Strong background microwave (presumably, gyroresonance) sources observed before the flares were situated close to the limb above AR 10537 and AR 10591, respectively (the dashed contours in Figure 2). The corresponding microwave sources at the end of the early phase (the solid contours obtained after the background subtraction) were located above the limb at distances exceeding the half widths of the SSRT beam. Battaglia et al. (2009) have studied the X-ray sources at this early phase in detail. Centroids of the X-ray loop top sources shown by the asterisks in Figure 2 are located clearly above the limb, implying the corresponding coronal loop top sources. The apparent sizes of the coronal microwave sources are larger than the corresponding X-ray sources because of relatively low spatial resolution of the SSRT, shown by the NS/EW crosses. The X-ray source volumes determined from the SXR imaging were cm3 and cm3 by the end of the early stage, when their apparent sizes were and , accordingly. During the early stage the source size remained roughly constant during 13 November early phase event, while the area of the 06 January source increased, roughly, by a factor of three. The emission measures and temperatures determined using the RHESSI observations were gradually growing up to cm-3 and 25 MK for 13 November event, and cm-3 and 35 MK for 06 January event.


The microwave spectra observed at the end of the early phase are shown in Figure 3. The turn-over frequencies in both spectra were below the SSRT operating frequency implying that SSRT observed in the optically thin part of the microwave spectrum; i.e., the optically thin radio emission was produced from a coronal, not the footpoint, part of the source. Thus, we can confidently conclude that the total power spectra obtained at other frequencies without spatial resolution pertain to coronal sources corresponding to the SSRT sources observed above the limb.
X4.8 Flare on 2002 July 23 (S13E72). The coronal X-ray source appeared at the initial stage of this flare. It is the first proposed example of the early phase sources (Krucker et al., 2008). The early phase (00:18 – 00:26 UT) continued until the HXR emission of the coronal source remained dominating. The X-ray observations at this phase were also analyzed by Lin et al. (2003), Holman et al. (2003), and Caspi & Lin (2010). The coronal source displayed a gradual increase in both SXR and HXR emission below 60 keV. The RHESSI signal at higher energies appeared after 00:26 UT only. Caspi & Lin (2010) have found three coronal electron populations: nonthermal, super–hot thermal, and hot thermal. Temperatures of the thermal electrons were determined at 00:20 UT and then were roughly constant and equal to 30 MK and 20 MK, respectively (see Figure 1 in Caspi & Lin, 2010). The plasma density of the hot component was estimated to be cm-3 (Fig.4.10 from Caspi, 2010). The HXR observations show that these plasma parameters did not change noticeably from 00:20 UT to 00:24 UT. However, the source volume was increasing from cm-3 up to cm-3 during this same time interval.

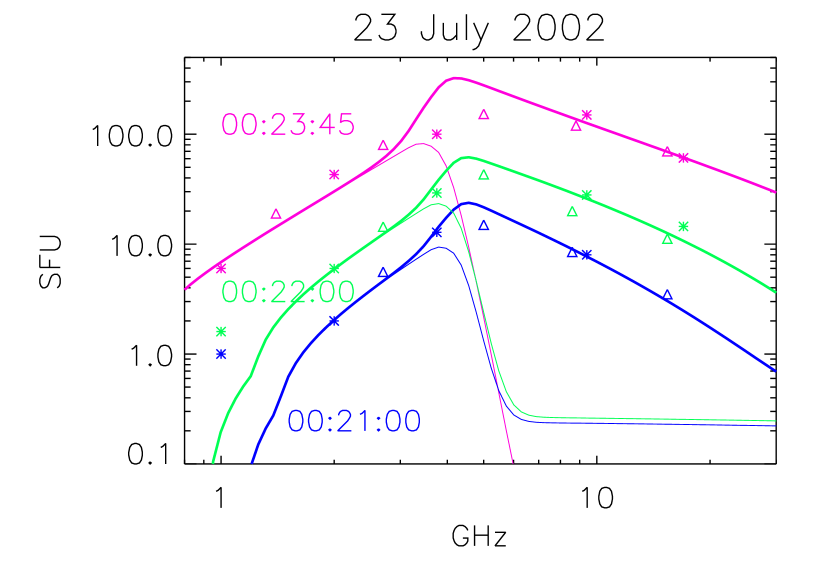
The microwave light curves (Figure 4) grew gradually during the early phase, and sharply afterward. The SSRT observations have began at the impulsive phase only, after 00:33 UT; although radio emission at frequencies up to 17 GHz appeared during the early phase. At the end of this phase the NoRP signal at 35 GHz appeared. A more sensitive Nobeyama Radioheliograph recorded the flare emission at 17 and 34 GHz well before that time. After the 34 GHz emission appearance at 00:22 UT the main microwave source was located slightly above the SXR flare loop (White et al., 2003; Asai et al., 2006, 2009). The footpoint emission also appeared and became essential after 00:22:30 UT (Asai et al., 2006). The spectrum evolution at the early phase is shown in Figure 5. Good correspondence between the NoRP and the RSTN data gives an idea on the measurement accuracy.
X7.1 Flare on 2005 January 20 (S06W90). Many studies were devoted to this extreme event, but they are mainly concerned the origin of accelerated protons, relativistic electrons, and the cosmic ray aspect (see, e.g., Grechnev et al., 2008). A gradual increase of SXR flux started at 06:00 UT, according to GOES-10 and GOES-12. At least half an hour before the flare maximum at 06:46 UT, RHESSI detected the blob at loop top111 http://svs.gsfc.nasa.gov/vis/a000000/a003100/a003162/..

The early phase lasted until 06:35:40 UT, where the temperature determined from GOES 10 data increases gradually from 7 to 13 MK without a noticeable increase of the emission measure (Figure 6). The HXR emission flux exceeds the background level at energies below 40 keV, where it can be fitted by a power–law with index 7.3 at 06:30 UT.
First signatures of the nonthermal electrons appeared in microwaves after 06:20 UT. The radio fluxes at 2 – 17 GHz were synchronously increasing during fifteen minutes and reached a level of 100 SFU at 3 – 5 GHz. The microwave profiles are similar to X-ray profiles at energies below 25 keV (see Figure 6b, bottom). The degree of polarization of the total power emission was 10–20% LCP and almost did not change during the early phase at frequencies above 3.75 GHz. At 2 GHz the degree of polarization reached 30% RCP at some time frames. The similarity of the microwave and X-ray light curves favors a common origin of radio– and X-ray-emitting electrons. Sequence of the RHESSI images in the 3 – 12 keV channels shows that the coronal source was located within the flare loop visible later in the impulsive stage (Figure 7), and it was purely coronal until 06:38 UT. The source volume was increasing during the first ten minutes of the early phase. Grechnev et al. (2008) have estimated the loop parameters determined from EIT/171A and GOES/SXI images at 06:42:20 UT. The loop height was cm, and width cm (volume cm3). Plasma density was estimated to be cm-3.

Microwave sources are shown in Figure 7 at the end of the NoRH observations (06:30 UT). The 17 GHz and 34 GHz emission sources are seen to originate at loop footpoints, located in the regions with opposite polarities of the photosphere magnetic field. A line-of-sight magnetic field of 1200 G (N–polarity) was measured in the South footpoint, while G (S polarity) in the North footpoint. At the early phase the flare emission at 5.7 GHz was relatively weak compared with the background gyroresonant emission, which does not favor its direct imaging. However, the coronal source can be revealed by subtracting the background one-dimensional intensity distribution (Figure 8). One-dimensional distributions were recorded in the direction perpendicular to the fans of the linear arrays every 0.3 sec. The dotted lines in Figure 7 show the directions of the EW/SSRT array fan.
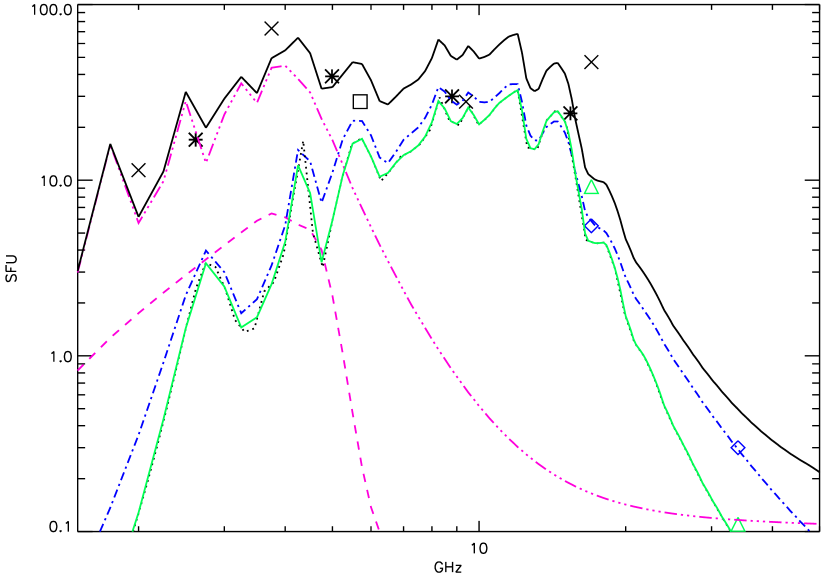
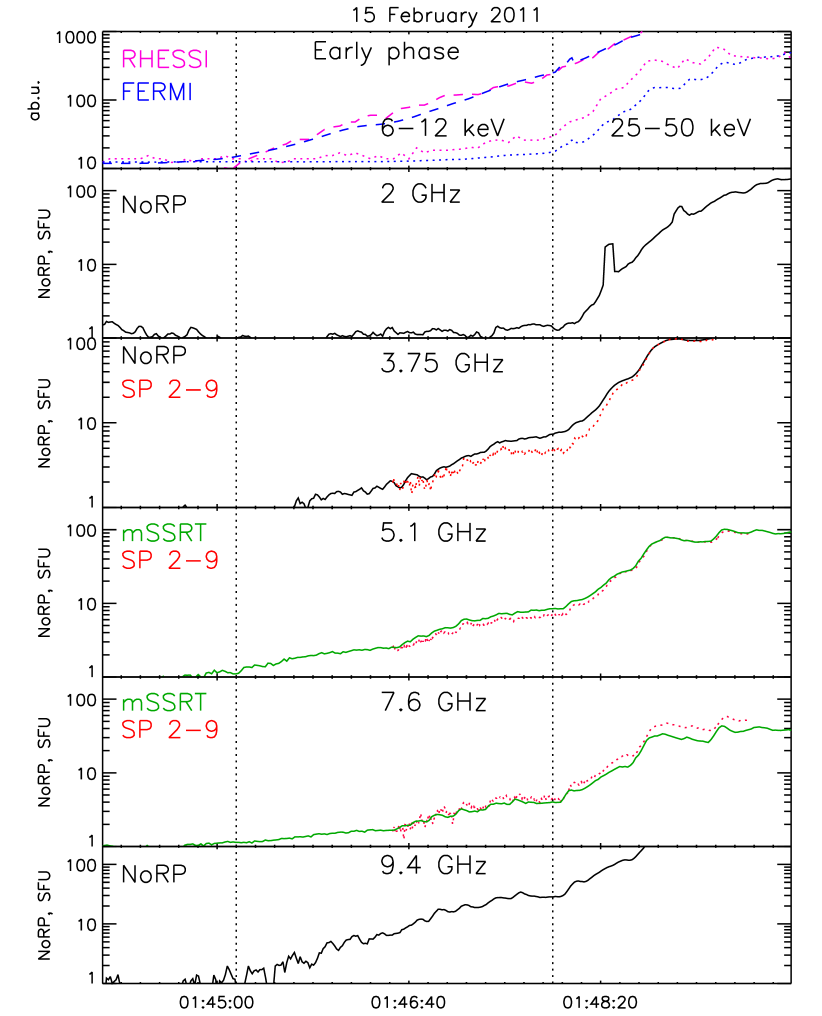
Figure 8 presents one-dimensional distributions of flare region before and during the brightening at 06:30 UT. The subtraction of the former from the latter reveals the early flare phase source. The flare source was displaced to the West from the brightness center of the background source, so its location is likely to correspond to the looptop region in Figure 8. The FWHM size of the source is about , while the flux level of 28 sfu is about the total flare flux at this frequency. The degree of polarization reached 20% RCP; the brightness center of the polarized emission was displaced by from the intensity brightness center to the North-West. Thus, the bulk of the 5.7 GHz flare emission was produced from the coronal source.
The microwave spectrum corresponding to the emission enhancement at 06:30 UT is shown in Figure 9. The data at frequencies 2, 3.75, 9.4 GHz were recorded with the Nobeyama spectropolarimeter, at frequencies 1.4, 2.65, 4.99, and 8.8 GHz with the Learmonth Solar Observatory (USAF RSTN Network) spectrometer. The SSRT flux at 5.7 GHz was determined from sequence of the one-dimensional EW distributions. It is reasonable to suppose that most of the emission below 6 GHz (see the radio spectrum in Figure 9) originates from the coronal source. The microwave fluxes at 17 and 34 GHz, dominated by the footpoint sources (see Figure 7) were obtained using the NoRH observations and are shown by triangles and diamonds in Figure 9. Assuming a power-law spectrum () at the range from 17 GHz to 34 GHz, we can estimate at the North footpoint, and at the South one.
X2.2 Flare on 2011 February 15 (N21W21). The flare on 2011 February 15 was the first X-class flare in the current solar activity cycle. Not surprisingly, it has already been analyzed in a number of papers. This flare occurred in AR 11158 in the central area of the solar disk. Given that the above study of the limb early flare phases have established that the main HXR ( 50 keV) and microwave emissions ( 10 GHz) originate from compact coronal sources, it is reasonable to adopt the same morphology for the disk flares as well.
For this flare analysis we take great advantage of new radio instruments developed by the SSRT team, and observing now at the SSRT site. In fact, the 2011 February 15 event is the first large flare recorded with these new SSRT instruments. The HXR and microwave profiles at the preflare phase are shown in Figure 10. Vertical lines bound an interval 01:45:10 – 01:47:55 UT. At the end of the early phase the estimates of plasma temperature and emission measure were 14 MK and cm-3 from the GOES 15 X-ray data, and 34 MK and cm-3 from the RHESSI data. The microwave emission was gradually rising during the early phase. Note that there is a good match between the light curves measured with different instruments. The emission at 17 GHz appeared during the early phase at 01:46:20 UT, while at 34 GHz even after this phase.
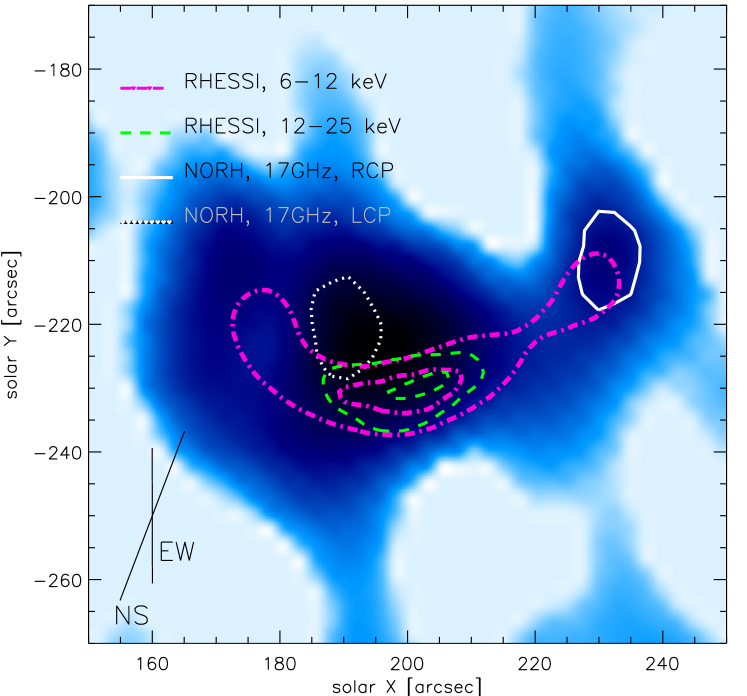
The flare spatial relationships at the end of the early phase are shown in Figure 11. There was a loop seen in the 6–12 keV emission and in the microwaves. Its footpoints were clearly marked up by the oppositely polarized sources at 17 GHz. The brightness center of the 12 – 25 keV HXR source located at the loop top. The mSSRT observations have shown, through a forward fit of the measured visibilities, that the 4 – 9 GHz sources located near the loop top as well and their sizes were about at the early phase.
The microwave spectrum recorded at the end of the early phase with various instruments is shown in Figure 12. There is a good correspondence between the different measurements, except some mismatch between the NoRH and RSTN fluxes at the frequencies above 15 GHz.
3. Microwave Spectrum Modeling
A coronal source (e.g., a magnetic flux tube) can be detected via microwave observations in a few distinct cases: (i) via the thermal free-free emission (absorption) in case of high plasma density (large EM); (ii) via the thermal gyroresonant/gyrosynchrotron emission (GS) in case of high magnetic field and significant plasma heating; and (iii) via various nonthermal emission processes, of which we only consider below the incoherent gyrosynchrotron emission mechanism.222Apparently, a combination of the mentioned mechanisms is also likely (see, e.g., Bastian et al., 2007). This means that having enhanced microwave emission does not necessarily imply that this emission is produced by a nonthermal electron population. In practice, the presence of the nonthermal component can be confirmed by microwave spectral modeling or forward fit, because the gyrosynchrotron spectra produced by thermal or nonthermal electrons are distinctly different. Given that the early flare phase manifests itself as purely thermal in X-ray range (Battaglia et al., 2009) we checked if the microwave spectrum can be consistently described as being produced by the thermal component alone, and found that this purely thermal model fails in all the cases. This implies that a nonthermal electron population is always present.

Therefore, it is reasonable to model the observed microwave spectra by gyrosynchrotron emission generated by electrons, with a so-called thermal/nonthermal distribution (TNT) proposed by Benka & Holman (1992). They demonstrated that the thermal plasma component can dominate the low-frequency optically thick part of the microwave spectrum. The TNT distribution
| (1) |
ensures a smooth transition from the thermal to nonthermal distribution at a matching energy . In the above expression, is the Maxwellian distribution function, and , to make the function continuous at the point . In what follows we refer a nonthermal component to as all particles between and .
In practice we employed fast gyrosynchrotron codes recently developed by Fleishman & Kuznetsov (2010), which, by default, account for the corresponding free-free contribution along with the GS one. Given that available data is limited we are forced to adopt a few simplifications for our spectral modeling. In particular, we adopt the isotropic electron distribution in all the cases, and uniform source model in most cases (unless a different is explicitly stated). Thus, there are overall nine free parameters for the spectral modeling: and , the temperature and the density of the background thermal plasma; matching energy , power-law index , the maximum nonthermal energy , the magnetic field strength , the source depth , and the area ; which characterize the emitting source, and the viewing angle relative to the magnetic field direction.
We start from two events from the Battaglia et al. (2009) list, whose morphology was studied in detail, so some guess parameters such as the source area , viewing angle, density and temperature of the background plasma can be taken from the X-ray observations (Battaglia et al., 2009). While the depths of the microwave sources were estimated as , uniform source model is expected to be valid for the compact looptop sources in these two flares. These input parameters obtained from the X-ray observations and used for the microwave modeling are given by underlined italic characters in Table 1.
A classical GS spectrum displays a main spectral peak formed by the GS self-absorption at a frequency determined by the condition , where is the frequency-dependent optical depth of the GS source and can also contain a number of secondary (harmonic) peaks at small integer multiples of the gyrofrequency (see, e.g., examples given in Figures by Benka & Holman, 1992; Fleishman & Kuznetsov, 2010, and references therein). The fast GS code is capable of reproducing the GS harmonic structure at relatively low frequencies; however, frequency gaps in the observations are too large to expect any reliable detection of the harmonic structure. In addition, the harmonic structure is expected to be smoothed out by a relatively modest non-uniformity of the coronal source. Thus, we employ a continuous version of the GS code (see Fleishman & Kuznetsov, 2010, for the code nomenclature definition), which ensures high overall accuracy, while smoothies out the low-frequency harmonic structure.
The results of the TNT fitting are shown by the thick curves in Figure 3, while the dashed curves show the calculated spectra for the corresponding purely thermal electron distribution. Remarkably, the best fit spectra for these two events are distinctly different from each other. Indeed, for the 13 November 2003 event, the thermal contribution is negligible even if we adopt a relatively high magnetic field, 300 G, (a corresponding model spectrum is shown in Figure 3, left, dashed curve). This is in fact larger than needed to fit the high-frequency optically thin part of the microwave spectrum. The entire spectrum can be nicely fit by a nonthermal GS emission, if we adopt the source magnetic field to be above 70 G. The number density of nonthermal electrons was calculated using power law index , for energies above , and it is much less than . Nonthermal energy content was relatively small also (). Note that the ratio of the plasma pressure to the magnetic pressure, commonly called the plasma , is about 0.2 for G.
In contrast, the thermal GS contribution (THM) entirely dominates the optically thick part of the microwave spectrum in the 06 January 2004 event; while the high-frequency optically thin part of the spectrum still has a clearly nonthermal origin. This thermal part of the GS spectrum is extremely conclusive in terms of the source parameter diagnostics. Indeed, in the optically thick regime, the brightness temperature of the thermal emission equals to the electron kinetic temperature . Thus, the total power flux level is fully defined by the product of the source area by the electron temperature, which immediately provides the effective source area , given that the electron temperature is independently known from the SXR spectrum. Given that the plasma temperature does not change much during the studied early flare phase, being within 20–30 MK, the optically thick flux density increase can only be attributed to the corresponding increase of the effective source area and thus, the source volume. The volume increase can, in principle, be provided by either the source size or volumetric filling factor increase, from which we favor the former option given that the SXR imaging (see the previous section) also reveals the SXR source size increase with time. In fact, the entire increase of the emission measure observed from the SXR data (Battaglia et al., 2009) is accounted by this volume increase, and so no additional hot material (e.g., from a chromospheric evaporation) is needed. Then, for the given source size, density, and temperature, the spectrum peak frequency is solely defined by the source magnetic field. This offers simple and reliable diagnostics of the coronal source magnetic field.
The 20 January 2005 event is somewhat different from the two events considered above, since its imaging data is inconsistent with the uniform coronal source model showing a strong footpoint contribution at high frequencies (17 and 34 GHz). This is in fact expected given relatively strong magnetic field values at the footpoints. Therefore, we explicitly consider three radio sources (one coronal and two footpoints), to roughly match the total power spectrum and also spatially resolved high-frequency data points.
We modeled these two footpoint sources separately to match the corresponding 17 GHz and 34 GHz spatially resolved data. Recall, the microwave spectral indices are strongly different at the different footpoints, i.e., and . The HXR footpoint spectral indices are also often different from each other, but the difference is typically within 0.6 (Saint-Hilaire et al., 2008). In contrast, the difference between the microwave indices is much larger, . A number of mechanisms has been proposed to account the HXR spectral index difference including anisotropic acceleration, different column densities in the opposite footpoints, differently nonuniform ionization, or effect of trapping due to magnetic mirroring in an asymmetric magnetic trap (see Saint-Hilaire et al., 2008, for greater detail). Of which only the trapping can have an effect on the microwave gyrosynchrotron spectrum. However, formation of a noticeably asymmetric flaring loop is unlikely in our case, because the magnetic fields at the opposite footpoints are comparable to each other in absolute value, being G and G, respectively. For the GS microwave spectrum from the footpoints, a much stronger effect on the spectrum slope is expected from the pitch-angle anisotropy of the fast electrons (Fleishman & Melnikov, 2003) having almost a pancake distribution at the mirror points. However, because we do not have a reliable ground to treat this anisotropy quatitatively, we assume the isotropic velocity distribution of fast electrons, and match the high-frequency data points with for the southern footpoint, while with for the northern footpoint.
Given the above note on the possible effect of the pitch-angle anisotropy, the found mismatch between and does not necessarily imply a real difference in the fast electron distributions over energy in the different footpoints, but can simply indicate inadequacy of the adopted assumption of the distribution isotropy, which is not too important for our study. However, this does imply that the fast electron energy spectrum can be harder than those derived from the footpoints, . Here, unlike other cases, we account the GS harmonic structure to give an idea of its possible role in the total spectrum formation. The thermal plasma contribution is negligible, since the fast electron number density is relatively large in this event. The input (underlined italic), and best-fit parameters are presented in Table 1.
Two other events display microwave spectra overall similar to that of the 06 January 2004 event, having thermal low-frequency parts and nonthermal high-frequency parts. In addition, we studied the spectrum evolution during the early stage of the 23 July 2002 event, and found that the thermal emission of an optically thick uniform source well fits low frequency part of the observed spectra until 00:23:45 UT. Note that the assumption of the source homogeneity becomes incorrect at the end of the early phase because of essential emission contribution from footpoints seen in 17 and 34 GHz images (Asai et al., 2009). Perhaps it calls for three dimensional simulations of the flaring loops (Kuznetsov et al., 2011).
The spectral modeling of the 23 July 2002 yields the source magnetic field around 200 G. Interestingly, the flare magnetic field was independently estimated from polarization of the optically thin free-free microwave emission (Asai et al., 2009) just before the flare. The degree of the circular polarization measured with NoRH at 17 GHz was about 1.6%. The degree of polarization is linearly proportional to the line of sight magnetic field component. Thus, being combined with the determined magnetic field value of 200 G, it yields an estimate of the viewing angle at the source to be , which is reasonable for a coronal source. From the RHESSI observations, Caspi (2010) and Caspi & Lin (2010) have concluded that a hot thermal plasma with temperature about 30 MK, and density cm-3, was present at the beginning of pre-impulsive phase in the corona. The parameters obtained from the microwave modeling for these events are given in Table 1. The estimates from X-ray observations are available after 00:22 UT (they are given in brackets in Table 1). The density and temperature estimates obtained from X-ray data agree well with those of the microwave spectrum modeling. The source area increase was detected in both X-ray and microwave domains, although the microwave source sizes were noticeably larger than the SXR source sizes. This is expected because the SXR emission is optically thin and so the SXR source size represents, in fact, a FWHM of the emission measure distribution, while the microwave source area relates to optically thick emission and so represents a full area of the source defined as a locus of all points corresponding to lines of sight with .
Finally, the spectrum shape of the 15 February 2011 event is similar to the 06 January 2004 and the 23 July 2002 events. Although, it has a noticeably higher spectrum peak frequency indicative of correspondingly larger magnetic field, G. For this event we used two input sets obtained, respectively, from the GOES and RHESSI (in brackets) data. Parameters resulted from the microwave spectral modeling are summarized in Table 1, including energy partition between the magnetic, thermal, and nonthermal energies.
4. Discussion
So far, the simultaneous primary heating and acceleration are rarely studied together. It has been implicitly assumed that one of these processes is entirely dominant over the other. For example, it is commonly believed that the particle acceleration is a dominating process in a flash flare stage. Let us discuss now what microwave data says about the early flare phase in addition to the commonly used X-ray data.
First of all, in all events under study there are nonthermal electrons that generate gyrosynchrotron emission at frequencies above the spectral peaks. In the case of power-law distribution of emitting electrons the best fit indices are in the range from 2.5 up to 4, with the high-energy cutoff above 1 MeV. The densities and energy contents of nonthermal components (i.e., above kev, see Table 1) were well below the thermal density and energy of the coronal sources. In two of the studied cases the emission of nonthermal electrons also dominates the observed spectra at frequencies below the spectrum peaks.
Secondly, we found that thermal GS emission dominates the low-frequency microwave spectra in many cases. This offers reliable diagnostics of the source area and magnetic field. The radio estimate of the coronal source area is highly important because it is unbiased by the plasma density distribution, which is unlike the SXR-derived source area. Based on the radio data we confidently conclude that the source area grows at the course of the flare This fully accounts for the observed increase of the SXR-derived emission measure, while no density increase is needed. This means that no essential chromospheric evaporation occurs in the analyzed cases, so no energy deposition to the chromosphere in the form of either precipitating electrons or heat conduction takes place.
Thirdly, even though the thermal plasma contribution to the microwave spectrum is often essential, no purely thermal stage has been detected. Indeed, radio signatures of the nonthermal particles appear as soon as the plasma heating. Thus, the RHESSI (or Fermi) non-detection of the nonthermal emission at the early flare phase is accounted by its relatively low sensitivity, while the microwave observations turn out to be more sensitive to small numbers of the nonthermal electrons. Note, that in some cases (e.g., when the source area is somewhat small, see the 13 November 2003 event as an example), the entire microwave spectrum is dominated by the nonthermal GS contribution.
The plasma beta is smaller than one, while the nonthermal energy density is much smaller than the thermal one in all the cases (i.e., ). Although the total energy content of the accelerated electrons is small, the available nonthermal electrons are high efficiently accelerated from slightly nonthermal to relativistic energies. Their spectra are hard, in most cases, and extended up to a few MeV. Stated another way, the shape of accelerated particle spectrum at the preflare phase is similar to that during flares, even though their levels (normalizations) are highly different. This can happen, for example, if the same, presumably stochastic, acceleration mechanism capable of accelerating the charged particles from somehow created “seed population” is involved at both preflare and flare phases. However, these seed populations must be formed differently in preflares or flares.
The observed significant plasma heating suggests that the corresponding flare energy is already available. However, it is divided highly unevenly between the plasma heating and nonthermal seed population creation. It works in a way similar to that in the presence of a DC electric field: at a preflare phase, a relatively large, but still essentially sub-Dreicer field, will heat the ambient plasma via the quasi-Joule dissipation (an enhanced, anomalous resistivity is needed to yield a significant plasma heating), while the fraction of the runaway electrons capable of forming the mentioned seed population, will remain relatively minor. For a larger DC electric field the fraction of the runaway electrons will grow quickly, resulting in a powerful nonthermal component needed to produce the impulsive flare phase.
Let us estimate what DC field is required to form the seed populations at the preflare phase. Adopting typical parameters, cm-3 and MK (see Table 1), the electron Dreicer field is about V/cm. The nonthermal to thermal electron number density ratio is about (see Table 1). To build this nonthermal component from the maxwellian tail, electrons with (where ) must runaway due to the DC electric field. Given that , we find V/cm. Over a typical source size of cm, an electron can gain about 1 keV of energy. This energy is far too small compared with the observed electron energies of 1 MeV or above. So this assumed DC field plays no role in forming the nonthermal power-law distribution responsible for nonthermal GS radiation. However, this keV of energy gain can be sufficient enough to form a slightly suprathermal seed population, from which the bulk (presumably stochastic) acceleration produces the observed nonthermal power-law tails up to relativistic energies.
Microwave observations, therefore, show that the energy release mechanism in the preflare phase is accompanied by particle acceleration. Although this acceleration is much milder than that in the impulsive phase, and therefore, is hard to detect in X-rays. The nonthermal emission produced by accelerated electrons with energy of several hundred keV to a few MeV appears as early as the soft X-ray emission. Thus the non-detection of the hard X-rays at that early stage of the flares seems to originate from a limited sensitivity of available X-ray instruments. The frequency of the spectrum peak is below 10 GHz for the early flare phase of microwave emission in all cases, because of a relatively small number of accelerated electrons at the radio sources. Microwave spectra show that magnetic field in the coronal sources are a few hundred gauss at the early phase. In some cases the number of accelerated electrons is so low that the gyrosynchrotron emission from thermal electrons dominates the low frequency part of the microwave spectrum. In these cases microwave spectrum shape provides the magnetic field estimate in the coronal sources. The microwave observations of such events are promising for studying the transitions from the gradual energy release to the flash flare explosives.
5. Conclusion
The described findings give rise to a number of fundamentally important conclusions about the flare heating and acceleration. (i) The flare energy release is capable of directly heating the thermal plasma, without noticeable in situ heating by fast electron beams or chromospheric evaporation driven by either electron beams or heat conduction. Since no energy transfer process is detected, we propose the early flare phase sources to represent the energy release and acceleration sites. (ii) The efficient acceleration process of only a minor fraction of the plasma electrons implies that the acceleration mechanism involved is not capable of accelerating electrons directly from the thermal pool, but requires a pre-extracted (injected) seed electron population. (iii) This implies that the electron injection from the thermal pool and their further acceleration toward higher energies are driven by physically distinct processes. The first of them is inefficient or somehow suppressed during the early flare phase, while the second is already fully operational. In particular, the acceleration by cascading turbulence alone seems to be insufficient here. Since in the corresponding acceleration model both injection and acceleration are driven by the same turbulence intensity, so having inefficient injection while efficient acceleration looks at odds to this acceleration model. (iv) The observed significant plasma heating suggests that the corresponding flare energy is already available. However, it is divided highly unevenly between the plasma heating and nonthermal population creation. We propose, this is due to yet unspecified energy partition process operating in a way showing some resemblance to that controlling the balance between Joule heating, and runaway electrons in a DC electric field. We emphasize, that in addition to this energy partitioning process, some sort of stochastic acceleration capable of producing the observed power-law electron spectra is still needed during both early and impulsive flare phases.
References
- Altyntsev et al. (1999) Altyntsev, A. T., Grechnev, V. V., Nakajima, H., Fujiki, K., Nishio, M., & Prosovetsky, D. V. 1999, A&AS, 135, 415
- Asai et al. (2006) Asai, A., Nakajima, H., Shimojo, M., White, S. M., Hudson, H. S., & Lin, R. P. 2006, PASJ, 58, L1
- Asai et al. (2009) Asai, A., Nakajima, H., Shimojo, M., Yokoyama, T., Masuda, S., & Krucker, S. 2009, ApJ, 695, 1623
- Bastian et al. (2007) Bastian, T. S., Fleishman, G. D., & Gary, D. E. 2007, ApJ, 666, 1256
- Battaglia et al. (2009) Battaglia, M., Fletcher, L., & Benz, A. O. 2009, A&A, 498, 891
- Benka & Holman (1992) Benka, S. G., & Holman, G. D. 1992, ApJ, 391, 854
- Caspi (2010) Caspi, A. 2010, PhD thesis, Department of Physics, University of California, Berkeley, CA 94720-7450, USA
- Caspi & Lin (2010) Caspi, A., & Lin, R. P. 2010, ApJ, 725, L161
- Delaboudinière et al. (1995) Delaboudinière, J.-P., et al. 1995, Sol. Phys., 162, 291
- Fárník & Savy (1998) Fárník, F., & Savy, S. K. 1998, Sol. Phys., 183, 339
- Fleishman et al. (2011) Fleishman, G. D., Kontar, E. P., Nita, G. M., & Gary, D. E. 2011, ApJ, 731, L19
- Fleishman & Kuznetsov (2010) Fleishman, G. D., & Kuznetsov, A. A. 2010, ApJ, 721, 1127
- Fleishman & Melnikov (2003) Fleishman, G. D., & Melnikov, V. F. 2003, ApJ, 587, 823
- Grechnev et al. (2003) Grechnev, V. V., et al. 2003, Sol. Phys., 216, 239
- Grechnev et al. (2008) —. 2008, Sol. Phys., 252, 149
- Harra et al. (2001) Harra, L. K., Matthews, S. A., & Culhane, J. L. 2001, ApJ, 549, L245
- Holman et al. (2003) Holman, G. D., Sui, L., Schwartz, R. A., & Emslie, A. G. 2003, ApJ, 595, L97
- Krucker et al. (2010) Krucker, S., Hudson, H. S., Glesener, L., White, S. M., Masuda, S., Wuelser, J.-P., & Lin, R. P. 2010, ApJ, 714, 1108
- Krucker et al. (2008) Krucker, S., et al. 2008, A&A Rev., 16, 155
- Kuznetsov et al. (2011) Kuznetsov, A. A., Nita, G. M., & Fleishman, G. D. 2011, ApJ, 742, 87
- Lesovoi et al. (2012) Lesovoi, S. V., Altyntsev, A. T., Ivanov, E. F., & Gubin, A. V. 2012, Sol. Phys.
- Lesovoy et al. (2009) Lesovoy, S. V., Altyntsev, A. T., Zandanov, V. G., Ivanov, E. F., Gubin, A. V., & Maslov, A. I. 2009, Geomagnetism and Aeronomy/Geomagnetizm i Aeronomiia, 49, 1125
- Lin & RHESSI Team (2002) Lin, R. P., & RHESSI Team. 2002, Sol. Phys., 210, 3
- Lin et al. (2003) Lin, R. P., et al. 2003, ApJ, 595, L69
- Liu & Fletcher (2009) Liu, S., & Fletcher, L. 2009, ApJ, 701, L34
- Masuda et al. (1995) Masuda, S., Kosugi, T., Hara, H., Sakao, T., Shibata, K., & Tsuneta, S. 1995, PASJ, 47, 677
- Meegan et al. (2009) Meegan, C., et al. 2009, ApJ, 702, 791
- Nakajima et al. (1985) Nakajima, H., Sekiguchi, H., Sawa, M., Kai, K., & Kawashima, S. 1985, PASJ, 37, 163
- Nakajima et al. (1994) Nakajima, H., et al. 1994, IEEE Proceedings, 82, 705
- Petrosian & Liu (2004) Petrosian, V., & Liu, S. 2004, ApJ, 610, 550
- Saint-Hilaire et al. (2008) Saint-Hilaire, P., Krucker, S., & Lin, R. P. 2008, Sol. Phys., 250, 53
- Scherrer et al. (1995) Scherrer, P. H., et al. 1995, Sol. Phys., 162, 129
- Siarkowski et al. (2009) Siarkowski, M., Falewicz, R., & Rudawy, P. 2009, ApJ, 705, L143
- Smolkov et al. (1986) Smolkov, G. I., Pistolkors, A. A., Treskov, T. A., Krissinel, B. B., & Putilov, V. A. 1986, Ap&SS, 119, 1
- Torii et al. (1979) Torii, C., Tsukiji, Y., Kobayashi, S., Yoshimi, N., Tanaka, H., & Enome, S. 1979, Nagoya University, Research Institute of Atmospherics, Proceedings, vol. 26, Mar. 1979, p. 129-132., 26, 129
- Veronig et al. (2006) Veronig, A. M., Karlický, M., Vršnak, B., Temmer, M., Magdalenić, J., Dennis, B. R., Otruba, W., & Pötzi, W. 2006, A&A, 446, 675
- Wang et al. (1995) Wang, H., Gary, D. E., Zirin, H., Kosugi, T., Schwartz, R. A., & Linford, G. 1995, ApJ, 444, L115
- White et al. (2003) White, S. M., Krucker, S., Shibasaki, K., Yokoyama, T., Shimojo, M., & Kundu, M. R. 2003, ApJ, 595, L111
- White et al. (2011) White, S. M., et al. 2011, Space Sci. Rev., 159, 225
- Xu et al. (2008) Xu, Y., Emslie, A. G., & Hurford, G. J. 2008, ApJ, 673, 576
| Parameters | 13-Nov-03 | 06-Jan-04 | 23-Jul-02 | 20-Jan-05 | 15-Feb-11 | ||
| Time | 04:57:12 | 06:16 | 00:21:00 | 00:22:00 | 00:23:45 | 06:30 | 01:47:55 |
| A, cm2 | 0.63 | 2.6 | 1.6 | 4.0(0.64) | 16.0(0.95) | 5.6(3.9) | 2.1 |
| T, MK | 25 | 35 | 32 | 32 | 32 | 18(13) | 14(34) |
| cm-3 | 0.6 | 0.2 | 1.5 | 1.0(1.7) | 0.2(1.7) | 0.5(1) | 2.0(0.3) |
| , keV | 15 | 27 | 27.6 | 29.2 | 26.9 | 4.0 | 12.1(15.1) |
| B, G | 70 | 120 | 200 | 200 | 200 | 250 | 500 |
| , cm-3 | 6.5 | 0.33 | 1.7 | 0.9 | 0.3 | 22 | 1.2(0.6) |
| 2.5 | 2.9 | 3.0 | 2.5 | 2.5 | 4 | 3.0 | |
| 2 | 0.3 | 0.2 | 0.3 | 0.62 | 1.5 | 0.1(0.3) | |
| 0.2 | 0.03 | 0.08 | 0.06 | 0.01 | 0.01 | 0.008(0.003) | |