Flavor decomposition of the nucleon electromagnetic form factors
Abstract
Background: The spatial distribution of charge and magnetization in the proton and neutron are encoded in the nucleon electromagnetic form factors. The form factors are all approximated by a simple dipole function, normalized to the charge or magnetic moment of the nucleon. The differences between the proton and neutron form factors and the deviation of from zero are sensitive to the difference between up- and down-quark contributions to the form factors.
Purpose: Recent measurements of up to 3.4 (GeV/c)2 allow for a much more detailed examination of the form factors. The flavor-separated form factors provide information on the quark flavor dependence of the nucleon structure and test theoretical models of the form factors.
Methods: We combine recent measurements of the neutron form factors with updated extractions of the proton form factors, accounting for two-photon exchange corrections and including an estimate of the uncertainties for all of the form factors to obtain a complete set of measurements up to (GeV/c)2. We use this to extract the up- and down-quark contributions which we compare to recent fits and calculations.
Results: We find a large differences between the up- and down-quark contributions to and , implying significant flavor dependence in the charge and magnetization distributions. The rapid falloff of the ratio does not appear in the individual quark form factors, but arises from a cancellation between the up- and down-quark contributions. We see indications that the down-quark contributions to the Dirac and Pauli form factors deviate from the suggested 1/ scaling behavior suggested by a previous analysis. While recent models provide a generally good qualitative description of the data, the down-quark contribution to and are not reproduced by any of the models. Finally, we note that while the inclusion of recent data from CLAS modifies the high- slightly, the tension between these data and previous measurements at lower has a more significant impact, suggesting the need for additional data in this region.
pacs:
25.30.Bf, 13.40.Gp, 14.20.DhI Introduction
The nucleon electromagnetic form factors provide information on the spatial distributions of charge and magnetization of the nucleon Sachs (1962), corresponding to a Fourier transform of the nucleon’s charge or magnetization density in a non-relativistic picture. As such, the form factors provide some of the most direct constraints on the partonic structure of the nucleon. The form factors are functions only of the four-momentum transfer squared, , and can also be expressed in terms of the Dirac, , and Pauli, , form factors, which are related to the electric and magnetic form factors:
| (1) |
where and is the mass of the nucleon. In the limit , and become the charge and magnetic moment of the nucleon, while and yield the charge and anomalous magnetic moment.
It has long been known that , , and approximately follow the dipole form, with (GeV/c)2, up to =5-10 (GeV/c)2, while the neutron electric form factor, , is close to zero. This observation is consistent with the simple, non-relativistic interpretation in which the charge and magnetization of the nucleon is carried by the quarks, and the up and the down quark have similar spatial distributions. This yields identical contributions for all form factors except for , for which there is a nearly complete cancellation between the up- and down-quark charge distributions. As such, measurements of played an important role, demonstrating that there is a measurable difference between the up- and down-quark distributions. This is qualitatively consistent with the pion cloud picture of the neutron, where a positive core and negative cloud arise from a virtual p+ component of the neutron structure Fermi and Marshall (1947); Rosenbluth (1950); Friedrich and Walcher (2003); Crawford et al. (2010); Gentile and Crawford (2011).
Details of the recent progress in measurements of the nucleon electromagnetic form factors can be found in recent global analyses and reviews Arrington et al. (2007a); Venkat et al. (2011); Arrington et al. (2007b); Perdrisat et al. (2007); Arrington et al. (2011a); Cates et al. (2011). Several of these new measurements demonstrate the limitations of the simple, nonrelativistic picture. The decrease of the ratio with , as observed in polarization measurements Punjabi et al. (2005); Gayou et al. (2001); A. J. R. Puckett et al. (2012, 2010), provided a clear demonstration that the form factors were not simply the sum of dipole-like contributions from the up and down quarks. While these results were inconsistent Arrington (2003, 2004a); Qattan et al. (2005) with earlier extractions based on Rosenbluth separation techniques Rosenbluth (1950), this is now widely believed to be the result of small two-photon exchange (TPE) corrections which yield a small angular dependence to the cross section Carlson and Vanderhaeghen (2007); Arrington et al. (2011b), mimicking the small signal expected from the contribution of at high . More recent measurements of the neutron form factors Lachniet et al. (2009); Riordan et al. (2010) have provided a complete set of data up to =3.4 (GeV/c)2, which has enabled a detailed comparison of the up- and down-quark contribution from the high- measurements, as well as a detailed comparison of the proton and neutron magnetic form factors.
Assuming isospin and charge symmetry and neglecting the contribution of strange quarks allows us to express the nucleon form factors in terms of the up- and down-quark contributions Miller et al. (1990); Beck and McKeown (2001),
| (2) |
This yields the following expression for the up- and down-quark contributions to the proton form factors:
| (3) |
with similar expressions for and . In this convention, represents the up-quark distribution in the proton and the down-quark distribution in the neutron. Because the charge is factored out from the up- and down-quark contributions, the values for these form factors are , , while the quark magnetic moments are taken to be the limit of the magnetic form factors: and . Note that the up- and down-quark contributions as defined here are the combined quark and antiquark contributions, and so represent the difference between the quark and antiquark distributions, due to the charge weighting of the quark and antiquark contributions to the form factors.
II Form factor input and two-photon exchange corrections
Recently, the ratio of the neutron was measured at Jefferson Lab up to 3.4 (GeV/c)2 Riordan et al. (2010). These data, combined with measurements in the same range Punjabi et al. (2005); Gayou et al. (2001); A. J. R. Puckett et al. (2012) allowed for the first time a comparison of the behavior of and , as well as a separation of the up- and down-quark contributions to the form factors. In the pioneering work of Cates et al. (2011), which will be referred to as “CJRW” throughout this text, measurements of for (GeV/c)2 were combined with parameterizations of , , and Kelly (2004) to examine the flavor-separated contributions and the ratio
| (4) |
In the CJRW analysis, only the uncertainty from was included in the analysis, as this was the largest source of uncertainty in the quantities they examined. Thus, the results of the CJRW analysis for any quantities which did not depend on as shown here will simply reflect the parameterizations of the other form factors and have no associated uncertainties.
Refs. Riordan et al. (2010); Cates et al. (2011) provided the first results for flavor-separated form factors at high values, and demonstrated a significant difference between the up- and down-quark contributions. We expand on their analysis mainly be accounting for two effects that were not included in their initial result. First, we include uncertainties associated with all of the form factors, as they are an important contribution for some of the extracted quantities. In addition, the proton form factor parameterization Kelly (2004) used in their analysis did not apply any two-photon exchange corrections, although data was selected with an eye towards reducing the impact of TPE corrections. We address this by using an extraction of the proton form factors which includes TPE corrections.
For , the CJRW results also used the parameterization of Kelly Kelly (2004). However, recent data from the CLAS collaboration Lachniet et al. (2009) shows smaller deviations from the dipole form at high , and thus will have a small impact on the high- behavior of the up- and down-quark contributions to the magnetic form factor. We use an updated parameterization to world’s data Lung et al. (1993); Anklin et al. (1994, 1998); Kubon et al. (2002); Anderson et al. (2007); Lachniet et al. (2009) using the same form as Kelly, but obtaining modified parameters: , , , and . We take the uncertainty to be the same as in the original Kelly fit, using the full error correlation matrix Plaster . This error band is fairly consistent with the experimental uncertainties with the new CLAS data included, as the simple functional form yielded a very small uncertainty in the Kelly analysis for regions where there were limited data. The updated fit yields a small modification to the high- behavior of , but also reduces the value of for values near 1–1.5 (GeV/c)2. The updated parameterization falls in between the earlier data below 1 (GeV/c)2 Anklin et al. (1998); Kubon et al. (2002) and the new CLAS data above (GeV/c)2 Lachniet et al. (2009). Where the updated fit has a significant impact, we will compare the results obtained using the Kelly fit and our updated parameterization.
For the neutron electric form factor, we take the fit to from Riordan et al. Riordan et al. (2010). Taking the full error correlation matrix for and Riordan yields uncertainties on that are significantly smaller than the uncertainties on the individual measurements, due to the simple functional form of the parameterization. To account for this, we scale up the uncertainty on by a factor of two to provide more realistic uncertainties in the flavor-separated results. Thus, any quantities which do not depend on the proton form factors (e.g. the up- and down-quark contributions to the magnetic form factor) will simply reflect the above parameterizations. This is similar to the CJRW analysis for quantities which do not include the measurements, although we include a realistic estimate of the uncertainties in the parameterized form factors, while their results that do not depend on will not show any uncertainty.
The leading TPE effect on the electron-proton elastic scattering cross section, , comes from the interference of the one- and two-photon exchange amplitudes which yield a small correction to both the cross section and recoil polarization measurements. The angular dependence of this correction to the cross section can include a much larger effect on the extracted form factors Guichon and Vanderhaeghen (2003), while the recoil polarization data do not have a similar amplification of the effect. Recent measurements of the angular dependence of also suggest small TPE contributions to the polarization measurements Meziane et al. (2011). To account for the TPE contribution to , one can add an additional term which forces the Rosenbluth extraction to yield the same value of as the polarization transfer data. We account for TPE effects by using the extraction of and from an analysis which constrains the TPE corrections based on the discrepancy between Rosenbluth and polarization measurements Qattan et al. (2011). We use the form factors extracted based on the TPE parametrization from Borisyuk and Kobushkin (BK parametrization) Borisyuk and Kobushkin (2011), which takes the corrections to be linear Tvaskis et al. (2006) in the virtual photon polarization parameter, , and constrains the correction to vanish in the limit of small angle scattering, as expected from charge conjugation and crossing symmetry Chen et al. (2007); Arrington et al. (2011b), and as observed in comparisons of positron-electron scattering Arrington (2004b).
In this analysis, we take the extraction of and from Ref. Qattan et al. (2011) for several electron-proton scattering measurements Andivahis et al. (1994); Walker et al. (1994); Christy et al. (2004); Qattan et al. (2005); Bartel et al. (1973); Litt et al. (1970); Berger et al. (1971), and add data at lower from Ref. Janssens et al. (1966) analyzed following the same procedure. This provides values of and ,with TPE corrections constrained by polarization transfer data. In the analysis of Ref. Qattan et al. (2011), no uncertainty is applied for the parameterization of . For our analysis, we include an additional uncertainty of ( in (GeV/c)2) in the polarization ratio .
This approach to constraining TPE is not expected to be as reliable at low values, as the difference between the two techniques is significantly smaller in this region, and because the parameterization of from polarization data included very little low- data. However, recent low- measurements Crawford et al. (2007); Ron et al. (2007); Zhan et al. (2011); Ron et al. (2011) suggest that the parameterization is relatively reliable for the range of data examined here, and the agreement between these polarization measurements and new Rosenbluth separation data Bernauer et al. (2010) support the idea that the corrections are relatively small. Thus, the final result should be somewhat insensitive to the exact details of the extraction of the TPE effects in this region. Because the TPE corrections are still important in the limit of low Arrington et al. (2011b); Blunden and Sick (2005); Bernauer et al. (2011); Arrington (2011), we compare our results to an extraction of the flavor-separated form factors using the proton form factor parameterization from Refs. Arrington et al. (2007a) and Venkat et al. (2011). Both of these extractions include TPE corrections calculated in a hadronic framework Blunden et al. (2003, 2005) which is expected to be more reliable at low values of , and is in good agreement with other low calculations Borisyuk and Kobushkin (2006, 2007, 2008, 2012) (as shown in Ref. Arrington (2012)). Comparison to these fit allows for a check of our low- phenomenological TPE extraction. The fit of Venkat et al. Venkat et al. (2011) also includes additional polarization data, in particular at low values Crawford et al. (2007); Ron et al. (2007); Zhan et al. (2011); Ron et al. (2011), and includes a more careful evaluation of the low- behavior of the fit.
Note that a more complete flavor separation at the lowest values would involve an updated extraction of the form factors, including calculated TPE corrections and the most recent form factor data Crawford et al. (2007); Ron et al. (2007); Zhan et al. (2011); Ron et al. (2011); Bernauer et al. (2010), along with constraints on strange-quark contributions taking measurements of elastic parity-violating electron scattering Spayde et al. (2004); Maas et al. (2004); Aniol et al. (2004); Maas et al. (2005); Armstrong et al. (2005); Young et al. (2006); Acha et al. (2007); Liu et al. (2007); Pate et al. (2008); Wang et al. (2009); Androic et al. (2010); Paschke et al. (2011); Ahmed et al. (2012); Armstrong and McKeown (2012). For this work, the primary focus is at somewhat higher data, and the comparison of our TPE corrections Qattan et al. (2011) to the hadronic corrections Blunden et al. (2005) applied in the recent proton fits Arrington et al. (2007a); Venkat et al. (2011) should provide an idea of the robustness of the low results.
III Recent Theoretical Predictions
In this section we summarize several recent theoretical studies of the nucleon elastic form factors which we will compare to our extracted flavor-separated form factors.
Cloët et al. Cloet et al. (2009) presented a calculation of a dressed-quark core contribution to the nucleon electromagnetic form factors defined by the solution of a Pioncaré covariant Faddeev equation. This calculation includes dressed-quark anomalous magnetic moment within the framework of Dyson-Schwinger equations (DSEs). The Faddeev equation was described by specifying that quarks are dressed, and two of the three dressed quarks are always correlated as color-3̄ diquarks. The nucleon is represented by a Faddeev amplitude of the form with obtained from by a cyclic permutation with expressed as sum of scalar- and axial-vector-diquark correlations with being the momentum, spin, and isospin labels of the quarks. The Faddeev equation satisfied by was constructed by specifying the dressed-quark propagator, diquark Bethe-Salpeter amplitudes, and the diquark propagators. The nucleon-photon vertex was calculated using six diagrams, with photon coupling to the quark or the diquark along with loop and exchange terms. In this approach, the Faddeev equation has only two new parameters in the nucleon sector: the masses of the scalar and axial-vector diquarks. The scalar mass is set by requiring a nucleon mass 1.18 GeV, and the axial-vector mass is chosen so as 1.33 GeV. The proton has a mass larger than the physical value to allow for additional contributions from the pseudoscalar mesons. The quark, diquark, and exchange (two body) contributions to the nucleons form factors were calculated up to =12 (GeV/c)2. In addition, the decomposition according to diquark spin and flavor contributions were also calculated for the same range. The DSE approach aims to simultaneously describe meson and baryon physics Roberts et al. (2007) with only a few parameters, most of which are fixed to static properties of the pion. This calculation will be referred to as “DSE” throughout this text. Because the calculation does not include pion cloud contributions, the masses and magnetic moments are not expected to reproduce the physical values. In Ref. Cloet et al. (2009), comparisons to data were made in terms of . In our analysis, we evaluate their parameterization in terms of using the physical nucleon mass, and the experimental magnetic moments of the proton and neutron. Rescaling to the physics magnetic moments removes the discrepancies at , although to the extent that the calculation leaves room for additional pion contributions, more important at low , this would be expected to worsen the agreement at larger values.
Cloët and Miller Cloet and Miller (2012) proposed a relativistic constituent quark model which is constrained by the nucleon form factors but also reproduces the quark spin content of the nucleon. This is an extension of a previous light-front calculation which included three constituent quarks Frank et al. (1996) and predicted the falloff of . In this model, it is assumed that the quarks are moving in a cloud of pions. The valance quarks are represented by quark-diquark combination and treated in a way consistent with Pioncaré invariance. Due to the long range nature of the quarks’ interactions as mediated by a single pion exchange, a pion emitted by a nucleon can also be absorbed by the same nucleon, allowing for a pion cloud contribution. The light-front wave function that describes the interaction of a quark and diquark to form a nucleon is used to construct the Fock state needed to represent the nucleon. The quark-diquark approximation includes both scalar and axial-vector correlations, and the flavor couplings were added to obtain a symmetric spin-flavor wavefunction. The pion component is introduced using a single pion loop around the bare nucleon, including diagrams with the photon coupling to the bare nucleon and coupling to the nucleon or pion in the pion loop. Terms involving couplings and the effects of intermediate were not included. The model is finally expressed in terms of ten parameters, representing the quark and diquark masses and contributions to the light-front wave function and a parameter describing the high-momentum behavior of the pion-nucleon vertex function. The parameters were adjusted to provide the best fit to the nucleon form factors Kelly (2004) up to (GeV/c)2. The model also yields a quark contribution to the proton spin which is found to be in agreement with experimental evaluations. This calculation will be referred to as pion-cloud relativistic constituent quark model, “PC-RCQM”.
Gonzalez-Hernandez et al. Gonzalez-Hernandez et al. (2012) provided an interpretation of the flavor dependence of the nucleon form factors in terms of Generalized Parton Distributions (GPDs). They incorporated the Regge contribution into GPDs that already apply diquark models by introducing a spectral distribution for the spectator diquark mass . Inclusion of the Regge contributions is crucial to obtain the correct normalized structure functions. The model can be summarized in the expression where the flavor dependence of the nucleon form factors was attributed mainly to Reggeon exchange contributions and handbag (quark-diquark) contribution. The diquark contribution was later represented by the two functions and and the proton-quark-diquark vertex was parameterized using a dipole type coupling with two fit parameters and . The final fit to DIS structure functions, nucleon form factors, and deep virtual Compton scattering were performed, one without the new CJRW extractions Cates et al. (2011), and one including these results to produce improved constraints on the flavor dependence of the GPDs. The flavor separated nucleon form factors, separated into Regge and diquark contributions, were calculated up to =5 (GeV/c)2. For , the diquark contribution dominates the Regge contribution at low and both contributions become comparable at high . On the other hand, the diquark and Regge contributions are comparable for and the Regge contribution dominates and , in particular at high . This calculation will be referred to as “GPD” throughout this text.
Recently, Rohrmoser et al. Rohrmoser et al. (2011) analyzed the flavor decomposition of the nucleon electromagnetic form factors within the framework of a relativistic constituent quark model whose hyperfine interaction is derived from Goldstone-boson exchange Glozman et al. (1998) as a result of spontaneous breaking of chiral symmetry in low-energy QCD. In this model, nucleons are represented by three-quark-configuration driven by an interaction Lagrangian formed by coupling of Goldstone bosons with valance-quark field. The nucleon wavefunction has no diquark configuration or mesonic effects and contains non-vanishing orbital angular momenta and mixed-symmetric spatial wave-function component with relatively small non-symmetric contribution. The key ingredient of the nucleon wave functions is the interaction of the mass operator, which has a linear confinement, with the QCD string tension and chiral symmetry breaking hyperfine interaction. We show here the latest theoretical results Plessas and not the originally published Rohrmoser et al. (2011) and note that the two results differ slightly. The form factors and their flavor decomposition were calculated up to =4 (GeV/c)2. Throughout this text this calculation will be referred to as “GBE-RCQM”.
Note that the GBE-RCQM and DSE calculations are predictions for the flavor-separated form factors, as they do not adjust parameters to match the proton or neutron form factors, while the PC-RCQM and GPD curves are fits to the data using parameterizations based on the model. The PC-RCQM model has a total of 10 parameters, while the GPD fit has 16 parameters for each of the GPDs, which are fit to reproduce both the form factors and parton distributions, with additional constraints from lattice QCD. Thus, one expects these models to better reproduce the data, although this does not represent as conclusive of a test as it does for the DSE and GBE-RCQM predictions. The models which are adjusted to reproduce the form factor data must also be compared to other measurements, as mentioned above and discussed in more detail in the original works Cloet and Miller (2012); Gonzalez-Hernandez et al. (2012).
IV Results and Discussion
In this section, we present the flavor-separated results for the proton and neutron form factors. We compare the results to the CJRW extraction and to extractions based on the recent proton parameterizations from Venkat et al. Venkat et al. (2011) (“VAMZ”), and from Arrington et al. Arrington et al. (2007a) (“AMT”), combined with our updated fit to and the Riordan et al. Riordan et al. (2010) parametrization of . Note that these are not independent extractions; they are all based on fits to relatively up-to-date sets of form factor measurements. The comparison to the CJRW result allows us to examine the impact of the TPE corrections to the proton form factors, as well as the uncertainties in the extraction of , , and , which were neglected in the CJRW analysis. The comparisons to the AMT and VAMZ fits provide sensitivity to the TPE corrections at low , as discussed in the previous section, as well as the impact of recent polarization transfer data Zhan et al. (2011); Ron et al. (2011), which are only included in the VAMZ result. We also examine the impact of the updated fit to by showing a version of the VAMZ extraction which uses the Kelly Kelly (2004) parameterization for (“VAMZ-Kelly”). Of particular importance is the impact near (GeV/c)2, where a tension between the CLAS data and previous measurements yields a noticeable shift in , but it is not clear which data is most correct in this region. Finally, we compare the results to a set of recent nucleon form factor models, described in Sec. III.
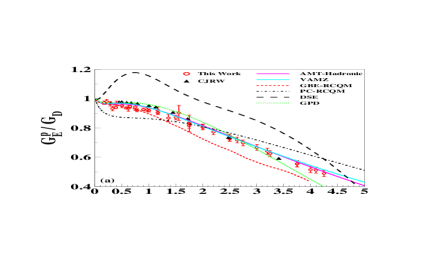
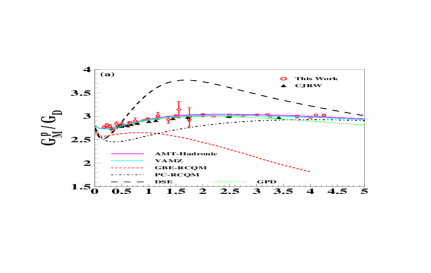
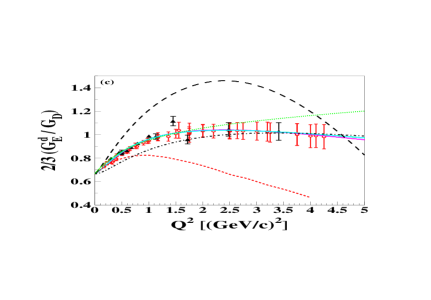
Figures 1 and 2 show the proton Sachs form factors and their contributions from up and down quarks. Our extracted values are included in the online supplemental material onl . The top panels show the proton form factors used in the extraction, normalized to the dipole form, along with the values from the CJRW analysis, the AMT and VAMZ fits, and recent calculations.
Note that for and , as well as the flavor-separated values, the CJRW points have no uncertainty. This is simply because they extract these directly from parameterizations of , , and and do not include any uncertainty in the fits. Obviously, when looking at form factors that are independent of the measurements, these uncertainties cannot be neglected.
Our results are otherwise in relatively good agreement with the CJRW analysis. The different treatment of TPE corrections in the proton form factor input yields a small difference in and for values near 0.5–1.5 (GeV/c)2. The CJRW results are in better agreement with the improved treatment of TPE corrections in the AMT and VAMZ fits for , while our extraction is in better agreement for . At larger values, both analyses and the global fits yield consistent results.
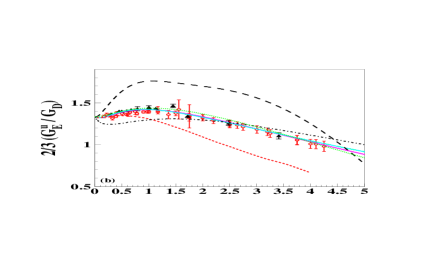
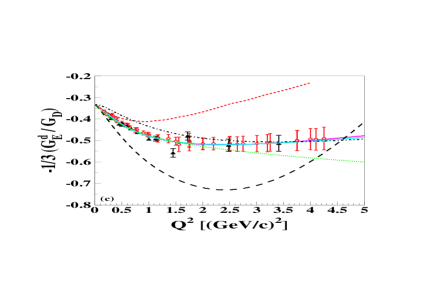
As expected, the up-quark contribution dominates both the charge and magnetic form factor for the proton. Examining the contributions to , we see that both the up- and down-quark contributions have significant deviations from the dipole form. At low values, the increase in is compensated by a decrease in , yielding a small dependence in . At higher values, is consistent with the dipole form, and the decrease of leads to the overall falloff in . Note that the cancellation between the positive but slowly decreasing value of and the negative but nearly constant value of enhances the dependence seen in the up-quark contribution. Thus, the rapid linear falloff observed in is a result of the cancellation between the contributions from the up and down quarks. This behavior is therefore connected to the difference in the up- and down-quark distributions, rather than the overall shape of the quark distributions.
For , both up and down quarks have smaller deviations from the dipole form. At very low values, both have a slightly increasing contribution, yielding a roughly 10% increase in between of 0 and 1 (GeV/c)2. Above this, the slow increase in and slow decrease in yielding a near-perfect agreement of with the dipole form up to =4.5 (GeV/c)2, even though both the up and down contributions have significant deviations.
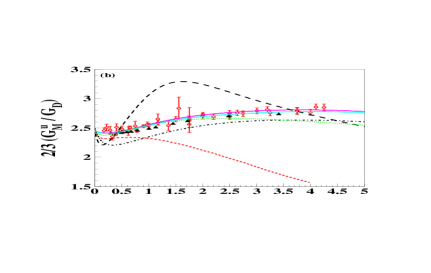
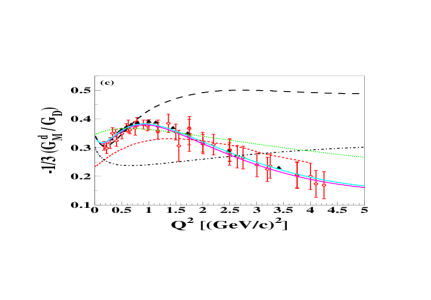
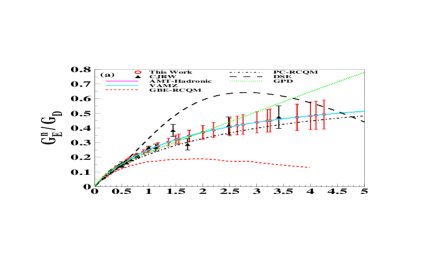
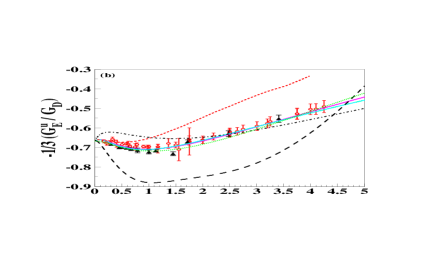
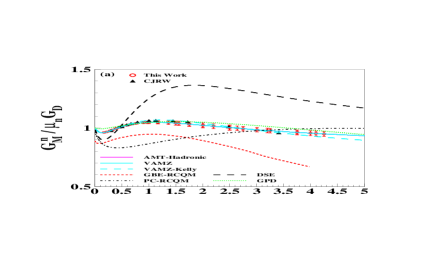
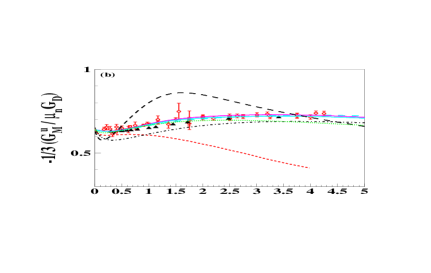
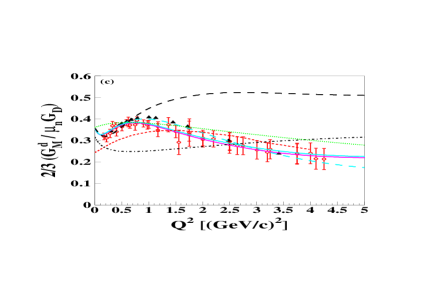
Figures 3 and 4 show the Sachs form factors of the neutron along with their breakdown into up- and down-quark contributions. In this case, our results for and simply reflect the values and uncertainties of the form factor parameterizations. For the CJRW results, and the flavor-separated results include the uncertainties associated with the direct measurements of , while the values for and its up- and down-quark contributions are based entirely on the parameterizations of the proton and neutron magnetic form factors, with no uncertainties included. One can see the difference between our parameterization of and the Kelly fit in Fig. 4(a), where the VAMZ-Kelly fit uses Kelly fit Kelly (2004), and the VAMZ result is our updated parameterization, including the CLAS measurements. The difference in is relatively small, but it is as large or larger than the assumed uncertainty for (GeV/c)2 and at the largest values shown. The impact on the up-quark contribution is negligible, but there is a noticeable change in the extracted down-quark contribution, as seen in Fig. 4(c), which is the main difference between our extraction and the CJRW result.
Unlike in the case of the proton, the up and down quarks both yield large contributions to the neutron form factors. The strong dependence of at low , where is relatively flat, yields the rise in , while at larger values, stops rising and grows slowly compared to the dipole form due to the small dependence in . As with the proton, the contributions to have small deviations from the dipole, although the contribution from the down quark, which has larger deviations, yields a small dependence in at larger values.
Figures 1–4 also show the flavor-separated contributions from form factor parameterizations (AMT Arrington et al. (2007a) and VAMZ Venkat et al. (2011)) and the calculations discussed in Sec. III. As mentioned above, the parameterizations are fits that include much of the data included in these extractions, and so at high yield consistent results with the data. At low , they help show the impact of two-photon exchange corrections which are neglected in the CJRW extraction and treated in a way that is less reliable at low in our analysis.
The calculations all give a reasonable qualitative description of the up- and down-quark contributions, showing rising at high , rising and then leveling off or falling, and relatively little dependence in the up- and down-contributions to . The GPD model Gonzalez-Hernandez et al. (2012) gives the best description of the data, with only small deviations at large . This is not surprising as it includes an essentially complete set of data in fitting the GPDs, and uses a GPD parameterization with sufficient flexibility to reproduce the data. The PC-RCQM result Cloet and Miller (2012) also does a good job in reproducing the behavior of the data, although with significantly larger deviations in (and ) than in the other form factors. The GBE-RCQM calculation Rohrmoser et al. (2011) does a fairly good job of reproducing the data at small low values, but above 1 (GeV/c)2, shows large deviations from the data in both the flavor-separated and the proton and neutron form factors. While it does not reproduce the data as well as the GPD or PC-RCQM curves, it is a parameter-free calculation, making the overall agreement rather remarkable.
The DSE calculation Cloet et al. (2009) has significant deviations at both low and high . However, in the DSE approach, the nucleon mass and quark magnetic moments are not forced to reproduce the physical values, as is expected because additional contributions from pseudoscalar mesons, the “pion cloud” contributions, excluded in this calculation, will bring these closer to the physical values. The missing pseudoscalar meson contributions are expected to modify the behavior at lower values, while the unphysical nucleon mass in this model may modify the comparison at higher values. For this comparison, we used the physical nucleon masses and magnetic moments to partially account for this difference. However, while taking the physical magnetic moments yields the correct limit as , it may worsen the agreement at larger values, where the pion cloud contributions are not expected to be as important. Note that the DSE calculation has most of its parameters fixed based on the calculation of light mesons, and the only additional parameters for the nucleon calculation are the diquark radii, taken to be commensurate with the pion’s charge radius. So as with the GBE-RCQM calculation, the result is not adjusted to improve agreement with the form factor data.
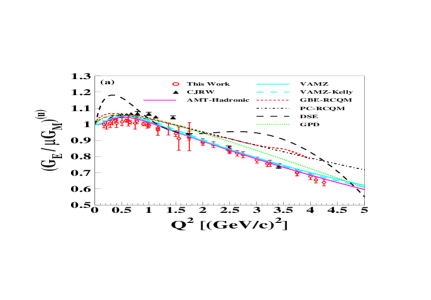
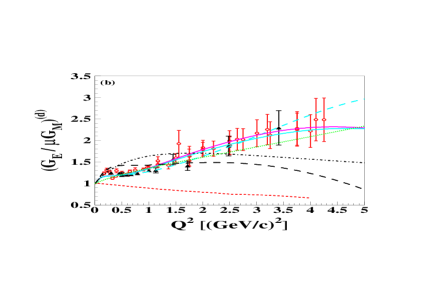
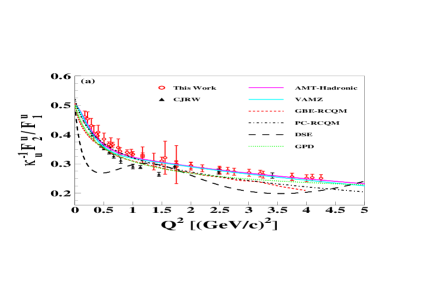
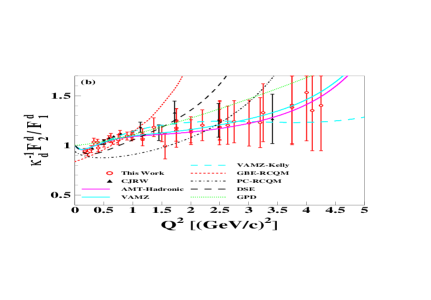
Figure 5 shows the ratio for both the up and down quarks. As before, the extractions for the up-quark contribution disagree somewhat at low , with the fits including a more complete TPE treatment agreeing better with CJRW below 1 (GeV/c)2, and our results above. For the down-quark contributions, the primary disagreement comes from the difference in the results, whose impact can be seen by comparing the VAMZ and VAMZ-Kelly curves.
For the up quark, has a roughly linear falloff at large , but the decrease is slower than seen for the proton. For the down quark, a completely different behavior is seen, with increasing in magnitude with . This behavior is not present in any of the calculations except for the GPD model, which has a sufficiently flexible parameterization of the GPDs to reproduce all of the form factors.
We now examine the Dirac and Pauli form factors, with an emphasis on the high- behavior of the flavor-separated contributions. While perturbative-QCD behavior should set in at large enough values, the data do not extend into the region where one expects these asymptotic predictions to be valid. Nonetheless, it has been observed that approximate scaling of the form factors often sets in at lower values. By taking out the predicted high- behavior, we can more easily see differences in the dependences of the various contributions to the form factors.
Figure 6 shows the proton Dirac and Pauli form factors and their ratio. In all cases, the leading perturbative (“pQCD”) dependence Lepage and Brodsky (1979) is removed by scaling the results by powers of . While pQCD suggests scaling behavior of the form , , and , the data clearly do not support such scaling as both and increase with . While Rosenbluth extractions which did not include TPE corrections observed scaling behavior in the flattening of the ratio , the high- recoil polarization measurements Gayou et al. (2002); A. J. R. Puckett et al. (2010) show that the pQCD scaling behavior is not observed. Note that while both and deviate from the scaling predictions, these deviations are different enough that the ratio also deviates from the pQCD expectation. For the ratio , we also show a curve based on updated result of Ref. Belitsky et al. (2003) which includes an additional logarithmic term that goes like . The data can be well reproduced with a value of near 300 MeV. However, it is not clear that the data in this region should be described by perturbative behavior, even with logarithmic corrections, and the best fit value of MeV appears to be too small to be an appropriate value for Arrington et al. (2007b).
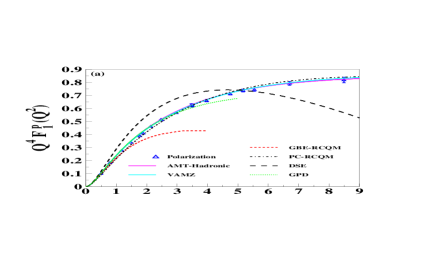
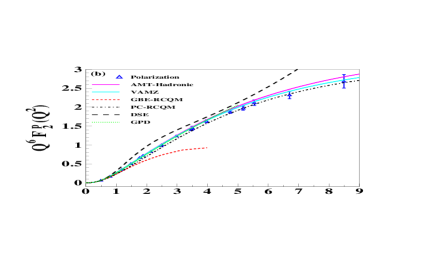
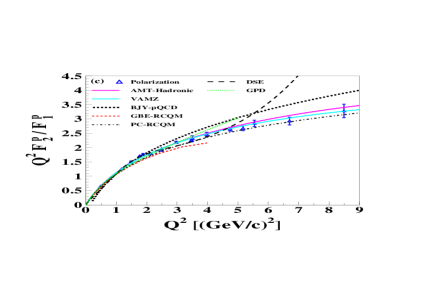
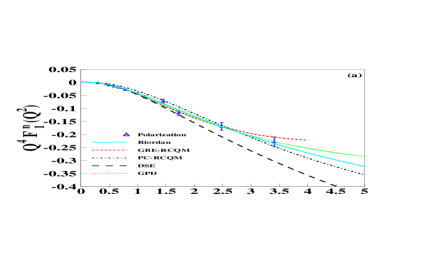
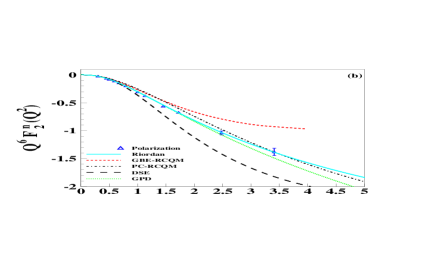
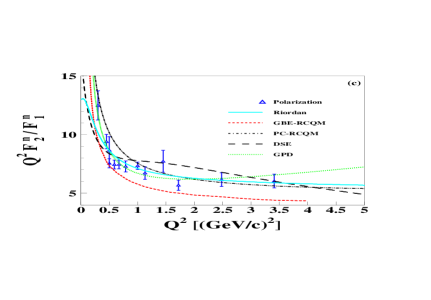
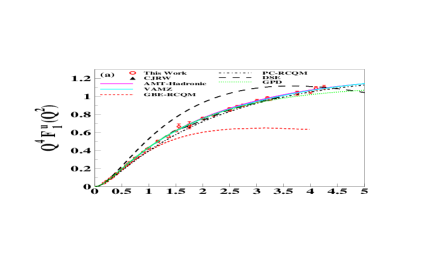
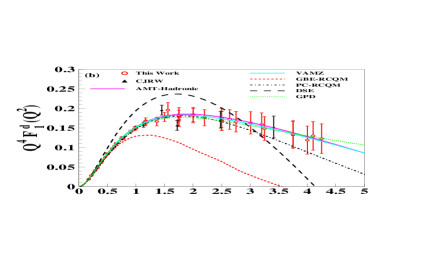
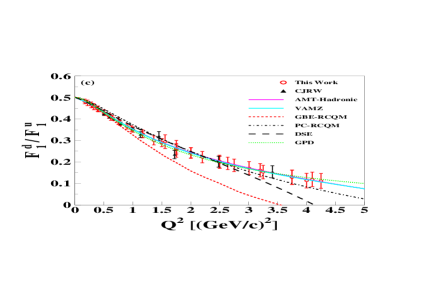
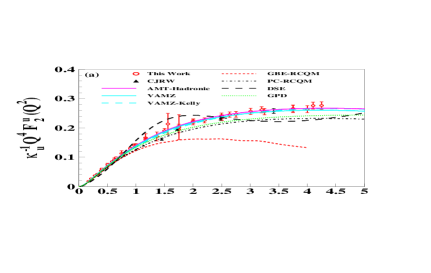
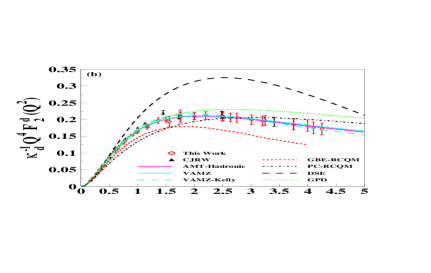
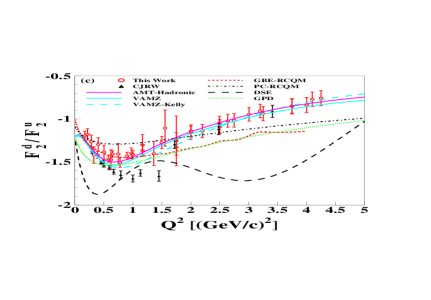
Figure 7 shows the same quantities for the neutron. Again, neither nor are consistent with the pQCD predictions. However, unlike the proton, the ratio is consistent with a constant value above =1.5 (GeV/c)2, as noted in the CJRW analysis Cates et al. (2011), although the precision of the data do not set tight constraints on the dependence.
The DSE and GBE-RCQM calculations generally show similar deviations from experiment for the Dirac and Pauli form factors (for both the proton and the neutron), yielding better agreement with the ratio than the individual form factors. This also helps explain why these calculations are in somewhat better agreement with than , as relates to the difference between and , yielding a partial cancellation of the deviations from the data. At large values, the deviations in the DSE calculation grow and are of the opposite sign for and . However, the calculation does not adjust the diquark radius to better reproduce the proton form factor, and the deviations from the data can be significantly improved by increasing the diquark radius Cloet et al. (2009). At large values, the behavior of the ratio is also extremely sensitive to the dressed-quark mass function, as discussed in Sec. III of Ref. Wilson et al. (2012), due to the significant cancellation between and contributions.
We now turn to the flavor-separated contributions of and . The extracted form factors are shown in Figs. 8 and 9, and the values are provided in the supplemental online material onl . Our values for are somewhat higher than the CJRW extractions at low , and the impact of this difference is seen clearly in the ratio. In this case, there is a small contribution associated with taking the updated parameterization, but the larger effect comes from the impact of TPE corrections on the proton form factors. While the uncertainties have the largest impact, the additional contribution from the proton and yield a non-negligible increase in the total uncertainties.
In the CJRW analysis Cates et al. (2011) it was reported that both and strikingly exhibit scaling above =1.0 (GeV/c)2, in contrast to the up-quark form factors which continued to rise relative to the down-quark values. This was in agreement with the predictions for the moments of the generalized parton distributions reported in Ref. Diehl et al. (2005), although these again are based on fits to data sets which include the nucleon form factors, except for the most recent data. Both our results and the global parameterizations suggest that the down-quark contributions are falling slightly with respect to the 1/ behavior, and this falloff appears to be fairly clear for . However, this behavior is sensitive to the parameterization of at 2 (GeV/c)2, which is constrained directly only by the two data points from Ref. Riordan et al. (2010). Similarly, all of the calculations have the down-quark form factors falling somewhat faster than 1/, suggesting that the apparent scaling behavior may not continue to higher . However, it is still clear that the down-quark contributions fall significantly more rapidly than the up-quark contributions at large , yielding a decrease in the magnitude of at high . The very different dependence for the up- and down-quark contributions suggests that approximate 1/ scaling of for the neutron is only approximate, and may be unrelated to the predicted scaling behaviors.
The faster falloff of the down-quark contributions was interpreted in Ref. Cates et al. (2011) and references therein as an indication of the possibility of sizable nonzero strange matrix elements at large or the importance of diquark degrees of freedom. While existing measurements of parity-violating elastic scattering yield very small contributions from the strange quarks up to (GeV/c)2 Aniol et al. (2004); Armstrong et al. (2005); Androic et al. (2010); Ahmed et al. (2012), they still leave open the possibility for significant contributions from and which cancel in the parity-violating observables Ahmed et al. (2012); Armstrong and McKeown (2012), although there are also results from Lattice QCD that the strange-quark contribution is small for both the charge and magnetic form factors Leinweber et al. (2005); Paschke et al. (2011). In the diquark model, the singly-occurring down quark in the proton is more likely to be associated with an axial-vector diquark than a scalar diquark, and the contributions of the axial-vector diquark yields a more rapid falloff of the form factor. The up quarks are generally associated with the more tightly bound scalar diquarks, yielding a harder form factor Roberts et al. (2007); Cloet et al. (2009); Wilson et al. (2012).
The flavor dependence of the nucleon form factors as obtained in the CJRW extractions was reproduced quite well by incorporating the Regge contribution into Generalized Parton Distributions (GPDs) that already apply diquark models Gonzalez-Hernandez et al. (2012). Inclusion of the Regge contributions is crucial to obtain the correct normalized structure functions. Therefore, the flavor dependence was attributed mainly to Reggeon exchanges and quark-diquark contributions. For the Dirac form factor, the diquark contribution dominates the Regge contribution at low and both contributions become comparable at high . On the other hand, for , both the diquark and Regge contributions are rather comparable. For the Pauli form factors, the Regge contribution dominates that of the diquark contribution and, in particular, at high . This again shows the importance of the diquark contribution at high , although in this framework, the Regge contributions are important in achieving a better result at low . These data will also allow a flavor separation at higher values, where the pion cloud contributions, neglected or included in a less detailed fashion, are expected to be smaller. This will allow for a more direct test of the calculations of the three-quark core, with reduced uncertainties associated with the more poorly understood pion cloud contributions.67
The ratios and are shown in Fig. 10. The values are the limits of , and , where the fact that the magnetic form factor contributions are normalized by quark charge but not by the number of valence quarks yields the subtraction of 2 for the up quark contribution. After scaling by , the ratios are normalized to , yielding 0.5 for the up-quark contribution and 1 for the down-quark. falls rapidly at low , but the decrease is signficantly slower above (GeV/c)2; note the offset zero in Fig. 10(a). Our values are somewhat larger than those obtained in the CJRW extractions for 1.5 (GeV/c)2, due to the difference in the values. For the ratio , the extractions from the data and the fits to the form factors yield consistent results, with a slight increase in the ratio at low and a nearly constant value above 1 (GeV/c)2. However, all of the calculations show a very different behavior, with falling more rapidly than at large values, leading to a rapid rise in the ratio. This is clearly an area where the models should be examined more carefully, although the present measurements of do not rule out a significant rise in the ratio above 1.5 (GeV/c)2. Measurements of planned for higher after the Jefferson Lab 12 GeV upgrade Dudek et al. (2012) will be critical in pinning down the behavior of this ratio.
V conclusions
We have extracted the flavor-separated contributions to the elastic nucleon electromagnetic form factors based on parameterizations of the neutron form factors and their uncertainties, and proton form factor extractions that include phenomenological TPE corrections. The extraction is similar to that of the recent CJRW Cates et al. (2011) analysis, but with an explicit treatment of two-photon exchange effects and the uncertainties on the proton form factor and the neutron magnetic form factors. The treatment of the TPE contributions yields differences in some of the results at low values, up to 1.5 (GeV/c)2. In addition, while our updated parameterization of yields only a small change in the high- behavior, it has a significant impact near (GeV/c)2, where the recent CLAS measurements Lachniet et al. (2009) extraction is somewhat below earlier extractions Anklin et al. (1998); Kubon et al. (2002). As our updated fit falls in between these measurements, the difference between our parameterization and the Kelly fit represents a reasonable estimate of the uncertainty, given these inconsistent extractions. A new extraction of in this region will be important to help resolve this issue. The additional uncertainties included in this analysis generally have a small impact, but are more important for some of the flavor-separated form factors and quantities which are insenstivie to . The extracted flavor-separated form factors are qualitatively reproduced by a range of models, with better quantitative agreement for those models which constrain parameters by directly fitting to nucleon form factor data.
The strong linear falloff with observed in is not present in either the up- or down-quark contributions, but arises due to a cancellation between a weaker dependence for the up quark and a negative but relatively -independent contribution from the down quark. This indicates that the rapid falloff and the zero crossing expected near (GeV/c)2 is associated more with the difference between the up- and down-quark distributions than by the isospin-averaged spatial density distributions.
As noted in the previous analysis Cates et al. (2011), the and form factors show a different dependence for up- and down-quark contributions, which can be shown to be a consequence of diquark degrees of freedom in several of the calculations. We see indications that the down-quark contributions to the Dirac and Pauli form factors deviate from the 1/ scaling suggested in the CJRW analysis, and observe that there are small differences between the dependence in and for both the up- and down-quark contributions.
Finally, the up and down quarks yield very different contributions to (and ), with the ratio decreasing slowly with for the up quark and increasing rapidly for the down quark. The down-quark contribution to this ratio is not well reproduced by any of the calculations, and even the qualitative behavior is not reproduced in most approaches. Data at higher will better constrain the behavior of these ratios, and allow for a more detailed evalation of the nucleon models in a region where pion cloud contributions are expected to be less significant.
Acknowledgements.
This work was supported by Khalifa University of Science, Technology and Research and by the U. S. Department of Energy, Office of Nuclear Physics, under contract DE-AC02-06CH11357. We are grateful to I. C. Cloët, J. O. Gonzales-Hernandez, S. Liuti, G. Miller, W. Plessas and C. D. Roberts for providing us with their calculations.References
- Sachs (1962) R. G. Sachs, Phys. Rev. 126, 2256 (1962).
- Fermi and Marshall (1947) E. Fermi and L. Marshall, Phys. Rev. 72, 1139 (1947).
- Rosenbluth (1950) M. N. Rosenbluth, Phys. Rev. 79, 615 (1950).
- Friedrich and Walcher (2003) J. Friedrich and T. Walcher, Eur. Phys. J. A17, 607 (2003).
- Crawford et al. (2010) C. Crawford, T. Akdogan, R. Alarcon, W. Bertozzi, E. Booth, et al., Phys. Rev. C 82, 045211 (2010).
- Gentile and Crawford (2011) T. Gentile and C. Crawford, Phys. Rev. C 83, 055203 (2011).
- Arrington et al. (2007a) J. Arrington, W. Melnitchouk, and J. A. Tjon, Phys. Rev. C 76, 035205 (2007a).
- Venkat et al. (2011) S. Venkat, J. Arrington, G. A. Miller, and X. Zhan, Phys. Rev. C 83, 015203 (2011).
- Arrington et al. (2007b) J. Arrington, C. D. Roberts, and J. M. Zanotti, J. Phys. G34, 23 (2007b).
- Perdrisat et al. (2007) C. F. Perdrisat, V. Punjabi, and M. Vanderhaeghen, Prog. Part. Nucl. Phys. 59, 694 (2007).
- Arrington et al. (2011a) J. Arrington, K. de Jager, and C. F. Perdrisat, J. Phys. Conf. Ser. 299, 012002 (2011a).
- Cates et al. (2011) G. D. Cates, C. W. de Jager, S. Riordan, and B. Wojtsekhowski, Phys. Rev. Lett. 106, 252003 (2011).
- Punjabi et al. (2005) V. Punjabi et al., Phys. Rev. C 71, 055202 (2005).
- Gayou et al. (2001) O. Gayou et al., Phys. Rev. C 64, 038202 (2001).
- A. J. R. Puckett et al. (2012) A. J. R. Puckett et al., Phys. Rev. C 85, 045203 (2012).
- A. J. R. Puckett et al. (2010) A. J. R. Puckett et al., Phys. Rev. Lett. 104, 242301 (2010).
- Arrington (2003) J. Arrington, Phys. Rev. C 68, 034325 (2003).
- Arrington (2004a) J. Arrington, Phys. Rev. C 69, 022201 (2004a).
- Qattan et al. (2005) I. A. Qattan et al., Phys. Rev. Lett. 94, 142301 (2005).
- Carlson and Vanderhaeghen (2007) C. E. Carlson and M. Vanderhaeghen, Ann. Rev. Nucl. Part. Sci. 57, 171 (2007).
- Arrington et al. (2011b) J. Arrington, P. G. Blunden, and W. Melnitchouk, Prog. Part. Nucl. Phys. 66, 782 (2011b).
- Lachniet et al. (2009) J. Lachniet et al. (CLAS Collaboration), Phys. Rev. Lett. 102, 192001 (2009).
- Riordan et al. (2010) S. Riordan, S. Abrahamyan, B. Craver, A. Kelleher, A. Kolarkar, et al., Phys. Rev. Lett. 105, 262302 (2010).
- Miller et al. (1990) G. A. Miller, B. M. K. Nefkens, and I. Slaus, Phys. Rept. 194, 1 (1990).
- Beck and McKeown (2001) D. H. Beck and R. D. McKeown, Ann. Rev. Nucl. Part. Sci. 51, 189 (2001).
- Kelly (2004) J. J. Kelly, Phys. Rev. C 70, 068202 (2004).
- Lung et al. (1993) A. Lung et al., Phys. Rev. Lett. 70, 718 (1993).
- Anklin et al. (1994) H. Anklin et al., Phys. Lett. B336, 313 (1994).
- Anklin et al. (1998) H. Anklin et al., Phys. Lett. B428, 248 (1998).
- Kubon et al. (2002) G. Kubon et al., Phys. Lett. B524, 26 (2002).
- Anderson et al. (2007) B. Anderson et al. (Jefferson Lab E95-001 Collaboration), Phys. Rev. C 75, 034003 (2007).
- (32) B. Plaster, private communication.
- (33) S. Riordan, private communication.
- Guichon and Vanderhaeghen (2003) P. A. M. Guichon and M. Vanderhaeghen, Phys. Rev. Lett. 91, 142303 (2003).
- Meziane et al. (2011) M. Meziane et al., Phys. Rev. Lett. 106, 132501 (2011).
- Qattan et al. (2011) I. A. Qattan, A. Alsaad, and J. Arrington, Phys. Rev. C 84, 054317 (2011).
- Borisyuk and Kobushkin (2011) D. Borisyuk and A. Kobushkin, Phys. Rev. D 83, 057501 (2011).
- Tvaskis et al. (2006) V. Tvaskis et al., Phys. Rev. C 73, 025206 (2006).
- Chen et al. (2007) Y.-C. Chen, C.-W. Kao, and S.-N. Yang, Phys. Lett. B652, 269 (2007).
- Arrington (2004b) J. Arrington, Phys. Rev. C 69, 032201 (2004b).
- Andivahis et al. (1994) L. Andivahis et al., Phys. Rev. D 50, 5491 (1994).
- Walker et al. (1994) R. C. Walker et al., Phys. Rev. D 49, 5671 (1994).
- Christy et al. (2004) M. E. Christy et al., Phys. Rev. C 70, 015206 (2004).
- Bartel et al. (1973) W. Bartel, F.-W. Büsser, W.-R. Dix, R. Felst, D. Harms, H. Krehbiel, J. McElroy, J. Meyer, and G. Weber, Nucl. Phys. B 58, 429 (1973).
- Litt et al. (1970) J. Litt et al., Phys. Lett. B 31, 40 (1970).
- Berger et al. (1971) C. Berger, V. Burkert, G. Knop, B. Langenbeck, and K. Rith, Phys. Lett. B 35, 87 (1971).
- Janssens et al. (1966) T. Janssens, R. Hofstadter, E. B. Hughes, and M. R. Yearian, Phys. Rev. 142, 922 (1966).
- Crawford et al. (2007) C. B. Crawford et al., Phys. Rev. Lett. 98, 052301 (2007).
- Ron et al. (2007) G. Ron, J. Glister, B. Lee, K. Allada, W. Armstrong, et al., Phys. Rev. Lett. 99, 202002 (2007).
- Zhan et al. (2011) X. Zhan, K. Allada, D. S. Armstrong, J. Arrington, W. Bertozzi, et al., Phys. Lett. B705, 59 (2011).
- Ron et al. (2011) G. Ron et al., Phys. Rev. C 84, 055204 (2011).
- Bernauer et al. (2010) J. C. Bernauer et al. (A1 Collaboration), Phys. Rev. Lett. 105, 242001 (2010).
- Blunden and Sick (2005) P. G. Blunden and I. Sick, Phys. Rev. C 72, 057601 (2005).
- Bernauer et al. (2011) J. C. Bernauer et al., Phys. Rev. Lett. 107, 119102 (2011).
- Arrington (2011) J. Arrington, Phys. Rev. Lett. 107, 119101 (2011).
- Blunden et al. (2003) P. G. Blunden, W. Melnitchouk, and J. A. Tjon, Phys. Rev. Lett. 91, 142304 (2003).
- Blunden et al. (2005) P. G. Blunden, W. Melnitchouk, and J. A. Tjon, Phys. Rev. C 72, 034612 (2005).
- Borisyuk and Kobushkin (2006) D. Borisyuk and A. Kobushkin, Phys. Rev. C 74, 065203 (2006).
- Borisyuk and Kobushkin (2007) D. Borisyuk and A. Kobushkin, Phys. Rev. C 75, 038202 (2007).
- Borisyuk and Kobushkin (2008) D. Borisyuk and A. Kobushkin, Phys. Rev. C 78, 025208 (2008).
- Borisyuk and Kobushkin (2012) D. Borisyuk and A. Kobushkin (2012), eprint arXiv:1206.0155.
- Arrington (2012) J. Arrington (2012), eprint arXiv:1210.2677.
- Spayde et al. (2004) D. T. Spayde et al. (SAMPLE), Phys. Lett. B583, 79 (2004).
- Maas et al. (2004) F. E. Maas et al. (A4 Collaboration), Phys. Rev. Lett. 93, 022002 (2004).
- Aniol et al. (2004) K. A. Aniol et al. (HAPPEX Collaboration), Phys. Rev. C 69, 065501 (2004).
- Maas et al. (2005) F. E. Maas, K. Aulenbacher, S. Baunack, L. Capozza, J. Diefenbach, et al., Phys. Rev. Lett. 94, 152001 (2005).
- Armstrong et al. (2005) D. S. Armstrong et al. (G0 Collaboration), Phys. Rev. Lett. 95, 092001 (2005).
- Young et al. (2006) R. D. Young, J. Roche, R. D. Carlini, and A. W. Thomas, Phys. Rev. Lett. 97, 102002 (2006).
- Acha et al. (2007) A. Acha et al. (HAPPEX collaboration), Phys. Rev. Lett. 98, 032301 (2007).
- Liu et al. (2007) J. Liu, R. D. McKeown, and M. J. Ramsey-Musolf, Phys. Rev. C 76, 025202 (2007).
- Pate et al. (2008) S. F. Pate, D. W. McKee, and V. Papavassiliou, Phys. Rev. C 78, 015207 (2008).
- Wang et al. (2009) P. Wang, D. B. Leinweber, A. W. Thomas, and R. D. Young, Phys. Rev. C 79, 065202 (2009).
- Androic et al. (2010) D. Androic et al. (G0 Collaboration), Phys. Rev. Lett. 104, 012001 (2010).
- Paschke et al. (2011) K. Paschke, A. Thomas, R. Michaels, and D. Armstrong, J. Phys. Conf. Ser. 299, 012003 (2011).
- Ahmed et al. (2012) Z. Ahmed et al. (HAPPEX collaboration), Phys. Rev. Lett. 108, 102001 (2012).
- Armstrong and McKeown (2012) D. S. Armstrong and R. D. McKeown (2012), eprint arXiv:1207.5238.
- Cloet et al. (2009) I. C. Cloet, G. Eichmann, B. El-Bennich, T. Klahn, and C. D. Roberts, Few Body Syst. 46, 1 (2009).
- Roberts et al. (2007) C. D. Roberts, M. S. Bhagwat, A. Holl, and S. V. Wright, Eur. Phys. J. ST 140, 53 (2007).
- Cloet and Miller (2012) I. C. Cloet and G. A. Miller, Phys. Rev. C 86, 015208 (2012).
- Frank et al. (1996) M. R. Frank, B. K. Jennings, and G. A. Miller, Phys. Rev. C 54, 920 (1996).
- Gonzalez-Hernandez et al. (2012) J. O. Gonzalez-Hernandez, S. Liuti, G. R. Goldstein, and K. Kathuria (2012), eprint arXiv:1206.1876.
- Rohrmoser et al. (2011) M. Rohrmoser, K.-S. Choi, and W. Plessas (2011), eprint arXiv:1110.3665.
- Glozman et al. (1998) L. Y. Glozman, W. Plessas, K. Varga, and R. F. Wagenbrunn, Phys. Rev. D 58, 094030 (1998).
- (84) W. Plessas, private communication.
- (85) See Supplemental Material at [to be inserted] for the proton, neutron, and flavor-separated form factors from this analysis.
- Lepage and Brodsky (1979) G. P. Lepage and S. J. Brodsky, Phys. Rev. Lett. 43, 545 (1979).
- Gayou et al. (2002) O. Gayou et al., Phys. Rev. Lett. 88, 092301 (2002).
- Belitsky et al. (2003) A. V. Belitsky, X.-d. Ji, and F. Yuan, Phys. Rev. Lett. 91, 092003 (2003).
- Zhu et al. (2001) H. Zhu et al., Phys. Rev. Lett. 87, 081801 (2001).
- Bermuth et al. (2003) J. Bermuth et al., Phys. Lett. B564, 199 (2003).
- Warren et al. (2004) G. Warren et al., Phys. Rev. Lett. 92, 042301 (2004).
- Glazier et al. (2005) D. I. Glazier et al., Eur. Phys. J. A24, 101 (2005).
- Plaster et al. (2006) B. Plaster et al., Phys. Rev. C 73, 025205 (2006).
- Wilson et al. (2012) D. J. Wilson, I. C. Cloet, L. Chang, and C. D. Roberts, Phys. Rev. C 85, 025205 (2012).
- Diehl et al. (2005) M. Diehl, T. Feldmann, R. Jakob, and P. Kroll, Eur. Phys. J. C39, 1 (2005).
- Leinweber et al. (2005) D. B. Leinweber et al., Phys. Rev. Lett. 94, 212001 (2005).
- Dudek et al. (2012) J. Dudek, R. Ent, R. Essig, K. Kumar, C. Meyer, et al. (2012), eprint arXiv:1208.1244.