Ages and abundances in large-scale stellar disks of nearby S0 galaxies ††thanks: Based on the observations with the Russian 6m telescope
Abstract
By undertaking deep long-slit spectroscopy with the focal reducer SCORPIO of the Russian 6m telescope, we studied stellar population properties and their variation with radius in 15 nearby S0 galaxies sampling a wide range of luminosities and environments. For the large-scale stellar disks of S0s, we have measured SSP-equivalent metallicities ranging from the solar one down to [Z/H], rather high magnesium-to-iron ratios, [Mg/Fe], and mostly old SSP-equivalent ages. Nine of 15 (60%13%) galaxies have large-scale stellar disks older than 10 Gyr, and among those we find all the galaxies which reside in denser environments. The isolated galaxies may have intermediate-age stellar disks which are 7-9 Gyr old. Only two galaxies of our sample, NGC 4111 and NGC 7332, reveal SSP-equivalent ages of their disks of 2–3 Gyrs. Just these two young disks appear to be thin, while the other, older disks have scale heights typical for thick stellar disks. The stellar populations in the bulges at radii of are on the contrary more metal-rich than the solar , with the ages homogeneously distributed between 2 and 15 Gyr, being almost always younger than the disks. We conclude that S0 galaxies could not form in groups at as is thought now; a new scenario of the general evolution of disk galaxies is proposed instead.
keywords:
galaxies: evolution – galaxies: structure.1 Introduction
In the ‘tuning fork’ galaxy classification scheme by Hubble (1936) lenticular galaxies occupied an intermediate position between ellipticals and spirals. They looked homogeneously red and smooth, as ellipticals, implying that they contained an old stellar population, and they had at least two large-scale structural components, centrally concentrated spheroids (bulges) and extended stellar disks, as spirals. Hubble suggested that the morphological-type sequence might be an evolutionary sequence from the simplest shapes to more complex ones because his classification was ‘almost identical with the path of development derived by Jeans from purely theoretical investigations’ (Hubble, 1926). Later, the opposite evolution was supposed by the dominant cosmological paradigm: pure disks – late-type spirals? – formed first, and later they merged into spheroids – bulges of early-type disk galaxies or elliptical galaxies. But in all schemes lenticulars remain secondary products of galaxy evolution. The most common opinion is presently that lenticular galaxies are former spirals which lost their gas and could not produce more young stars.
The transformation of spirals into lenticulars is thought to be related to dense environments. Indeed, within dense environments lenticulars are the dominant galaxy population (Dressler, 1980; Postman & Geller, 1984); whereas in the field the fraction of S0s is only about 15%, with spirals being the majority (Naim et al., 1995). Within the typical group environments the fractions of S0s and Spirals are comparable, both about 40% -45% (Postman & Geller, 1984), and in clusters the fraction of S0s may reach 60% (Dressler, 1980). The studies of galaxy morphologies with the Hubble Space Telescope have shown, that the morphological-type balance within dense environments changes abruptly at the redshifts of 0.4–0.5 (Dressler et al., 1997). The fraction of elliptical galaxies in clusters stays constant at 20%-30% between and , while spiral galaxies, constituting about 50% -70% of all galaxies in high-redshift clusters, are replaced by lenticulars at the redshift of 0.4 (Fasano et al., 2000). According to these results, the exact place of S0 formation at was supposed to be clusters and the proposed mechanisms for this transformation were associated to dense environments via tidal effects and interaction with hot intracluster medium (Spitzer & Baade, 1951; Icke, 1985; Moore et al., 1996; Byrd & Valtonen, 1990; Quilis et al., 2000; Larson et al., 1980; Shaya & Tully, 1984; Gunn & Gott, 1971; Cowie & Songaila, 1977). However, recently some additional observational information was presented which gave evidence for equal presence of lenticulars and spirals in the clusters and in groups at redshifts . Wilman et al. (2009) have found that at the fraction of S0s in groups is exactly the same as the fraction of S0s in clusters, and exceeds significantly the fraction of S0s in the field, so they have concluded that the group and subgroup environments were the main sites of the formation of S0 galaxies, and clusters at had then to accrete the groups together with their S0s. Moreover Just et al. (2010) have measured strong evolution of the S0 fraction in massive groups with galaxy velocity dispersions of km/s between and . So the probable place of the proposed galaxy transformation has shifted now from cluster to groups.
The information on galaxy morphologies at even higher redshifts, , implies another possible way of S0 formation. Deep fields of the Hubble Space Telescope have provided high-resolution images of high-redshift galaxies; the statistics of the morphological types at demonstrate the absence of shapes typical for lower redshifts (those of the ‘tuning fork’) and the dominance of clumpy irregular types: chains, nests, ‘head-tails’, etc. (van den Bergh et al., 1996; Elmegreen et al., 2005, 2007). Kinematical studies of gas motions within these chains and nests have shown that these are massive, of solar masses, gravitationally-bound disks where star formation proceeds in clumps with typical sizes of about 1 kpc and where the thickness of the disks matches just the clump sizes being 1–1.5 kpc (Genzel et al., 2008; Forster Schreiber et al., 2011). Theoretical considerations confirm that gas-rich disks at are gravitationally unstable and should fragment into clumps with typical masses of solar mass (Noguchi, 1999; Ceverino et al., 2010). The observed timescales of star formation in these clumpy disks is much less than years – on average, years, according to Genzel et al. (2008). It means that at we expect fast formation of thick stellar disks via effective consumption of gas by star formation during a few years with subsequent feedback (stellar winds of massive stars, supernova explosions) which should clear the disks of remaining gas and would produce S0 galaxies which will be 10-12 Gyr old at .
If the bulk of S0 galaxies were spirals at , or only 4 Gyr ago according to the modern Universe LCDM timescale, then star formation proceeded in their disks only 4–5 Gyr ago. In that case their disks should now contain stars as young as 4–5 Gyr and with the solar magnesium-to-iron ratio. Stellar populations in cluster elliptical galaxies are much older than 4 Gyr (Thomas et al., 2005), and however the mean integrated colours of the nearby ellipticals and lenticulars are the same (Buta & Williams, 1995). Larson et al. (1980) explained this controversy with the aid of age-metallicity degeneracy: if the younger stellar population of S0s are also more metal-rich than the stellar populations of ellipticals, then the colours might be the same. The age-metallicity degeneracy problem can be solved to determine both metallicity and mean age of the stellar populations in S0 disks by using e.g. Lick indices including H (Worthey, 1994) or by combining optical colours with the near infrared (NIR) data (Bothun & Gregg, 1990). There were numerous attempts of doing so, but with controversial results. By combining the optical colours with the NIR data Bothun & Gregg (1990) found that the S0 disks are younger by 3–5 Gyr than their centers (which they called ‘bulges’), while Peletier & Balcells (1996) did not detect any age difference between the bulges and the disks in their sample of S0s, and MacArthur et al. (2004), among a few S0 galaxies, found 2 or 3 where the centers were prominently younger than the outer disks. The dominant positive age gradients along the radius up to several effective radii are found for a large sample of field S0 galaxies by Prochaska Chamberlain et al. (2011) from the grJH surface photometry. The similar photometric study of 53 S0 galaxies in the Virgo cluster by Roediger et al. (2011) has revealed zero mean age gradient along the radius and the very old centers of S0s ( Gyr). The same scatter of conclusions is seen among the studies done by using spectral line indices. The early paper by Caldwell (1983) where the centers of S0s were assumed to be old by definition, demonstrated bluer -colours of the disks with respect to the Mg– metallicity sequence for old stellar populations, so the disks were concluded to be younger than the ‘bulges’. Later, with the advent of Lick indices and modern stellar population models, (Fisher et al.1996) found the disks to be older than the centers in a few nearby S0s. The same conclusion was reached by Bedregal et al. (2011) and by Spolaor et al. (2010) for small samples of S0 Fornax members, including dwarfs and giants, while Mehlert et al. (2003), analysing data for Coma cluster member galaxies, did not see any age difference between the centers and the outer parts of the galaxies in their sample. Deep spectral observations of individual nearby S0 galaxies were also published: in NGC 3115 the disk is younger than the bulge (6 Gyr vs 12 Gyr) (Norris et al., 2006), and in NGC 3384 the age trend is opposite (Sánchez-Blázquez et al., 2006). However, we would note that most of these studies probed the disk stellar populations at the radii of maximum 1–2 exponential scale lengths; the photometric study by Prochaska Chamberlain et al. (2011) and the study of NGC 3115 are the only ones reaching outer disks of their S0s.
In the present work, we have measured variations of Lick indices along the radius up to 2–4 exponential scale lengths in 15 nearby lenticular galaxies in different environments. By using photometric decomposition, we have extracted the regions where the bulge or disk dominate, and have determined the mean (light-weighted or SSP-equivalent) ages, metallicities, and magnesium-to-iron abundance ratios for the bulges and for the stellar disks. These data are crucial to evaluate currently available scenarios of formation of S0 galaxies. The paper is organized as follows. Section 2 presents our sample. Section 3 describes the observations and data reduction. Section 4 reviews the details of the photometric structures and gives our own photometric analysis of some moderately inclined galaxies of our sample. The central Section 5 presents the age and abundance measurements in the bulges and in the large-scale disks of the galaxies under consideration. Sections 6 and 7 contain the discussion and the conclusions respectively.
2 The sample
The sample consists of nearby lenticular galaxies for which deep long-slit spectra have been obtained at the Russian 6m telescope during the last five years as a part of several observational programs. The main body of the sample is the set of edge-on lenticular galaxies selected for the kinematical study and dynamical modelling by Natalia Sotnikova and observed in the frame of her observational proposal; the kinematical profiles for these galaxies are to be published later. For the purpose of the present work we have taken the raw spectral data and have derived Lick-index profiles. Four additional moderately inclined S0 galaxies come from our sample of nearby early-type disk galaxies – group members whose central parts have been studied earlier with the Multi-Pupil Fiber Spectrograph of the 6m telescope; the kinematical and Lick-index data for the central parts of these galaxies have been partly published in Sil’chenko (2000); Sil’chenko & Afanasiev (2004, 2006). The main global parameters of the galaxies studied in this work are given in Table 1.
| Name | Type | , kpc | , | D4, Mpc | PAphot | Environment6 | ||||||
| (NED1) | (RC32) | (RC3) | (RC3) | (NED) | (LEDA5) | (RC3) | ||||||
| N502 | SA00(r) | 34 | 4.9 | 13.57 | –18.8 | –22.6 | 0.95 | 2489 | 30 | – | 1 | |
| N524 | SA0+(rs) | 85 | 11.5 | 11.17 | –21.1 | –25.1 | 1.05 | 2379 | 28 | – | 2 | |
| N1029 | S0/a | 41 | 9.3 | 13.32 | –20.0 | –23.7 | – | 3635 | 46.5 | 3 | ||
| N1032 | S0/a | 97 | 15.7 | 12.29 | –20.4 | –24.3 | 1.00 | 2694 | 34 | 5 | ||
| N1184 | S0/a | 85 | 12.5 | 13.44: | –19.0 | –24.3 | – | 2342 | 31 | 5 | ||
| N2549 | SA00(r) | 117 | 8.9 | 12.00 | –19.0 | –22.9 | 0.93 | 1039 | 15.7 | 4 | ||
| N2732 | S0 | 63 | 8.2 | 12.85 | –19.3 | –23.2 | 0.96 | 1960 | 27 | 4 | ||
| N3166 | SAB(rs)0/a | 144 | 16.2 | 11.01 | –20.8 | –24.6 | 0.87 | 1345 | 23 | 4 | ||
| N3414 | S0pec | 106 | 12.0 | 11.86 | –20.0 | –23.9 | 0.97 | 1414 | 23.5 | 7 | – | 2 |
| N4111 | SA0+(r): | 137 | 9.5 | 11.60 | –19.2 | –23.2 | 0.89 | 807 | 14 | 0 | ||
| N4570 | S0 | 114 | 15.5 | 11.80 | –20.5 | –24.55 | 0.94 | 1730 | 28 | 0 | ||
| N5308 | S0- | 112 | 15.7 | 12.42 | –19.9 | –23.95 | 0.92 | 2041 | 29 | 1 | ||
| N5353 | S0 | 66 | 10.8 | 11.98 | –20.7 | –25.0 | 0.97 | 2325 | 34 | 2 | ||
| N7332 | S0 pec | 122 | 6.6(13.6) | 11.93 | –18.3 (–19.9) | –22.2 (–23.8) | 0.91 | 1172 | 11 (23) | 4 | ||
| I1541 | – | 235 | 8.55 | 15.155 | –19.55 | –23.5 | 1.048 | 5926 | 76 | 1 | ||
| 1NASA/IPAC Extragalactic Database | ||||||||||||
| 2Third Reference Catalogue of Bright Galaxies | ||||||||||||
| 3, from 2MASS, are taken from the NED photometry lists | ||||||||||||
| 4Distances from NED, ‘Cosmology corrected’ option, except NGC 7332 where in parentheses there is from Tonry et al. (2001) | ||||||||||||
| 5Lyon-Meudon Extragalactic Database | ||||||||||||
| 6Environments: 0 – cluster member, 1 – rich-group member, 2 – rich-group center, 3 – loose-group member, 4 – loose-group center, 5 – field | ||||||||||||
| 7An obviously wrong inclination of is given for NGC 3414 in the Lyon-Meudon Extragalactic Database | ||||||||||||
| 8The colour in the central aperture of , according to Startseva et al. (2009) | ||||||||||||
The sample is small, however the galaxies are homogeneously distributed over the luminosities, with their blue absolute magnitudes from –19 to –21, and located at different environments. We have one galaxy (NGC 4570) in the Virgo cluster where the intracluster medium influence is inavoidable, and one galaxy (NGC 4111) in the Ursa Major cluster where X-ray gas is not detected. Among group galaxies, NGC 524 and NGC 5353 are central galaxies embedded into X-ray haloes, NGC 5308 is a member galaxy in the X-ray bright group, and NGC 502 and IC 1541 though being members of rich galaxy groups, lie outside the X-ray halos of their groups (Osmond & Ponman (2004), and also some archive ASCA images). NGC 3414 is a central galaxy in the rich group undetected in X-ray. NGC 2732 is a modest host of a few faint satellites. NGC 1029, NGC 2549, and NGC 7332 are in triplets. By using the NED environment searcher, we did not find any galaxies within 300 kpc from NGC 1032 and NGC 1184 so in our Table 1 we characterized them as isolated field galaxies.
3 Observations and data reduction
The long-slit spectral observations were made with the focal reducer SCORPIO111For a description of the SCORPIO instrument, see http://www.sao.ru/hq/moisav/scorpio/scorpio.html. (Afanasiev & Moiseev, 2005) installed at the prime focus of the Russian 6m telescope (in the Special Astrophysical Observatory of the Russian Academy of Sciences). As the main goals were stellar kinematics and Lick indices H, Mgb, Fe5270, and Fe 5335, we observed a quite narrow spectral range rich with absorpion lines, 4800–5500 Å, by using the volume-phase grating 2300G. The slit width was one arcsecond and the spectral resolution – about 2 Å. The CCD EEV CCD42-40 and later in 2010 – the CCD E2V CCD42-90 were used as detectors, and the sampling along the slit was per pixel. The slit length is about 6 arcminutes so the data from the edges of the slit were used as the sky background to be subtracted from the galaxy spectra. Inhomogeneties of the optics transmission and spectral resolution along the slit were checked with the high signal-to-noise twilight exposures. Since some of lenticular galaxies reveal weak emission lines in their spectra, and their stellar Lick index H may be contaminated by the Balmer emission line of the ionized gas, we also obtained spectra of a redder spectral range for these galaxies. This was done using the volume-phase grating 1800R (6100–7100 Å), providing the spectral resolution of Å, or the the grating 1200R (5700–7400 Å), providing the spectral resolution of Å. These data have been used to calculate the equivalent width of the H emission line. In order to do this for the bulge-dominated area, we summed the spectra over intervals near the radius of for every bulge, and then made Gaussian multi-component fitting of the [NII]6548+6583+H(emission)+H(absorption) line blend. The derived equivalent widths of the H emission line were used to calculate the correction for the H index as it was described by Sil’chenko (2006). The disks in our sample are mostly emission-free.The journal of all long-slit observations is presented in Table 2.
| Galaxy | Date | Exposure | PA(slit) | Spectral range | Seeing |
|---|---|---|---|---|---|
| NGC 502 | 03 Sep 08 | 80 min | 4800-5500 Å | ||
| NGC 502 | 03 Sep 08 | 80 min | 4800-5500 Å | ||
| NGC 524 | 17 Aug 07 | 40 min | 6100-7100 Å | ||
| NGC 524 | 19 Oct 07 | 160 min | 4800-5500 Å | ||
| NGC 524 | 04 Sep 08 | 45 min | 6100-7100 Å | ||
| NGC 524 | 04 Sep 08 | 20 min | 6100-7100 Å | ||
| NGC 1029 | 6 Nov 10 | 90 min | 4650-5730 Å | ||
| NGC 1032 | 16 Oct 09 | 100 min | 6100-7100 Å | ||
| NGC 1032 | 17 Oct 09 | 120 min | 4825-5500 Å | ||
| NGC 1184 | 14 Oct 09 | 120 min | 4825-5500 Å | ||
| NGC 1184 | 15 Oct 09 | 180 min | 4825-5500 Å | ||
| NGC 2549 | 7 Dec 10 | 180 min | 4650-5730 Å | ||
| NGC 2549 | 25 Dec 10 | 150 min | 5700-7400 Å | ||
| NGC 2732 | 12 Oct 09 | 120 min | 6100-7100 Å | ||
| NGC 2732 | 15 Oct 09 | 120 min | 4825-5500 Å | ||
| NGC 2732 | 15 Oct 09 | 120 min | 6100-7100 Å | ||
| NGC 3166 | 28 Apr 06 | 80 min | 4800-5500 Å | ||
| NGC 3414 | 30 Mar 09 | 45 min | 6100-7100 Å | ||
| NGC 3414 | 31 Mar 09 | 100 min | 6100-7100 Å | ||
| NGC 3414 | 11 Apr 10 | 140 min | 4650-5730 Å | ||
| NGC 4111 | 30 Mar 09 | 45 min | 6100-7100 Å | ||
| NGC 4111 | 21 May 09 | 140 min | 4825-5500 Å | ||
| NGC 4111 | 19 Dec 09 | 105 min | 4825-5500 Å | ||
| NGC 4570 | 08 Apr 10 | 120 min | 4650-5730 Å | ||
| NGC 5308 | 10 Apr 10 | 100 min | 4650-5730 Å | ||
| NGC 5353 | 05 Apr 09 | 45 min | 6100-7100 Å | ||
| NGC 5353 | 24 May 09 | 60 min | 4825-5500 Å | ||
| NGC 7332 | 11 Oct 09 | 180 min | 4825-5500 Å | ||
| NGC 7332 | 11 Oct 09 | 100 min | 6100-7100 Å | ||
| IC 1541 | 2 Sep 08 | 30 min | 5700-7400 Å | ||
| IC 1541 | 2 Nov 10 | 90 min | 4650-5730 Å |
4 Photometric structure of the sample galaxies
In order to match the stellar population properties to particular galaxy components, such as disks and bulges, we have first of all to analyse the light distribution in these galaxies.
The structural parameters of the edge-on sample galaxies are mostly taken from the work by Mosenkov et al. (2010) supplemented by (2011) where -band 2MASS images are decomposed by means of the BUDDA software (de Souza et al., 2004): these galaxies are NGC 1029, 1184, 2549, 2732, 4111, 5308, 4570, 5353, and 7332. Since we know the 2MASS images to be rather shallow, we have checked the validity of the disk exponential scale lengths by decomposing the latest SDSS data for the most of these galaxies in the -band with the GALFIT (Peng et al., 2002); the discrepancy of the found -band scale lengths with those in the -band is of order of a few arcseconds, or within the -band scale length estimate accuracy. The bulge effective radius for NGC 1032 is taken from Gorgas et al. (2007).
Detailed study of the photometric structures of S0 galaxies IC 1541, NGC 502, NGC 524, and NGC 2732 has been undertaken by us through the - and imaging with the focal reducer SCORPIO of the 6m telescope operating in imaging mode. The photometric structure of IC 1541 in the -bands has been published by us earlier (Startseva et al., 2009). In face-on NGC 502 and NGC 524 of the NGC 524 group we have found compact bulges and two-tiered (antitruncated) large-scale exponential disks starting to dominate at (Ilyina & Sil’chenko, 2012).
NGC 3166 is a luminous early-type disk galaxy and the member of a loose group where it is located near the center being almost as luminous as its nearest neighbour, NGC 3169. The structure of the galaxy is very complex, particularly in its central part. Although the galaxy is inclined to our line of sight by at least , with its line of nodes oriented nearly E–W, the ellipticity of the isophotes drops to zero at the radius of . Eskridge et al. (2002), using the results of their OSU Nearby Galaxies Survey, have identified the low-surface brightness bar aligned perpendicular to the line of nodes. There were efforts to decompose the photometric structure of the galaxy: Fisher & Drory (2008) analysed the surface brightness profile in the radius range of and found only a pseudobulge with the Sersic index of , and Laurikainen et al. (2010) found three (!) bars in the central part of the galaxy though failing to fit the outer disk. We have adopted the bulge effective radius in the -band from Laurikainen et al. (2010); however, since the galaxy possesses a compact edge-on circumnuclear disk well seen up to , for this galaxy we estimate the bulge stellar population properties beyond this circumnuclear disk, at , and not at . By decomposing the SDSS -band image, we have succeeded to derive parameters of a very extended, low-surface brightness large-scale disk of the galaxy; it is the only example of our sample where we have not reached the radius of with our spectral data because its kpc.
The bulge effective radii in the -band for NGC 524 and NGC 3414 are taken from Laurikainen et al. (2010).
The decomposition results in the optical bands for the moderately inclined sample galaxy NGC 3414 are presented below.
4.1 The global structure of NGC 3414
Due to its peculiar appearance and strong non-axisymmetry, the structure of NGC 3414 requires a careful approach. There are controversial points of view on the 3D orientation of this galaxy: Baggett et al. (1998) and Chitre & Jog (2002) consider it as a face-on S0 with a high-contrast thin bar while Whitmore et al. (1990) and Laurikainen et al. (2005) treat it as an edge-on galaxy with a large-scale polar disk.
 |
 |
| (a) | (b) |
We analysed a photometric structure of the galaxy by applying the 2D decomposition software BUDDA (de Souza et al., 2004) to the data taken from the SDSS/DR7 archive. The images were sky-subtracted according to the header notification. The used version of the BUDDA allowed to decompose a galaxy into one exponential disk and a Sersic bulge. However we know that the slope of the exponential disk profile may change along the radius – disks may be two-tiered, truncated or antitruncated (Pohlen & Trujillo, 2006; Erwin et al., 2008). To take into account this possibility, we have invented a more complex approach to the galaxy decomposition. Basing on isophotal analysis results, we determine an (outer) radius range where the thin disk dominates – it is the (outer) zone with the isophote ellipticity staying constant along the radius at a value corresponding to the where is the disk inclination to the line of sight. The isophote analysis has been made in the frame of the IRAF software (Fig. 1). After that we masked the inner part of the galaxy and applied the BUDDA procedure only to the outer disk-dominated zone. After obtaining the parameters of the outer disk, we constructed a 2D model disk image, subtracted it from the full galaxy image and then applied the BUDDA for the second time, this time to the residual image, to derive the parameters of the inner disk and of the bulge. In NGC 3414 the isophote ellipticity comes to a constant level only at , and it is a rather low ellipticity: the outer stellar disk is indeed close to face-on orientation. The inner disk, inside , has a shorter scale length, a higher visible ellipticity, and contains perhaps a bar (Fig. 1). The full decomposition results in three bands, , are given in the Table 3.
| Component | Radius range of fitting, arcsec | n | , arcsec | , kpc | , arcsec | ||
| NGC 3414, -band | |||||||
| Outer disk | 1 | – | |||||
| Inner disk | 20–70 | 1 | – | ||||
| Central bulge | – | – | |||||
| NGC 3414, -band | |||||||
| Outer disk | 1 | – | |||||
| Inner disk | 20–70 | 1 | – | ||||
| Central bulge | – | – | |||||
| NGC 3414, -band | |||||||
| Outer disk | 1 | – | |||||
| Inner disk | 20–70 | 1 | – | ||||
| Central bulge | – | – | |||||
5 Age and metallicity along the radius
Focussing on the H, Mgb, Fe5270, Fe5335, we have measured the Lick index profiles up to large distances from the galaxy centers exceeding two exponential scale lengths in almost all cases. The Lick index system was controlled for every observational run with a sample of standard Lick stars (Worthey et al., 1994) in the way described by Baes et al. (2007).
 |
 |
| (a) | (b) |
In Fig. 2 we show the Lick index profiles measured along the major and minor axes in NGC 4111. The comparison to the previous measurements of Mgb and H along the major and minor axes done for this galaxy by (Fisher et al.1996) shows that our profiles are twice as extended. Two halves of the profiles, the northern and southern ones, are in good agreement with each other, with the exception of the H profile where we have not been able to measure the northern part because of the low recession velocity of the stellar component resulting in a cut off the blue-continuum band of the H index. The low point-to-point scatter till the last measured radii gives evidence for the high accuracy of the Lick index measurements even in the outer part of the disk.
 |
 |
| (a) | (b) |
 |
 |
| (c) | (d) |
Figure 3 presents four more examples of our Lick index profiles measured along the major axes of the edge-on lenticular galaxies. One can see very compact central parts with rapid variations of the Lick indices; these are the bulge-dominated zones. Outside these zones, the Lick index profiles look rather flat. For the outer parts, we have binned index measurements in radial ranges of ; the errors shown are standard errors of the means. As a comparison to our data, in Fig. 3 we have also plotted the results of Gorgas et al. (2007) and Proctor & Sansom (2002) obtained from long-slit spectra along the minor axes of the galaxies. Their studies were concentrated exclusively on the bulges. In the centers of the profiles the agreement with our data is almost perfect which confirms our good calibration onto the standard Lick index system and insignificant contributions of the disks into the spectra along the major axes at .
Let us consider separately the bulges and the disks of the galaxies in our total sample.
5.1 The bulges
In order to characterize the bulges, we have decided to probe their stellar population properties at the radii of where refer the effective radii of the bulges after the surface brightness profile decomposition. Since we have photometric decomposition results for all our galaxies, we have estimated the contribution of the disks to the surface brightness at by extrapolating the outer exponential disk profiles toward the centers of the galaxies. These estimates can be used to correct the bulge Lick indices measured at for the disk contributions by assuming a constant level of disk Lick indices over the whole galaxies. In all cases, the disk contributions are rather small and affect the bulge Lick indices only within 0.15 Å for H, 0.4 Å for Mgb, and 0.2 Å for . The halves of the effective radius values, mostly in the -band, and the corrected Lick indices H, Mgb, and for the bulges are listed in Table 4. Seven galaxies of 15 have noticeable Balmer emission lines in their central spectra; the equivalent widths of the H emission lines, which are measured at by applying Gaussian multi-component fitting to the total line profiles taking into account also the wide stellar H absorption line, are listed in Table 4 too. Furthermore, before using the H Lick index to determine the stellar population age and metallicitites, we calculate the H index corrections for the emission. The H emission-line intensities are related to the H emission-line intensities by ionization models under the assumption of the excitation mechanisms. The largest correction corresponds to the gas excitation by young stars, (Burgess, 1958), other mechanisms including effects of dust give steeper Balmer decrements. Our galaxies are of early type and do not reveal clear signs of current star formation. To calculate the H corrections, we choose the empirical Balmer decrement found by Stasinska & Sodré (2001) for a large sample of disk galaxies which corresponds to the mixed gas excitation nature. The detailed description of the procedure can be found in Sil’chenko (2006). In any case, for the galaxies in our sample the largest possible correction is below 0.4 Å.
| NGC/IC | (H), Å | H | Mgb | , Gyr | [Z/H] | [Mg/Fe] | ||
|---|---|---|---|---|---|---|---|---|
| N502 | – | 1.78 | 4.41 | 2.88 | ||||
| N524 | 0.53 | 1.67 | 4.39 | 2.41 | ||||
| N1029 | 0.3∗ | 1.53 | 4.81 | 3.10 | ||||
| N1032 | 0.95 | 1.51 | 4.38 | 2.67 | ||||
| N1184 | – | 1.43 | 4.23 | 2.57 | ||||
| N2549 | – | 2.32 | 3.71 | 2.89 | ||||
| N2732 | 0.38 | 2.09 | 3.75 | 2.58 | ||||
| N3166 | – | 2.16 | 3.26 | 2.64 | ||||
| N3414 | 0.61 | 1.23 | 4.56 | 2.75 | ||||
| N4111 | 0.14(N)–0.97(S) | 2.67 | 3.52 | 2.70 | ||||
| N4570 | – | 1.51 | 4.19 | 2.62 | ||||
| N5308 | – | 1.49 | 4.32 | 2.48 | ||||
| N5353 | – | 1.63 | 5.05 | 2.98 | ||||
| N7332 | 0.22 | 2.28 | 3.22 | 2.45 | ||||
| I1541 | – | 2.14 | 4.09 | 2.50 | ||||
| ∗Measured by Jansen et al. (2000) in the central spectrum of NGC 1029. | ||||||||
 |
 |
| (a) | (b) |
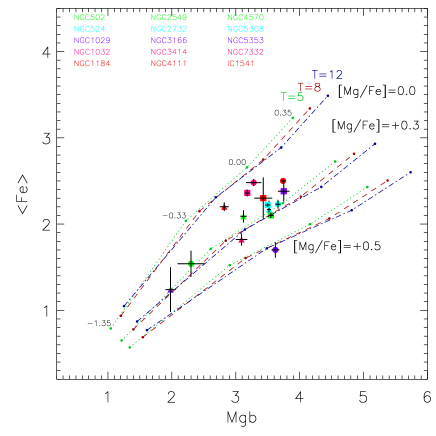
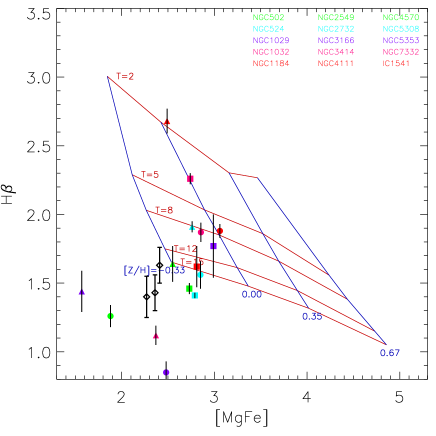
To determine the stellar population properties, we compare our measured indices to the models of Simple Stellar Populations (SSP) by Thomas et al. (2003) for several values of the magnesium-to-iron abundance ratio. Figure 4 presents the index-index diagnostic diagrams which allow us to break the age-metallicity degeneracy and to determine SSP-equivalent ages, metallicities, and magnesium-to-iron abundance ratios for the stellar populations of the bulges which are also listed in Table 4. As one can see, the bulges have mostly [Mg/Fe]dex, and a range of SSP-equivalent ages, from Gyr to 15 Gyr. The total metallicities are solar and higher.
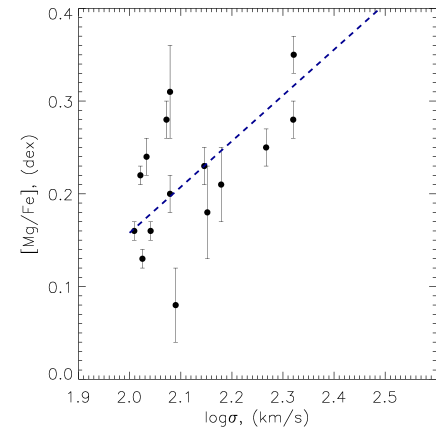
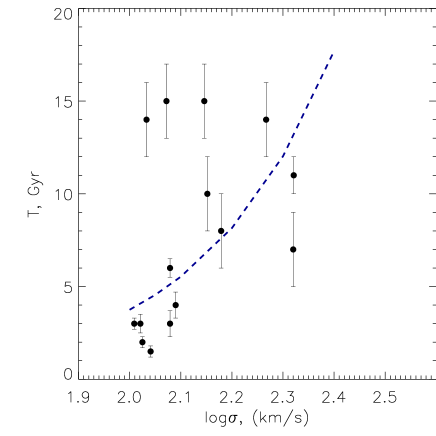
We have tried to find correlations between the parameters of the stellar populations of the bulges and the stellar velocity dispersions at ; the results are presented in Table 6. In our small sample we have not found any correlation of the total metallicity with the stellar velocity dispersion measured by us at the same radius, ; marginal, just below correlations however exist between the age and and between [Mg/Fe] and (Fig. 5). Similar results were obtained by Howell for the sample of nearby field ellipticals (Howell, 2005) and by us for the sample of the bulges of 80 nearby S0s (Sil’chenko, 2008). For Fig. 5 we have calculated the regressions: [Mg/Fe], in full agreement with the recent results of Annibali et al. (2010) for a sample of early-type galaxies (ellipticals lenticulars) who give the slope of and the zero point of . However, our regression for the age, , is much steeper than that by Annibali et al. (2010).
 |
 |
| (a) | (b) |
5.2 The disks
 |
 |
| (a) | (b) |
We tried to probe the outer parts of the disks where the bulge contributions are negligible and where there is no ionized gas so the emission line H does not complicate the stellar age estimate. For NGC 502, we have summed two cross-sections at different position angles, after assuring that because of the symmetrical slit orientations with respect to the kinematical major axis they have identical stellar LOS velocity profiles and that the Lick index radial distributions do not have systematic shifts relative each other. The only complicated case was NGC 3414 where we were restricted to the inner part of the antitruncated disk, , which is strongly polluted by the Balmer emissions. We tried to correct the Lick index H using our procedure (as described above), but perhaps some residual contamination has remained. Finally, we averaged the Lick index measurements in the disks over rather extended radial intervals where the disks dominate photometrically and where the index profiles look rather flat. These intervals are indicated in the Table 5, as well as the mean Lick indices with their errors. As before, the errors are errors of the means calculated from 3–7 individual points.
| NGC/IC | Scale length (Band), | Radius range, | H | Mgb | , Gyr | [Z/H] | [Mg/Fe] | |
| N502 | 10(V),9.5(r) | 20–30 | 1.26 | 2.30 | 1.54 | |||
| N524 | 9(V) | 25–65 | 1.56 | 3.66 | 2.23 | |||
| N1029 | 9(K) | 20–35 | 0.85 | 3.62 | 1.70 | |||
| N1032 | 29(r) | 40–60 | 1.87 | 3.28 | 2.48 | |||
| N1184 | 27(r) | 40–60 | 1.88 | 3.74 | 2.50 | 0.0 | ||
| N2549 | 24(r) | 40–75 | 1.64 | 3.12 | 2.09 | |||
| N2732 | 10(R) | 25–45 | 1.91 | 3.52 | 2.17 | |||
| N3166 | 49(z),62(r) | 40–60∗∗ | 1.44 | 1.98 | 1.24 | |||
| N3414 | 17(r) | 25–60 | 1.12 | 3.09 | 1.82 | |||
| N4111 | 28(r) | 40–70∗ | 2.68 | 2.82 | 2.20 | |||
| N4570 | 25(r) | 30–80 | 1.46 | 3.55 | 2.10 | |||
| N5308 | 20(r) | 30–50 | 1.41 | 3.50 | 2.22 | |||
| N5353 | 9(r) | 35–50∗ | 1.77 | 3.75 | 2.38 | |||
| N7332 | 22(r) | 30–70 | 2.26 | 3.18 | 2.36 | 0.0 | ||
| I1541 | 7(V) | 10–20 | 1.62 | 3.43 | 2.30 | |||
| ∗Only the southern part of the disk is measured. | ||||||||
| ∗∗Only the eastern part of the disk is measured. | ||||||||
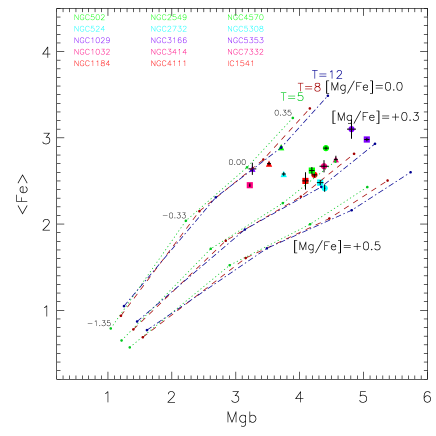
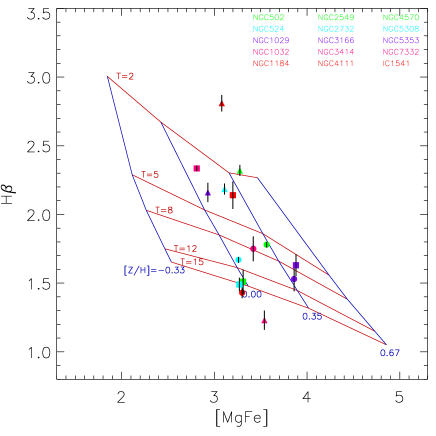
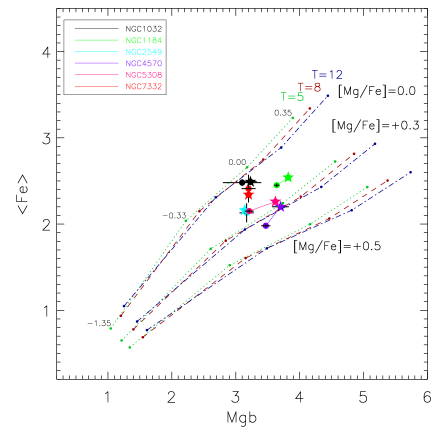
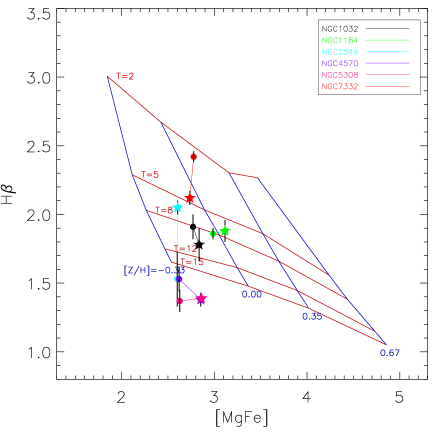
Figure 6 presents the diagnostic index-index diagrams where our measurements for the large-scale disks of the sample lenticular galaxies are compared to the SSP models by Thomas et al. (2003). One can see that the stellar disks of our lenticulars are mostly old, Gyr and older; only two galaxies, just those with young pseudobulges, NGC 4111 and NGC 7332, have also young large-scale stellar disks. The mean metallicities of stellar populations in the disks are mostly subsolar – only three youngest disks reach solar metallicity; in NGC 502, NGC 1029, NGC 3166, and NGC 3414 the mean disk stellar metallicities are very low, [Z/H], as we can see from comparison of their location at the age-diagnostic diagram with some globular clusters of our Galaxy (the SSP models for such metal-poor systems are perhaps not particularly good). And the most striking feature of the large-scale disks in our lenticular galaxies is their high magnesium-to-iron abundance ratio: in every galaxy but NGC 1032 the [Mg/Fe] of the disk is . If we compare these stellar population characteristics to those of stars of our Galaxy, they would resemble the thick disk of the MW (Fuhrmann, 2008), with its age above 10 Gyr, subsolar stellar metallicities and -elements overabundance.
Concerning the usually probed correlations, there is certainly no correlation between the metallicity or [Mg/Fe] ratio and the mass characteristics of the disks, (Table 6). For these particular correlations, we have analysed only edge-on galaxies, so here the stellar velocity dispersions measured along the line of sight are close to the tangential components of the stellar chaotic motions.
Another set of possible correlations may exist between the properties of the disk stellar populations and the environment density. To quantify the environment density, we took the numbers of galaxies in the groups to which the sample galaxies belong. To make the estimates as homogeneous as possible, we used the recent group catalogue by Makarov & Karachentsev (2011) for most galaxies; only NGC 1029 which is absent in the catalogue by Makarov & Karachentsev (2011) is attributed according to the catalogue of isolated triplets by (Karachentseva et al.1979), and for IC 1541, which is too far from us to be involved into the catalogue by Makarov & Karachentsev (2011), we have used the estimates from the work by Mahdavi & Geller (2004). Figure 7 presents the plots of the disk ages and magnesium-to-iron ratios versus the environment density. For the age, the correlation is surely absent. We can only conclude from the right plot of Fig. 7 that in sparse environments the disk age estimates cover the full range of possible values; in other words, the S0 galaxies in sparse environments sometimes rejuvenated their disks after .
 |
 |
| (a) | (b) |
| Spearman’s correlation coefficient | Probability of no correlation | |
| Bulges, at , 15 galaxies | ||
| vs | 0.500 | 0.058 |
| vs | –0.069 | 0.808 |
| vs | 0.462 | 0.083 |
| Disks, only edge-on, 11 galaxies | ||
| vs | 0.380 | 0.248 |
| vs | -0.234 | 0.489 |
| vs | 0.251 | 0.456 |
 |
 |
| (a) | (b) |
Several galaxies have rather extended Lick index profiles, and we are able to estimate stellar population parameters gradients within the disks (Fig. 8). Again we see a difference between the galaxies in dense environments having old disks and the galaxies in sparse environments having intermediate-age disks. In NGC 5308 and NGC 4570 the disks are homogeneously old at all radii, and the metallicity gradient between kpc and kpc (if we assume that NGC 4570 is at the distance of the Virgo cluster) does not exceed –0.04 dex per kpc that is quite typical also for early-type spiral galaxies (Zaritsky et al., 1994). The isolated galaxy NGC 1184 shows negligible gradients both in age and abundances. In NGC 7332, the member of a non-interacting triplet, and in NGC 1032, isolated, the mean stellar age falls along the radius, from 5 to 2.5 Gyr in the former and from 10 to 8 Gyr in the latter. Consequently, the metallicity gradient is positive in NGC 7332 and zero in NGC 1032: the prolonged star formation in the outer disks have increased there the mean stellar metallicity. NGC 2549, the loose-group central galaxy, demonstrates quite a different behaviour: its SSP-equivalent stellar age rises significatly between ( kpc) and ( kpc), from Gyr to Gyr, while the metallicity decreases moderately, by 0.15 dex, so the metallicity gradient can be estimated as –0.08 dex per kpc. Here we must keep in mind that NGC 2549 has a wide surface-brightness excess – probably, a starforming-ring relic – at the radius of (Seifert & Scorza, 1996).
In NGC 524 which has an antitruncated large-scale stellar disk (Ilyina & Sil’chenko, 2012) with the high surface brightness inner part, we are able to estimate separately the parameters of the stellar populations in the inner, , and in the outer, , stellar disks. We found H and [MgFe] for the inner disk, so the parameters of the stellar populations are Gyr and [Z/H]. We can state that the inner disk looks slightly younger and slightly more metal-rich than the outer one, though the difference is within the accuracy of our measurements.
6 Discussion
The old ages and strong magnesium overabundances of the large-scale stellar disks measured by us in this work for the sample of S0s contradict the commonly accepted paradigm described in the Introduction – that S0 galaxies have born ‘en mass’ from spiral progenitors by quenching star formation in their disks when having fallen into dense environments around (4 Gyr ago). In meantime, the SSP-equivalent age of 8 Gyr which is found for the disks of the field galaxies NGC 1032, NGC 1184, NGC 2732 may reflect the constant-rate star formation with quenching abruptly 5 Gyr ago; the SSP-equivalent age of 12 Gyr corresponds to the constant-rate star formation with quenching 10 Gyr ago (Smith et al. 2009, Allanson et al. 2009), or at . If the star formation before quenching was not constant but e-folding, the quenching must have happenned even earlier given the SSP-equivalent ages for the S0 disks found by us (Smith et al., 2009; Allanson et al., 2009). IC 1541, NGC 502, 524, 3414, 5308 (rich group members) and NGC 4570 (Virgo cluster member) have their SSP-equivalent stellar ages of the large-scale disks older than 12 Gyr, so they quenched their star formation at . It seems that the sudden appearance of (red, bulge-dominated) S0 galaxies in clusters and groups at , or 4 Gyr ago, is not related to their morphological shaping. Within these dense environments the lenticulars, shaped earlier and accreted during the massive halo assembly at , might experience some brief rejuvenation of their inner parts (bulges) forcing them to look bluer at than later (and earlier). This idea was proposed by Burstein et al. (2005) who did not find the required large difference between typical luminosities of S0s and spirals that was expected in the scenario of S0s fading from spirals. At the same galaxies/bulges look exactly as red as at (Koo et al., 2005a, b). In the frame of this hypothesis, the numerous results on early-type galaxies number increase in clusters and groups when moving from toward (e.g. Simard et al. (2009)) can be easily understood. Early morphological types are often classified quantitatively by the high ratio or by the high Sersic index when applied to a galaxy as a whole. So the natural secular bulge build-up of disk galaxies within dense environments under gravitational and hydrodynamical influences should provide just a visibility of the early-type galaxies number increase with time. In reality, the main morphological attribute of S0 galaxies – large-scale old stellar disks – is already in place at , though the whole population of S0s at may possess on average smaller bulges than the present S0 population. Curious dependencies found by Dressler (1980), namely, the bulge size increasing with the environment density demonstrated both by S0s and spirals (and the steeper increase is demonstrated just by spirals!), are quite in line with this idea.

Figure 9 presents the comparison of the SSP-equivalent ages between the disks and the bulges in the sample S0s. We see that while the disks are mostly old, the bulges occupy uniformly the whole range of ages between 2 and 15 Gyr; and the disks are almost always older than the bulges. The only exception is NGC 1184, rather isolated galaxy, which has the old bulge and the disk of intermediate age. We can also mention an analogous case of NGC 3115 – the quite isolated S0 galaxy which has the 12 Gyr old bulge and the 6 Gyr old disk (Norris et al., 2006). The relation between the bulge and disk ages similar to our Fig. 9 has been obtained by Prochaska Chamberlain et al. (2011) with their sample of 59 S0s. They constructed a distribution of which looked like a Gaussian peaked at zero with a long tail to positive values. Also, 24% of their sample galaxies have revealed the outer disks older than 10 Gyr. In principle, almost all the mechanisms proposed up to date to transform a spiral galaxy into S0 are able to produce star formation bursts just in the centers of the galaxies. Hydrodynamical mechanisms acting through stripping cold gas from the outer disks by hot-gas ram pressure leave intact the inner gas of the galaxies infalling into a cluster or a massive group and even compress it provoking star formation bursts (Quilis et al., 2000; Kronberger et al., 2008). Recent simulations by Bekki & Couch (2011) of a spiral transforming into S0 by tidal distortions inside a galaxy group show again multiple starbursts in the bulge area during the transformation. But to upbuild a disk, or to burn secondary star formation over an extended disk-dominated area, a galaxy needs obviously to settle within sparse environments where smooth cold-gas accretion is possible. This idea has an observational support: for example, blue-cloud E/S0s which demonstrate star formation over the whole galaxy body at the present epoch, are located in sparse environments (Kannappan et al., 2009).
 |
 |
| (a) | (b) |
As we have noted above, the stellar population chemistry in the disks of lenticular galaxies of our sample appear to lack any correlation with the mass (characterized by ) or with the luminosity of the disks. However, some hints to correlations have been found, and these are correlations with the thickness of the disks. In Fig. 10 we confront the ages and the magnesium-to-iron ratios of the stellar populations in the disks of 9 edge-on S0s versus the scale heights of the disks found by Mosenkov et al. (2010) through the surface photometry analysis. The correlation between [Mg/Fe] and is suggestive, with the Spearman correlation coefficient of 0.6 (less than 10%–probability of no dependence). The correlation between the age and the disk thickness is formally insignificant, with the Spearman correlation coefficient of about 0.35, due to the thick disk of NGC 1184 which has an intermediate age; but neverthless all the old disks of our sample galaxies are thick disks, while the only two young disks, those of NGC 4111 and NGC 7332, are certainly thin disks. The disk of NGC 2732, with its SSP-equivalent age of 8 Gyr and the scale height of 0.5 kpc, is halfway between thin and thick disks. The range of the scale heights is from 0.3 kpc (in the disks with the ages of 2–3 Gyr and [Mg/Fe]) to 0.6–0.9 kpc ( mostly in the disks with the ages Gyr and [Mg/Fe]). Let us compare it to our Galaxy disks’ scale heights: 0.3 kpc for the thin stellar disk and about 1 kpc for the thick stellar disk (Cabrera-Lavers et al., 2005).
Many arguments evidence for S0s and spiral galaxies being relatives – the most recent arguments in favour of the parallel morphological sequences of Ss and S0s can be found, e.g., in Kormendy & Bender (2012); Cappellari et al. (2011). But after taking into account our present results, it looks like S0s are progenitors of spirals, opposite to what was thought before. Indeed, if we compare stars of the thick disk of our own Galaxy with the thick stellar disks of S0s studied here we will see full resemblance: the ages Gyr, [Mg/Fe], the total metallicity, which is closer to [Mg/H] due to Mg coupling with oxygen, both being -elements, than to [Fe/H], [Z/H] is between and (Bernkopf & Fuhrmann, 2006; Schuster et al., 2006). In other spiral galaxies thick stellar disks are also much older than the embedded thin disks (Yoachim & Dalcanton, 2008). So if now one provides fresh cold gas accretion into the disks of our S0s, after several Gyrs of star formation we would get typical spiral galaxies, with the thick old stellar disks and thin younger stellar disks. The idea by Fuhrmann (Fuhrmann, 2011) that primary large-scale components of all galaxies must be thick stellar disks plays here nicely.
Indeed, observations reveal that star formation in disk galaxies at proceeds in clumps with the sizes of about 1-1.5 kpc embedded into large-scale disks which are gravitationally bound; and the scale heights of these disks correspond to the clump sizes so the gaseous disks at are thick (, 2008). Hence, the stellar disks forming from this gas in these galaxies should be also thick. The SPH simulations of the secular evolution for such a configuration promise very effective (and so brief) star formation (Bournaud et al., 2007); observations of starforming galaxies at confirm the short timescales of their star formation (Genzel et al., 2008); so after ceasing star formation the emerged passively evolving stellar structures would possess magnesium-overabundant stellar population. The first observations of the massive, disk-dominated, passive (no star formation) galaxy population at have already appeared in the literature (Bruce et al., 2012).
Initial simulations of the evolution of massive clumpy turbulent star-forming disks implied strong radial inflow of the clumps into the galactic centers, and so it seemed to be a way to form bulges of the future early-type disk galaxies: the resulting model bulges looked similar to the ‘classical’ bulges, with large Sersic indices and slow rotation (Elmegreen et al., 2008). However later inclusion of the star formation feedback into the simulations has resulted in stopping strong gas radial inflows due to shorter lifetimes of the clumps; and instead of the bulges, thick stellar disks emerge now from these simulations (Genel et al., 2012; Hopkins et al., 2012). Bournaud et al. (2009) conclude directly that intense star formation in high-redshift clumpy disks may produce the present thick disks of spiral galaxies.
So now we are proposing the following new scenario of disk galaxy evolution. All disk galaxies were S0s immediately after their birth at . Later, at , some of them were provided with cold gas accretion sources to form thin stellar disks – those might become spirals, – and some of them failed to find such sources – these remained lenticulars. Inside large cluster-size and group-size dark haloes, there are little chances to find external sources of cold gas accretion, due to surrounding hot intergalactic gas, – so in nearby clusters the dominant disk-galaxy population is lenticulars. Or perhaps, the tidal effects – harrassment resulting in starvation – are more effective in stripping the outer cold gas reservoirs of the disk galaxies preventing late building of thin disks; this hypothesis is more in line with the smooth dependence of the S0 (and S) fraction on the local environment density over a full range of the latter parameter, from field to clusters (Postman & Geller, 1984; Cappellari et al., 2011). Our scenario implies that the disks of spiral galaxies must be on average more massive (and so more luminous, say, in the -band) than the disks of S0s; indeed, we see such difference in Fig. 11 of the paper by Laurikainen et al. (2010) where, at fixed bulge luminosity, the disks of spirals are more luminous than the disks of S0s. Moreover, the bulges of early-type spirals are also on average slightly more luminous (in the -band) than the bulges of S0s (Graham & Worley, 2008); so we think that the bulge growth during thin disk formation is probably inavoidable. In general, our scenario explains long-standing problem with the S0s being fainter than E and Sa galaxies between which they are positioned at the Hubble’s ‘tuning fork’ (van den Bergh, 2009). Also, it explains why the Tully-Fisher relation of S0 galaxies goes in parallel to the Tully-Fisher relation for spirals, but with the 0.5 mag shift in the -band toward fainter luminosities at the fixed rotation velocity (Williams et al., 2010): this shift is too small for the star formation truncation 4–5 Gyr ago but, as the authors conclude, ‘could therefore be explained by a systematic difference between the total mass distributions of S0s and spirals, in the sense that S0s need to be smaller … than spirals’.
The open question remains what can be these sources of cold-gas prolonged accretion – they may be cosmologically motivated filaments (Dekel & Birnboim, 2006) or rich systems of irregular-type dwarf satellites which have been merging with the host galaxy one after another. To support the latter possibility, we would like to bring forward the recent curious finding by (Karachentseva et al.2011): by considering a sample of isolated host galaxies, they have found that the pairs ‘S0satellite’ have on average twice higher velocity dispersion (LOS velocity differences) than the pairs ‘Ssatellite’. A close inspection of their figures reveals an absence of the ‘S0satellite’ pairs with the velocity differences less than 50 km/s. It might mean that the satellites of the present S0s have much less chances to merge with their host galaxies than the satellites of spirals. Perhaps, among a primordial population of isolated S0s covering a full range of satellite velocity dispersions the host galaxies with the lower satellite velocity dispersions have become spirals, and only the host galaxies with the high satellite velocity dispersions preventing their numerous minor mergers remain still S0s.
7 Conclusions
We have studied the stellar population properties along the radius up to several scale lengths of the disks in 15 S0 galaxies spread over a range of luminosities (though all are more luminous than and ) and settling in different environments.
For the large-scale stellar disks of the galaxies, we have found metallicities from the solar one down to [Z/H], elevated magnesium-to-iron ratios, [Mg/Fe], and mostly old ages. Nine of 15 galaxies have large-scale disks older than 10 Gyr, which includes all the galaxies from the sample which reside in dense environments. The isolated and some loose-group galaxies have intermediate-age(7-8 Gyr) stellar disks, and only two galaxies, NGC 4111 and NGC 7332, demonstrate the SSP-equivalent ages of their disks of 2–3 Gyr. Just these two young disks have appeared to be thin, and the other, old, disks have scale heights typical for thick stellar disks.
We conclude that S0 galaxies are the primordial type of disk galaxies largely shaped by , especially those found in clusters today. Some rejuvenation of the disks, but mostly of the bulges, is possible later for some, but not all, lenticular galaxies. The bulges are almost always coeval or are younger than the disks. Spiral galaxies may form from lenticulars at by accreting external cold gas into their disks; in dense environments cold gas deficiency exists so the most primordial lenticulars in dense environments remain S0s up to now being the dominant galaxy population in the galaxy clusters at .
Despite apparent homogeneity of the S0 morphological type (‘smooth red diskbulge systems…’), the glance ‘in depth’ reveals very large scatter of main structural and evolutionary properties even among lenticular galaxies of the same luminosity: S0s may be disk- or bulge-dominated galaxies (van den Bergh, 1976; Kormendy & Bender, 2012), with exponential or de Vaucouleurs’-like surface brightness profiles of the bulges, and all the intermediate values of the Sersic parameter can be met too (Laurikainen et al., 2010); and the stellar population of the bulges spans the full range of ages – Morelli et al. (2008), and also this paper. This diversity provokes a suggestion that S0 galaxies may be formed through different evolutionary channels; and many theoretical suggestions provide a variety of possible physical mechanisms of S0 shaping (see Introduction). However, properties of stellar populations, especially in the outer parts of S0 galaxies less suffering from secular evolution (influencing mainly the central parts of galaxies) can restrict strongly the possible scenaria of S0 galaxy formation. Namely, the old ages and high magnesium-to-iron ratios of the large-scale stellar disks of S0s exclude evidently their (trans-)formation from spirals at intermediate redshifts, . We have now in hand some hints on the ages larger than 10 Gyr in many large-scale disks of S0 galaxies, especially those populating dense environments: our sample studied in the present paper reveals a majority of old disks, but it is very small and spread over various environment types; and also the recent results by Roediger et al. (2011) for the Virgo 53 S0s give the mean age of their (inner and) outer parts of Gyr. If the tendency for the outer disks of S0s to be old is confirmed, all the scenaria which suggest spiral galaxy transformation into S0s in clusters and rich groups at intermediate redshifts would be disproved. What then remains? Only turbulent unstable starforming thick gaseous disks at (Bournaud et al., 2009) which might leave thick quiescent stellar disks after a brief effective starforming epoch, and perhaps also gas-rich major mergers, if they occur at in future cluster environments (Bois et al., 2011); and subsequent evolution with episodic rejuvenation according to our scenario proposed above. However, to make more certain conclusions, further investigations of the stellar population properties in the outer parts of lenticular galaxies are quite necessary.
Acknowledgments
We thank V. L. Afanasiev, A. V. Moiseev, and S. S. Kaisin for fulfilling some of the observations which data are used in this work. The 6m telescope is operated under the financial support of Science Ministry of Russia (registration number 01-43). We are grateful to N. Ya. Sotnikova for proposing a sample of edge-on lenticular galaxies for the observations. During our data analysis we used the Lyon-Meudon Extragalactic Database (LEDA) supplied by the LEDA team at the CRAL-Observatoire de Lyon (France) and the NASA/IPAC Extragalactic Database (NED) operated by the Jet Propulsion Laboratory, California Institute of Technology under contract with the National Aeronautics and Space Administration. This research is partly based on SDSS data. Funding for the Sloan Digital Sky Survey (SDSS) and SDSS-II has been provided by the Alfred P. Sloan Foundation, the Participating Institutions, the National Science Foundation, the U.S. Department of Energy, the National Aeronautics and Space Administration, the Japanese Monbukagakusho, and the Max Planck Society, and the Higher Education Funding Council for England. The SDSS Web site is http://www.sdss.org/. The study is supported by the grant of the Russian Foundation for Basic Researches number 10-02-00062a.
References
- Afanasiev & Moiseev (2005) Afanasiev V.L., Moiseev A.V., 2005, Astronomy Letters, 31, 194
- Allanson et al. (2009) Allanson S. P., Hudson M. J., Smith R. J., Lucey J. R., 2009, ApJ, 702, 1275
- Annibali et al. (2010) Annibali F., Grutzbauch R., Rampazzo R., Bressan A., Zeilinger W. W., 2011, A& A, 528, id.A19
- Baes et al. (2007) Baes M., Sil’chenko O.K., Moiseev A.V., Manakova E.A., 2007, A& A, 467, 991
- Baggett et al. (1998) Baggett W.E., Baggett S.M., Anderson K.S.J., 1998, AJ, 116, 1626
- Beasley et al. (2004) Beasley M., Brodie J.P., Strader J., et al., 2004, AJ,128, 1623
- Bedregal et al. (2011) Bedregal A. G., Cardiel N., Aragon-Salamanca A., Merrifield M. R., 2011, MNRAS, 415, 2063
- Bekki & Couch (2011) Bekki K., Couch W. J., 2011, MNRAS, 415, 1783
- Bernkopf & Fuhrmann (2006) Bernkopf J., Fuhrmann K., 2006, MNRAS, 369, 673
- Bois et al. (2011) Bois M., Emsellem E., Bournaud F., Alatalo K., Blitz L., et al., 2011, MNRAS, 416, 1654
- Bothun & Gregg (1990) Bothun G.D., Gregg M.D., 1990, ApJ, 350, 73
- Bournaud et al. ( 2007) Bournaud F., Elmegreen B. G., Elmegreen D. M., 2007, ApJ, 670, 237
- (13) Bournaud F., Daddi E., Elmegreen B. G., Elmegreen D. M., Nesvadba N., et al., 2008, A& A, 486, 741
- Bournaud et al. ( 2009) Bournaud F., Elmegreen B. G., Martig M., 2009, ApJ, 707, L1
- Bruce et al. (2012) Bruce V.A., Dunlop J.S., Cirasuolo M., McLure R.J., Targett T.A., et al., 2012, MNRAS, in press, arXiV/astro-ph:1206.4322.
- Burgess (1958) Burgess A., 1958, MNRAS, 118, 477
- Burstein et al. (2005) Burstein D., Ho L. C., Huchra J. P., Macri L. M., 2005, ApJ, 621, 246
- Buta & Williams (1995) Buta R., Williams K.L., 1995, AJ, 109, 543
- Byrd & Valtonen (1990) Byrd G., Valtonen M., 1990, ApJ, 350, 89
- Cabrera-Lavers et al. (2005) Cabrera-Lavers A., Garzón F., Hammersley P. L., 2005, A& A, 433, 173
- Caldwell (1983) Caldwell N., 1983, ApJ, 268, 90
- Cappellari et al. (2011) Cappellari M., Emsellem E., Krajnovic D., McDermid R. M., Serra P., et al., 2011, MNRAS, 416, 1680
- Ceverino et al. (2010) Ceverino D., Dekel A., Bournaud F., 2010, MNRAS, 404, 2151
- Chitre & Jog (2002) Chitre A., Jog C.I., 2002, A& A, 388, 407
- Cowie & Songaila (1977) Cowie L.L., Songaila A., 1977, Nature, 226, 501
- Dekel & Birnboim (2006) Dekel A., Birnboim Yu., 2006, MNRAS, 368, 2
- de Souza et al. ( 2004) de Souza R.E., Gadotti D.A., dos Anjos S., 2004, ApJS, 153, 411
- Dressler (1980) Dressler, A., 1980, ApJ, 236, 351
- Dressler et al. (1997) Dressler A., Oemler A. Jr., Couch W. J., Smail I., Ellis R.S., et al., 1997, ApJ, 490, 577
- Elmegreen et al. (2005) Elmegreen D.M., Elmegreen B.G., Rubin D. S., Schaffer M. A., 2005, ApJ, 631, 85
- Elmegreen et al. (2007) Elmegreen D.M., Elmegreen B.G., Ravindranath S., Coe D.A., 2007, ApJ, 658, 763
- Elmegreen et al. (2008) Elmegreen B.G., Bournaud F., Elmegreen D.M., 2008, ApJ, 688, 67
- Erwin et al. (2008) Erwin P., Pohlen M., Beckman J.E., 2008, AJ, 135, 20
- Eskridge et al. (2002) Eskridge P.B., Frogel J.A., Pogge R.W., Quillen A.C., Berlind A.A., et al., 2002, ApJ Suppl., 143, 73
- Fasano et al. (2000) Fasano G., Poggianti B.M., Couch W.J., Bettoni D., Kjaergaard P., Moles M., 2000, ApJ, 542, 673
- (36) Fisher D., Franx M., Illingworth G., 1996, ApJ, 459, 110
- Fisher & Drory (2008) Fisher D.B., Drory N., 2008, AJ, 136, 773
- Forster Schreiber et al. (2011) Forster Schreiber N. M., Shapley A. E., Genzel R., Bouché N., Cresci G., et al., 2011, ApJ, 739, Aid45
- Fuhrmann (2008) Fuhrmann K., 2008, MNRAS, 384, 173
- Fuhrmann (2011) Fuhrmann K., 2011, MNRAS, 414, 2893
- Garcia (1993) Garcia A.M., 1993, A& A Suppl. Ser., 100, 47
- Genel et al. (2012) Genel S., Naab T., Genzel R., Forster Schreiber N., Sternberg A., et al., 2012, ApJ, 745, Aid11
- Genzel et al. (2008) Genzel R., Burkert A., Bouché N., Cresci G., Forster Schreiber N. M., et al., 2008, ApJ, 687, 59
- Gorgas et al. ( 2007) Gorgas J., Jablonka P., Goudfrooij P., 2007, A& A, 474, 1081
- Graham & Worley (2008) Graham A. W., Worley C. C., 2008, MNRAS, 388, 1708
- Gunn & Gott (1971) Gunn J.E., Gott J.R., 1971, ApJ, 176, 1
- Hopkins et al. (2012) Hopkins Ph.F., Keres D., Murray N., Quataert E., Hernquist L., 2012, arXiv1111.6591
- Howell (2005) Howell J.H., 2005, AJ, 130, 2065
- Hubble (1926) Hubble E., 1926, ApJ, 64, 321
- Hubble (1936) Hubble E.P., 1936, The Realm of the Nebulae (New Haven: Yale Univ. Press)
- Icke (1985) Icke V., 1985, A& A, 144, 115
- Ilyina & Sil’chenko (2012) Ilyina M.A., Sil’chenko O.K., 2012, Astronomy Reports, 56, 578
- Jansen et al. (2000) Jansen R.A., Fabricant D., Franx M., Caldwell N., 2000, ApJS 126, 331
- Just et al. (2010) Just D.W., Zaritsky D., Sand D.J., Desai V., Rudnick G., 2010, ApJ, 711, 192
- Kannappan et al. (2009) Kannappan S.J., Guie J.M., Baker A.J., 2009, AJ, 138, 579
- (56) Karachentseva V. E., Karachentsev I. D., Shcherbanovsky A.L., 1979, Astrofizicheskie Issledovaniia, 11, 3
- (57) Karachentseva V. E., Karachentsev I. D., Melnyk O. V., 2011, Astrophys. Bull., 66, 389
- Koo et al. (2005a) Koo D. C., Datta S., Willmer Ch. N. A., Simard L., Tran K.-V., Im M., 2005, ApJ, 634, L5
- Koo et al. (2005b) Koo D. C., Simard L., Willmer Ch. N. A., Gebhardt K., Bouwens R. J., et al., 2005, ApJS, 157, 175
- Kormendy & Bender (2012) Kormendy J., Bender R., 2012, ApJS, 198, 2
- Kronberger et al. (2008) Kronberger T., Kapferer W., Ferrari C., Unterguggenberger S., Schindler S., 2008, A& A, 481, 337
- Larson et al. (1980) Larson R.B., Tinsley B.M., Caldwell C.N., 1980, ApJ, 237, 692
- Laurikainen et al. ( 2005) Laurikainen E., Salo, H., Buta R., 2005, MNRAS, 362, 1319
- Laurikainen et al. (2010) Laurikainen E., Salo H., Buta R., Knapen J.H., Comeron S., 2010, MNRAS, 405, 1089
- MacArthur et al. (2004) MacArthur L. A., Courteau S., Bell E., Holtzman J.A., 2004, ApJS, 152, 175
- Mahdavi & Geller (2004) Mahdavi A., Geller M. J., 2004, ApJ, 607, 202
- Makarov & Karachentsev (2011) Makarov D., Karachentsev I., 2011, MNRAS, 412, 2498
- Mehlert et al. (2003) Mehlert D., Thomas D., Saglia R. P., Bender R., Wegner G., 2003, A& A, 407, 423
- Moore et al. (1996) Moore B., Katz N., Lake G., Dressler A., Oemler A., 1996, Nature, 379, 613
- Morelli et al. (2008) Morelli L., Pompei E., Pizzella A., Méndez-Abreu J., Corsini E. M., et al., 2008, MNRAS, 389, 341
- Mosenkov et al. ( 2010) Mosenkov A. V., Sotnikova N. Ya., Reshetnikov V. P., 2010, MNRAS, 401, 559
- (72) Mosenkov A. V., Sotnikova N. Ya., 2011, private communication
- Naim et al. (1995) Naim A., Lahav O., Buta R. J., Corwin H. G. Jr., de Vaucouleurs G., et al., 1995, MNRAS, 274, 1107
- Noguchi (1999) Noguchi M., 1999, ApJ, 514, 77
- Norris et al. (2006) Norris M. A., Sharples R. M., Kuntschner H., 2006, MNRAS, 367, 815
- Osmond & Ponman (2004) Osmond J.P.F., Ponman T.J., 2004, MNRAS, 350, 1511
- Peletier & Balcells (1996) Peletier R.F., Balcells M., 1996, AJ, 111, 2238
- Peng et al. (2002) Peng C. Y., Ho L. C., Impey Ch. D., Rix H.-W., 2002, AJ, 124, 266
- Pohlen & Trujillo (2006) Pohlen M., Trujillo I., 2006, A&A, 454, 759
- Postman & Geller (1984) Postman M., Geller M.J., 1984, ApJ, 281, 95
- Prochaska Chamberlain et al. (2011) Prochaska Chamberlain L. C., Courteau S., McDonald M., Rose J. A., 2011, MNRAS, 412, 423
- Proctor & Sansom (2002) Proctor R. N., Sansom A. E., 2002, MNRAS, 333, 517
- Quilis et al. (2000) Quilis V., Moore B., Bower R., 2000, Science, 288, 1617
- Roediger et al. (2011) Roediger J. C., Courteau S., MacArthur L. A., McDonald M., 2011, MNRAS, 416, 1996
- Sánchez-Blázquez et al. (2006) Sánchez-Blázquez P., Forbes D. A., Strader J., Brodie J., Proctor R., 2006, MNRAS, 377, 759
- Schuster et al. (2006) Schuster W. J., Moitinho A., Marquez A., Parrao L., Covarrubias E., 2006, A& A, 445, 939
- Seifert & Scorza (1996) Seifert W., Scorza C., 1996, A& A, 310, 75
- Shaya & Tully (1984) Shaya E.J. & Tully R.B., 1984, ApJ, 281, 56
- Sil’chenko (2000) Sil’chenko O.K., 2000, AJ, 120, 741
- Sil’chenko (2006) Sil’chenko O.K., 2006, ApJ, 641, 229
- Sil’chenko (2008) Sil’chenko O.K., 2008, In: Formation and Evolution of Galaxy Bulges, Proc. of the IAU Symp. 245, p. 277
- Sil’chenko & Afanasiev (2004) Sil’chenko O.K., Afanasiev V.L., 2004, AJ, 127, 2641
- Sil’chenko & Afanasiev (2006) Sil’chenko O.K., Afanasiev V.L., 2006, Astronomy Letters, 32, 534
- Simard et al. (2009) Simard L., Clowe D., Desai V., Dalcanton J. J., von der Linden A., et al., 2009, A&A, 508, 1141
- Smith et al. (2009) Smith R. J., Lucey J. R., Hudson M. J., Allanson S. P., Bridges T. J., et al., 2009, MNRAS, 392, 1265
- Spitzer & Baade (1951) Spitzer L. Jr., Baade W., 1951, ApJ, 113, 413
- Spolaor et al. (2010) Spolaor M., Kobayashi Ch., Forbes D., Couch W.J., Hau G.K.T., 2010, MNRAS, 408, 272
- Startseva et al. ( 2009) Startseva M.A., Sil’chenko O.K., Moiseev A.V., 2009, Astronomy Reports, 53, 1101
- Stasinska & Sodré (2001) Stasinska G., Sodré I.,Jr. 2001, A&A, 374, 919
- Thomas et al. ( 2003) Thomas D., Maraston C., Bender R., 2003, MNRAS, 339, 897
- Thomas et al. (2005) Thomas D., Maraston C., Bender R., Mendes de Oliveira C., 2005, ApJ, 621, 673
- Tonry et al. (2001) Tonry J.L., Dressler A., Blakeslee J.P., Ajhar E.A., Fletcher A.B., et al., 2001, ApJ, 546, 681
- Tully (1988) Tully R.B., 1988, Nearby Galaxies Catalogue (Cambridge: Cambridge Univ. Press)
- van den Bergh (1976) van den Bergh, S., 1976, ApJ, 206, 883
- van den Bergh (2009) van den Bergh, S., 2009, ApJ, 694, 120
- van den Bergh et al. (1996) van den Bergh S., Abraham R. G., Ellis R. S., Tanvir N. R., Santiago B. X., Glazebrook K. G., 1996, AJ, 112, 359
- Whitmore et al. (1990) Whitmore B.C., Lucas R.A., McElroy D.B., et al. 1990, AJ, 100, 1489
- Williams et al. ( 2010) Williams M. J., Bureau M., Cappellari M., 2010, MNRAS, 409, 1330
- Wilman et al. (2009) Wilman D.J., Oemler A., Mulchaey J.S., McGee S.L., Balogh M.L., Bower R.G., 2009, ApJ, 692, 298
- Worthey (1994) Worthey G., 1994, ApJS, 95, 107
- Worthey et al. (1994) Worthey G., Faber S.M., González J.J., Burstein D., 1994, ApJS, 94, 687
- Yoachim & Dalcanton (2008) Yoachim P., Dalcanton J.J., 2008, ApJ, 682, 1004
- Zaritsky et al. ( 1994) Zaritsky D., Kennicutt R.C. Jr., Huchra J.P., 1994, ApJ, 420,87