Broadband nulling behaviour of PSR B2319+60
Abstract
Pulse nulling is one of many single pulse phenomena exhibited by radio pulsars. The broadband nature of this phenomena remained unexplained due to lack of coordinated observations. We are reporting broadband nulling behaviour of a well known nulling pulsar PSR B2319+60. The simultaneous observations were carried out at four different frequencies using the Giant Meterwave Radio telescope (325 and 610 MHz), the Westerbork Synthesis Radio Telescope (1420 MHz) and the Effelsberg radio telescope (5100 MHz). The nulling fractions were estimated at all four observed frequencies, which suggest similar degree of nulling across these frequencies. To comment on the broadband behaviour of pulse nulling, we calculated the Pearson cross-correlation coefficients for the occurrence of null and burst pulses between all four frequencies. We conclude that nulling is largely a broadband phenomenon for this pulsar and it points towards a global failure of the magnetospheric currents which produces radio emission at these frequencies.
1 Introduction
Pulsar nulling is one of many single pulse phenomena exhibited by radio pulsars. A pulsar is said to null when it shows no emission for several periods before abruptly resuming its normal pulsation. Previous studies tried to relate nulling to pulsar ages and the profile morphology, but no clear correlation exists. Hence, no conclusive model can be given to explain the cause of nulling in pulsars.
The hypotheses regarding the pulse nulling can be divided into two groups. Theories regarding the missing sight-lines and/or partial illumination of the radio beam Herfindal & Rankin (2007, 2009) suggest geometric effects as the cause of pulsar nulling. Alternatively, intrinsic effects like complete cessation of pair production at polar gap, loss of coherence and/or break in the two stream instabilities can also cause the pulsar to null. Filippenko & Radhakrishnan (1982); Cheng & Ruderman (1980).
Pulsar emission at various radio frequencies comes from different heights. Hence, the geometry of emitting regions are expected to be completely different for different frequencies. The broadband nature of nulling phenomena can shed light on the possible hypotheses regarding the occurrence of nulling in pulsars. If the pulsar emission gets extinguished at the polar cap then one would expect its effect at all the radio frequencies. Earlier reported broadband nature of nulling behaviour suggest that nulling does not always occur simultaneously at all frequencies Bhat et al. (2007); Davies et al. (1984). However, Bhattacharyya et al. (2008) has reported correlated nulling in their multifrequency observations (at 325 and 610 MHz) of B082634. Hence, the question of broadband behaviour of pulse nulling remains open due to lack of such coordinated observations. More nulling pulsars need to be studied with higher sensitivity for this purpose.
Observations of PSR B2319+60, carried out simultaneous at four different frequencies (i.e. 325, 610, 1420 and 5100 MHz) using three different telescopes (i.e. Giant Meterwave Radio Telescope; GMRT, Westerbork Synthesis Radio Telescope; WSRT and Effelsberg), are presented in this paper.
2 Observations and Analysis
The observations of PSR B2319+60 were carried out at the GMRT simultaneously at 325 and 610 MHz. The antennae were divided into two separate sub-arrays, one at each frequency. The signal were processed by the GMRT software backend, which is a fully software base real-time backend with 33.33 MHz of instantaneous bandwidth Roy et al. (2010). The data were recorded in the total intensity mode with nearly 1 millisecond integration time for both the frequencies. Data were converted to SIGPROC111http://sigproc.sourceforge.net filterbank format during the off-line processing. At WSRT222Authors would like to thank Roy Smits for the valuable support during the WSRT observations and off-line data reduction.,the pulsar was observed at the central frequency of 1420 MHz with 160 MHz of total bandwidth using standard WSRT Pulsar Machine (PuMa). For these observations, we initially recorded data with upgraded PuMa II in a raw voltage mode with full polarizations at the Nyquist sampling rate. In offline processing, data were averaged to effective sampling time of around 1 millisecond with total intensity before the conversion to SIGPROC filterbank format. At Effelsberg333Authors would also like to thank Ramesh Karuppusamy, Joris Verbiest and David Champion for the valuable support during the Effelsberg observations., our observations were carried out at 5100 MHz with total 500 MHz of observing bandwidth. We recorded the data in total intensity mode with the effective integration time of around 1 millisecond. PSRFFTS pulsar search receiver directly generated data in the standard SIGPROC filterbank format.
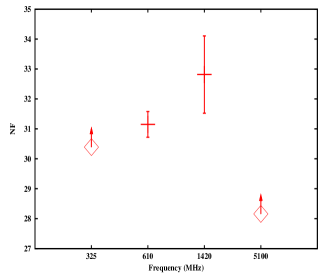
The data were dedispersed using the normal DM of 94.6 pccm-3Hobbs et al. (2004) for this pulsar at all observed frequencies. The dedispersed time series were further aligned after correcting the dispersion delay between the four observed frequencies. Only the aligned time series were used for further analysis. The on-pulse energies of these aligned time series are shown in Figure 1, which clearly shows correlated nulling. The nulling fraction (NF) were estimated using the method described in Gajjar et al. (2012) and are shown in Figure 1 at all four observed frequencies. It was possible to obtain meaningful NF only at 610 and 1420 MHz, while lower limits were estimated at 325 and 5100 MHz using the method described in Gajjar et al. (2012). The estimated NF and the lower limits on the NFs from Figure 1 clearly shows that the degree of nulling at four observing frequencies are consistent with each other within the error bars.

The signal to noise ratio (S/N) was sufficient to identify single pulses at observing frequencies of 610 and 1420 MHz. We identified individual null and burst pulses from the observed sequence of single periods. To compare the time scale of nulling at these two frequencies, the null length histograms (NLHs) and the burst length histograms (BLHs) were obtained as described in Gajjar et al. (2012). The NLH (and BLH) at 610 and 1420 MHz were compared using the standard two sample Kolmogrov-Smirnove (KS) test. The null hypotheses assumes that both the distributions (i.e. NLH or BLH obtained at two frequencies) come from different populations. The KS-test comparison with NLH at 1420 MHz and 610 MHz rejected the null hypotheses with 95% significance. Similarly, the BLH comparison rejected the null hypotheses with significance of 97 %. These tests again demonstrated the high degree of correlated nulling between 610 and 1420 MHz. It was not possible to build the NLH and BLH at 325 and 5100 MHz because of the lower S/N.


To correlate the occurrence of nulling across all four frequencies, we compared individual pulse nulling by carrying out a cross-correlation test as follows. As mentioned above, the S/N were low for many single pulses at 325 and 5100 MHz which makes it difficult to separate the low energy pulses from the null pulses. To avoid any wrong identification, we used two different thresholds to separate the null and burst pulses as shown in the on-pulse histogram of Figure 2. Pulses below the lower threshold were consider as null pulses and tagged as 0s, while the pulses above the higher threshold were confirmed as burst pulses and tagged as 1s. The pulses between these two threshold were low energy pulses and were tagged as 2s. After separating the pulses in these three groups, we formed a zero-one-two series from the order of their observed occurrence which is also shown in Figure 2. As these time series are aligned in time, a cross-correlation test between them will check the simultaneity of null and burst pulses. We carried out a Pearson correlation coefficient comparison test between various frequency pairs. Only those pulses were used in correlation test which were tagged as either 0s or 1s at both the frequencies. Pulses which were tagged as 2s were excluded from the correlation test. The Pearson correlation coefficients between various frequency pairs are shown in Table 1. It can be seen from the Table 1 that all pairs of frequencies show high value of cross-correlation coefficient. This suggest highly correlated pulse nulling across all observed frequencies.
| Freq(MHz) | 610 | 1420 | 5100 |
|---|---|---|---|
| 325 | 0.93 | 0.91 | 0.81 |
| 610 | 0.99 | 0.86 | |
| 1420 | 0.85 |
3 Discussion and conclusions
We have carried out simultaneous multifrequency observations of PSR B2319+60 at four different frequencies. Comparison of NFs and length of nulls suggest highly correlated nulling behaviour. We have shown that PSR B2319+60 shows high degree of correlated nulling across wide range of frequencies using the Pearson cross-correlation test. Geometric reasons are not sufficient to explain the correlated nulling across wide range of frequencies. Hence, our observations suggests the global failure of magnetospheric currents as a more likely cause of pulse nulling in this pulsar.
References
- Bhat et al. (2007) Bhat, N. D. R., Gupta, Y., Kramer, M., Karastergiou, A., Lyne, A. G., & Johnston, S. 2007, A&A, 462, 257. arXiv:astro-ph/0610929
- Bhattacharyya et al. (2008) Bhattacharyya, B., Gupta, Y., & Gil, J. 2008, MNRAS, 383, 1538. 0711.0526
- Cheng & Ruderman (1980) Cheng, A. F., & Ruderman, M. A. 1980, ApJ, 235, 576
- Davies et al. (1984) Davies, J. G., Lyne, A. G., Smith, F. G., Izvekova, V. A., Kuzmin, A. D., & Shitov, Y. P. 1984, MNRAS, 211, 57
- Filippenko & Radhakrishnan (1982) Filippenko, A. V., & Radhakrishnan, V. 1982, ApJ, 263, 828
- Gajjar et al. (2012) Gajjar, V., Joshi, B. C., & Kramer, M. 2012, MNRAS, 424, 1197. 1205.2550
- Herfindal & Rankin (2007) Herfindal, J. L., & Rankin, J. M. 2007, MNRAS, 380, 430
- Herfindal & Rankin (2009) — 2009, MNRAS, 393, 1391. 0802.0881
- Hobbs et al. (2004) Hobbs, G., Lyne, A. G., Kramer, M., Martin, C. E., & Jordan, C. 2004, MNRAS, 353, 1311
- Roy et al. (2010) Roy, J., Gupta, Y., Pen, U.-L., Peterson, J. B., Kudale, S., & Kodilkar, J. 2010, Experimental Astronomy, 28, 25. 0910.1517