Space-Charge Effects in an Ungated GEM-based TPC 111This work has been supported by the Framework Program of the EU, the German Bundesministerium für Bildung und Forschung and the DFG Cluster of Excellence “Origin and Structure of the Universe”.
Abstract
A fundamental limit to the application of Time Projection Chambers (TPCs) in high-rate experiments is the accumulation of slowly drifting ions in the active gas volume, which compromises the homogeneity of the drift field and hence the detector resolution. Conventionally, this problem is overcome by the use of ion-gating structures. This method, however, introduces large dead times and restricts trigger rates to a few hundred per second. The ion gate can be eliminated from the setup by the use of Gas Electron Multiplier (GEM) foils for gas amplification, which intrinsically suppress the backflow of ions. This makes the continuous operation of a TPC at high rates feasible.
In this work, Monte Carlo simulations of the buildup of ion space charge in a GEM-based TPC and the correction of the resulting drift distortions are discussed, based on realistic numbers for the ion backflow in a triple-GEM amplification stack. A TPC in the future p anda experiment at FAIR, in which interaction rates up to will be reached, serves as an example for the experimental environment. The simulations show that space charge densities up to are reached, leading to electron drift distortions of up to . The application of a laser calibration system to correct these distortions is investigated. Based on full simulations of the detector physics and response, we show that it is possible to correct for the drift distortions and to maintain the good momentum resolution of the GEM-TPC.
keywords:
Time Projection Chamber , Gas Electron Multiplier , particle tracking , ion backflow , space charge , drift distortions , laser calibration1 Introduction
A Time Projection Chamber (TPC) [1] can be regarded as an almost ideal device for charged-particle tracking. A large number of 3-dimensional hits measured along a particle track (typ. –) eases the task of pattern recognition in a dense environment and allows particle identification (PID) via the measurement of specific ionization. Large solid-angle coverage combined with very little material in the active part of the detector makes this device very attractive for applications in which high resolution is to be combined with small photon conversion probability and little multiple scattering. TPCs have been successfully used as large volume tracking devices in many particle physics experiments, e. g. PEP-4 [2], TOPAZ [3], DELPHI [4], ALEPH [5], NA49 [6], STAR [7], CERES [8] and ALICE [9].
In its standard form, a TPC consists of a large gas-filled cylindrical vessel sorrounding the interaction point, placed inside a solenoidal magnetic field to measure the momentum of charged particles [10]. The passage of an ionizing particle through the TPC produces a trace of electron-ion pairs. A uniform electric field along the cylinder axis (“drift field”), created by the two endcaps and a field cage made of azimuthal metallic strips on the cylinder walls maintained at a linearly decreasing potential, separates positive gas ions and electrons. The ionization electrons then drift towards the readout anode located at one endcap of the cylinder. The transverse diffusion, which can become quite large for drift distances of the order of , is reduced by the magnetic field parallel to the drift direction. At the endcap, a plane of proportional wires is conventionally used for avalanche multiplication of ionization electrons. The signals induced on an arrangement of pad electrodes provide a measurement of the track projection onto the endplate. The third coordinate of the track is extracted from the measurement of the drift times of the ionization electrons. The reconstruction of a track from the measured data requires a precise knowledge of the drift of electrons and hence of the electric and magnetic fields in the chamber.
Electrons have drift velocities of the order of several and are thus quickly removed from the drift volume. The drift velocity of ions, however, is three to four orders of magnitude smaller (see Table 1 for the values used for our simulations), leading to a slow buildup of space charge in the chamber. There are two principal sources of ions in a TPC:
-
1.
Gas ionization by fast charged particles traversing the drift volume: The created ions slowly drift towards the cathode end-plate of the TPC.
-
2.
Avalanche multiplication: During avalanche amplification, a large amount of electron-ion pairs are created, given by the total gain , which is typically of the order of to . Without further measures, the ions created in the amplification process would move back into the drift volume and lead to significant distortions of the electric field.
The total amount of charge accumulated in the drift volume depends on the rate and momentum distribution of the incident particles, the properties of the gas, and the amount of ions from the avalanche region drifting back into the drift volume. To prevent avalanche ions from reaching the drift volume, TPCs are normally operated in a pulsed mode, where an electrostatic gate to the readout region is opened only when an interaction in the target has occurred, and is closed immediately thereafter [10]. The time needed to remove the ions as well as the switching time of the gate constitute dead times for the experiments, which limit the trigger rates to several hundred per second.
Modern particle physics experiments, in contrast, require high interaction and trigger rates and little or no dead time of the detector systems. In order to benefit from the advantages of a TPC in a high-rate experiment, one has to find other means of space charge suppression. As an alternative to ion gating, the usage of Gas Electron Multipliers (GEMs) [11] for gas amplification has been proposed, since these devices feature an intrinsic suppression of the ion back-drift [12, 13]. Operating a TPC at interaction rates which are large compared to the inverse drift time of electrons – which is of the order of for typical drift distances of – means that several events will be overlapping in one drift frame. The TPC hence acts as an “analog track pipeline” with signals arriving continuously at the readout pads. Instead of an event-based, triggered readout, the appropriate readout mode of such a device is then a continuous electronic sampling of signals combined with an autonomous detection of hits, which are further processed based on their individual time stamps. The association of these hits to tracks and of tracks to distinct physics events (“event deconvolution”) requires real-time tracking capabilities of the data acquisition system. The successful development of a continuously running TPC, though challenging, opens the possibility to benefit from the advantages of such a detector in future high-rate experiments.
Among other options, a GEM-based TPC was proposed as the central tracker of the experiment p anda (Antiproton Annihilations at Darmstadt) experiment [14] at the future international Facility for Antiproton and Ion Research (FAIR). p anda will use an intense, cooled antiproton beam with momenta from to impinging on different targets and will reach luminosities up to , resulting in a interaction rate up to . The dimensions of the p anda GEM-TPC are shown in Fig. 1. It consists of cylindrical vessel with length and an inner (outer) radius of () with GEM amplification at the upstream endcap [15], placed in a solenoidal magnetic field. Owing to the fixed-target geometry of the experiment, the interaction point is not located in the middle of cylinder axis, but shifted upstream. The TPC was shown to provide excellent standalone pattern recognition and momentum resolution of the order of a few percent [16]. The ungated, continuous operation mode of the TPC at the envisaged event rates at p anda gives rise to about tracks which are superimposed in the drift volume at any given time.

Track densities similar to this environment are expected for the ALICE TPC after an upgrade of the LHC, foreseen for the year 2018. At an expected luminosity for Pb-Pb collisions of , a continuous readout of the TPC is required in order to make full use of the interaction rate of about . This cannot be achieved with the present gated MWPC-based amplification system. A replacement by a triple-GEM amplification using large-size foils is currently under evaluation.
The ion leakage from a multi-GEM detector, however, is considerably larger than that from a closed gating grid, which is typically [9]. It is therefore important to develop an understanding of the effects of residual space charge in a GEM-based, continuously running TPC. To this end, we have developed a computer simulation of space charge accumulation and drift distortions for a GEM-based TPC. The simulation is based on the following steps:
-
1.
transport particles from minimum bias physics events through the detector setup and calculate their energy loss;
-
2.
model the drift of ions to obtain the spatial distribution of space charge;
-
3.
calculate the resulting electric field in the drift volume using finite element methods;
-
4.
solve the drift equation for electrons in electric and magnetic fields to get a map of drift distortions as a function of the point of generation;
-
5.
simulate a laser calibration system to measure the drift distortions.
Section 2 describes the detector setup and defines the parameters used in the simulations. In Sec. 3 we describe how the charge accumulation is modeled to derive a space charge distribution in the drift volume of the TPC. Section 4 details how drift distortions in the inhomogeneous drift fields are calculated. Values for expected drift distortions in the simulated p anda environment are given. Finally, in Sec. 5 we demonstrate how the drift distortions can be measured and corrected by means of an array of ionizing laser beams.
2 Ion Backflow in a GEM-based TPC
The Gas Electron Multiplier (GEM) [11] consists of a thin insulating Polyimide foil with Cu-coated surfaces, typically thick. The foil is perforated by photo-lithographic processing, forming a dense, regular pattern of (double-conical) holes. For standard GEM foils, the holes have an inner diameter of and a pitch of . The small dimensions of the amplification structures lead to very large field strengths ) inside the holes of the GEM foil when a moderate voltage difference of typically – is applied between the metal layers, sufficient for avalanche creation inside the GEM holes.
The dynamics of charge movement and avalanche creation inside the GEM holes are complicated. Figure 2 shows a Garfield / Magboltz [17] simulation qualitatively explaining the suppression of ion backflow from the amplification region. Two electrons (light lines) are guided into the GEM hole by the drift field (here: ), and produce avalanches by ionizing gas molecules (dots). The ions created in the avalanches (dark lines) closely follow the electric field lines because of their much smaller diffusion. Most of the ions are collected on the top side of the GEM foil, because the field inside the GEM hole is much higher than the field above the hole. Only a few ions drift back into the drift volume. The extraction of electrons from the hole is facilitated by a higher transfer field below the GEM (here: ).
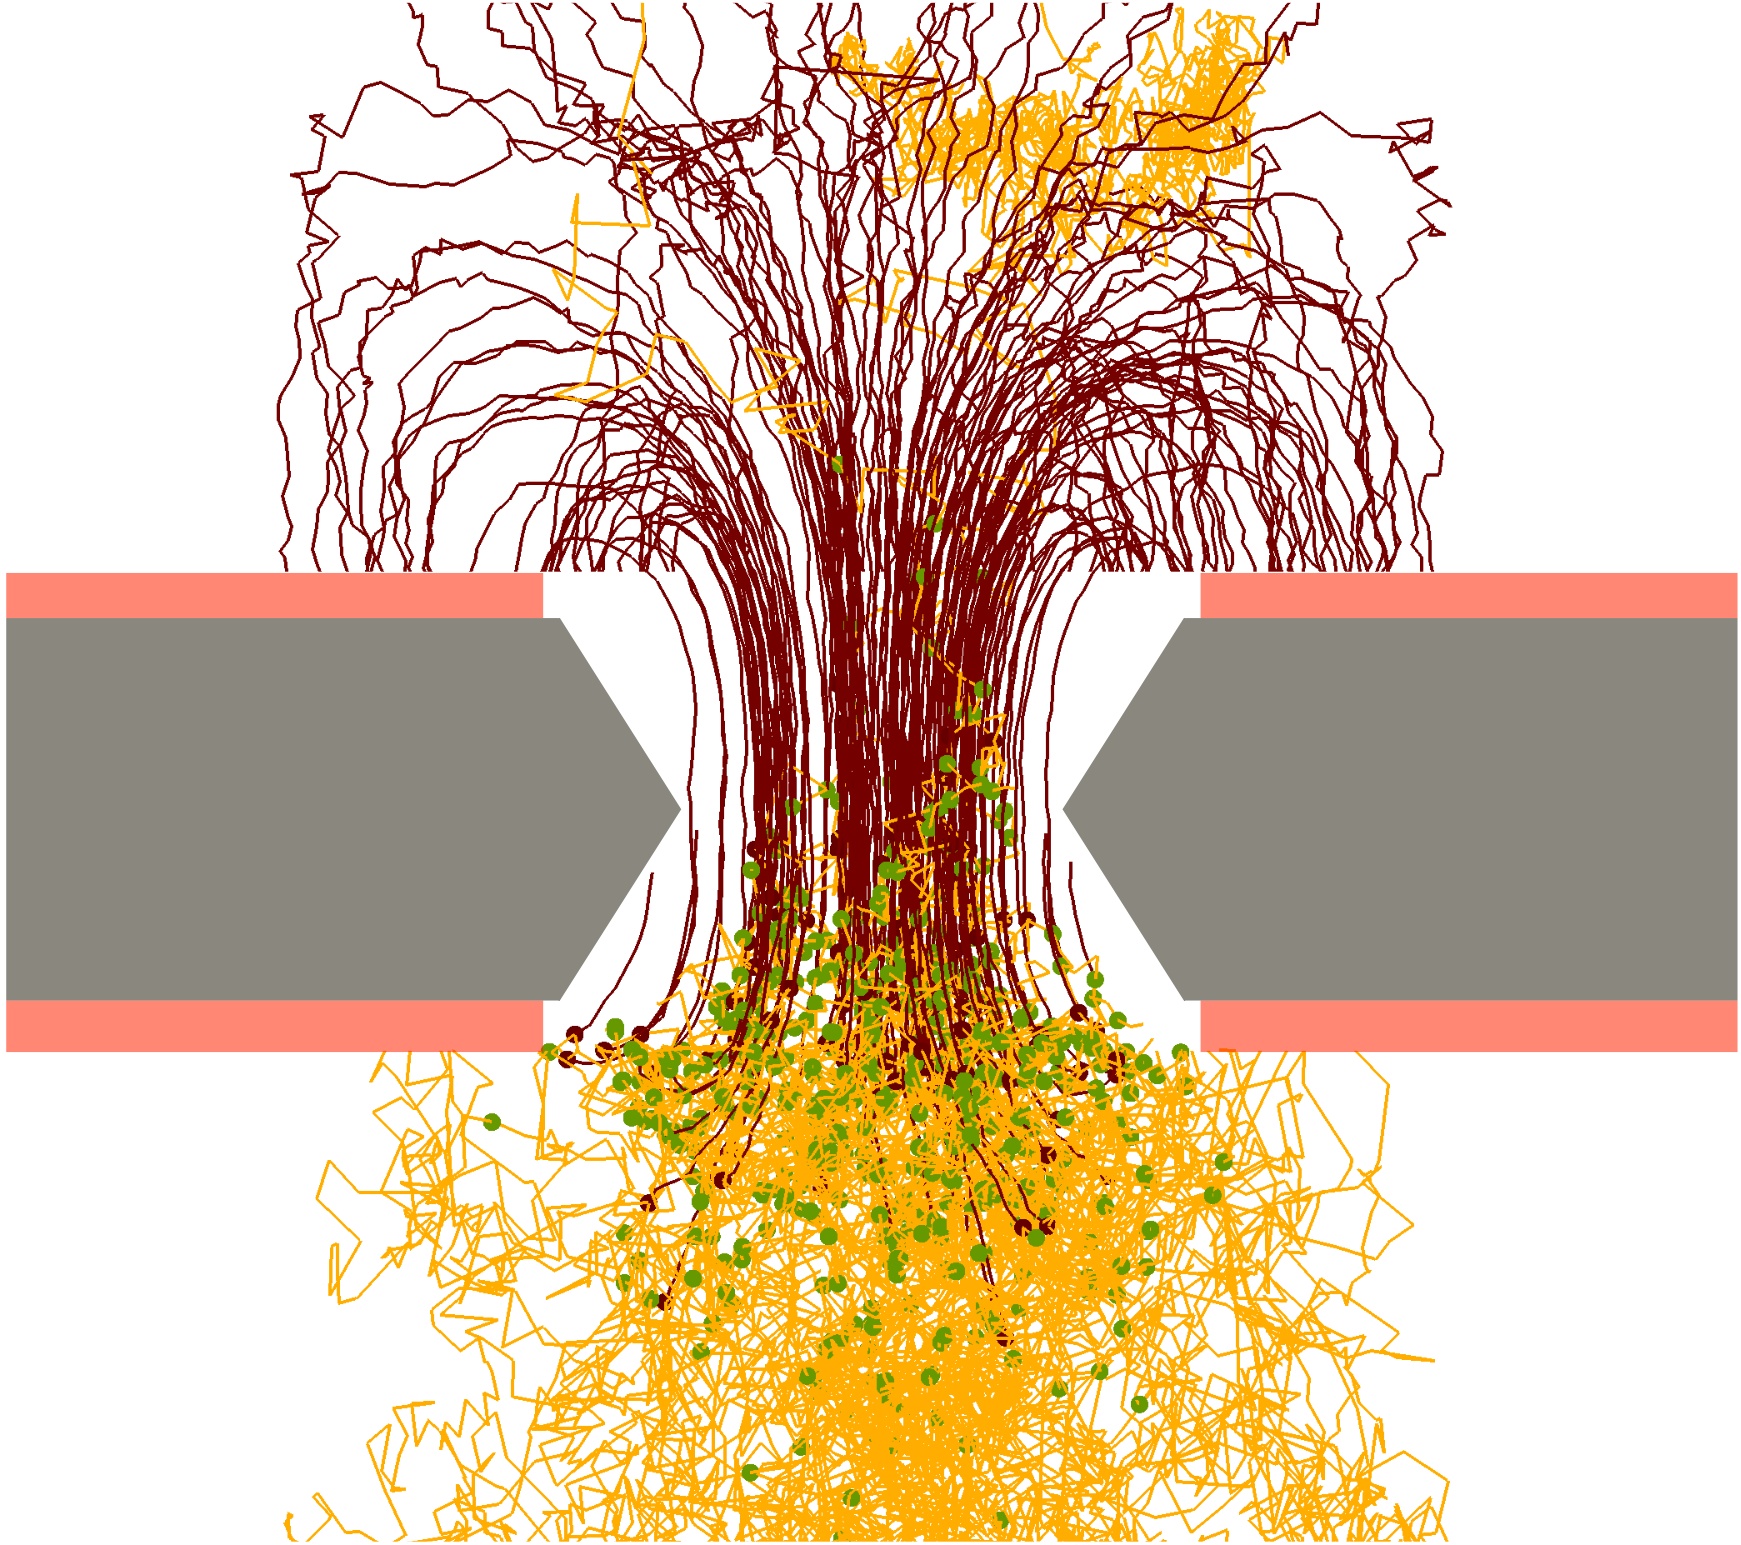
The electrons can then be transferred to another amplification stage or collected at the anode.
Typically three GEM foils are combined in a stack, leading to effective gains of the order of – and at the same time guaranteeing a stable operation without the occurrence of discharges [18]. The effective gain of the gas amplification system is given by the average number of electrons arriving at the readout anode divided by the number of ionization electrons :
| (1) |
Gas ionization produces an equal amount of electrons and ions, hence . The effective gain differs from the intrinsic gas gain of the amplification stage, as it already includes losses due to limited electron collection or extraction efficiencies of the foils. These, as well as gain fluctuations, have not been explicitly simulated in the present work.
We define the ion backflow as222We choose this quantity over other definitions in the literature since it can be easily measured via the ratio of cathode to anode current.
| (2) |
where denotes the number of positive ions arriving at the drift cathode. Note that this quantity also includes a contribution from ions created during the ionization process. Ion backflow values of have been reached experimentally in a magnetic field of in an Ar/CH4/CO2 (93/5/2) mixture [19].
A very convenient parameter to describe the ion backflow in the simulation is the ratio of the number of ions drifting back from the GEM amplification stage and the number of ionization electrons :
| (3) |
Since the number of ions arriving at the drift cathode is given by the sum of ions from ionization and the ones from the amplification stage,
| (4) |
the two quantities and are linked by
| (5) |
The suppression factor defines the efficiency of ion-backflow suppression in the Gas Electron Multiplier (GEM) stack:
| (6) |
and thus
| (7) |
As a rule of thumb, a suppression factor of is usually considered necessary in order to operate a TPC without gating grid.
The detector gas is a crucial parameter for the performance of a TPC [20]. In order to minimize multiple scattering and photon conversion, as well as space charge effects, a popular choice is a Ne/CO2 (90/10) gas mixture [6, 9], which combines low diffusion even at moderate magnetic fields, low ionization density, large ion mobility and high radiation length. The results presented in this paper are based on realistic values for the ion backflow of and the effective gain of , yielding according to Eq. (5), i.e. four ions drifting back from the amplification stage per incoming electron. The full set of simulation parameters used for the presented results is summarized in Table 1.
| Event rate | |
|---|---|
| Beam momentum | GeV/ |
| Gas mixture | |
| Average energy per | |
| ion pair | |
| Nominal drift field | |
| Magnetic field | |
| Ion drift velocity | |
| Electron drift velocity | |
| Longitudinal diffusion | |
| Transverse diffusion | |
| TPC dimensions | … |
| (active volume) | … |
| Ion backflow factor |
3 Simulation of Space Charge Buildup
3.1 Ionization Charge Creation
To model the spatial distribution of ionization charge in the TPC for the case of p anda, the Dual Parton Model (DPM) [21] Monte Carlo event generator is used to simulate antiproton-proton () annihilations at an incident momentum of . The resulting phase space distribution of charged particles is shown in Fig. 3.
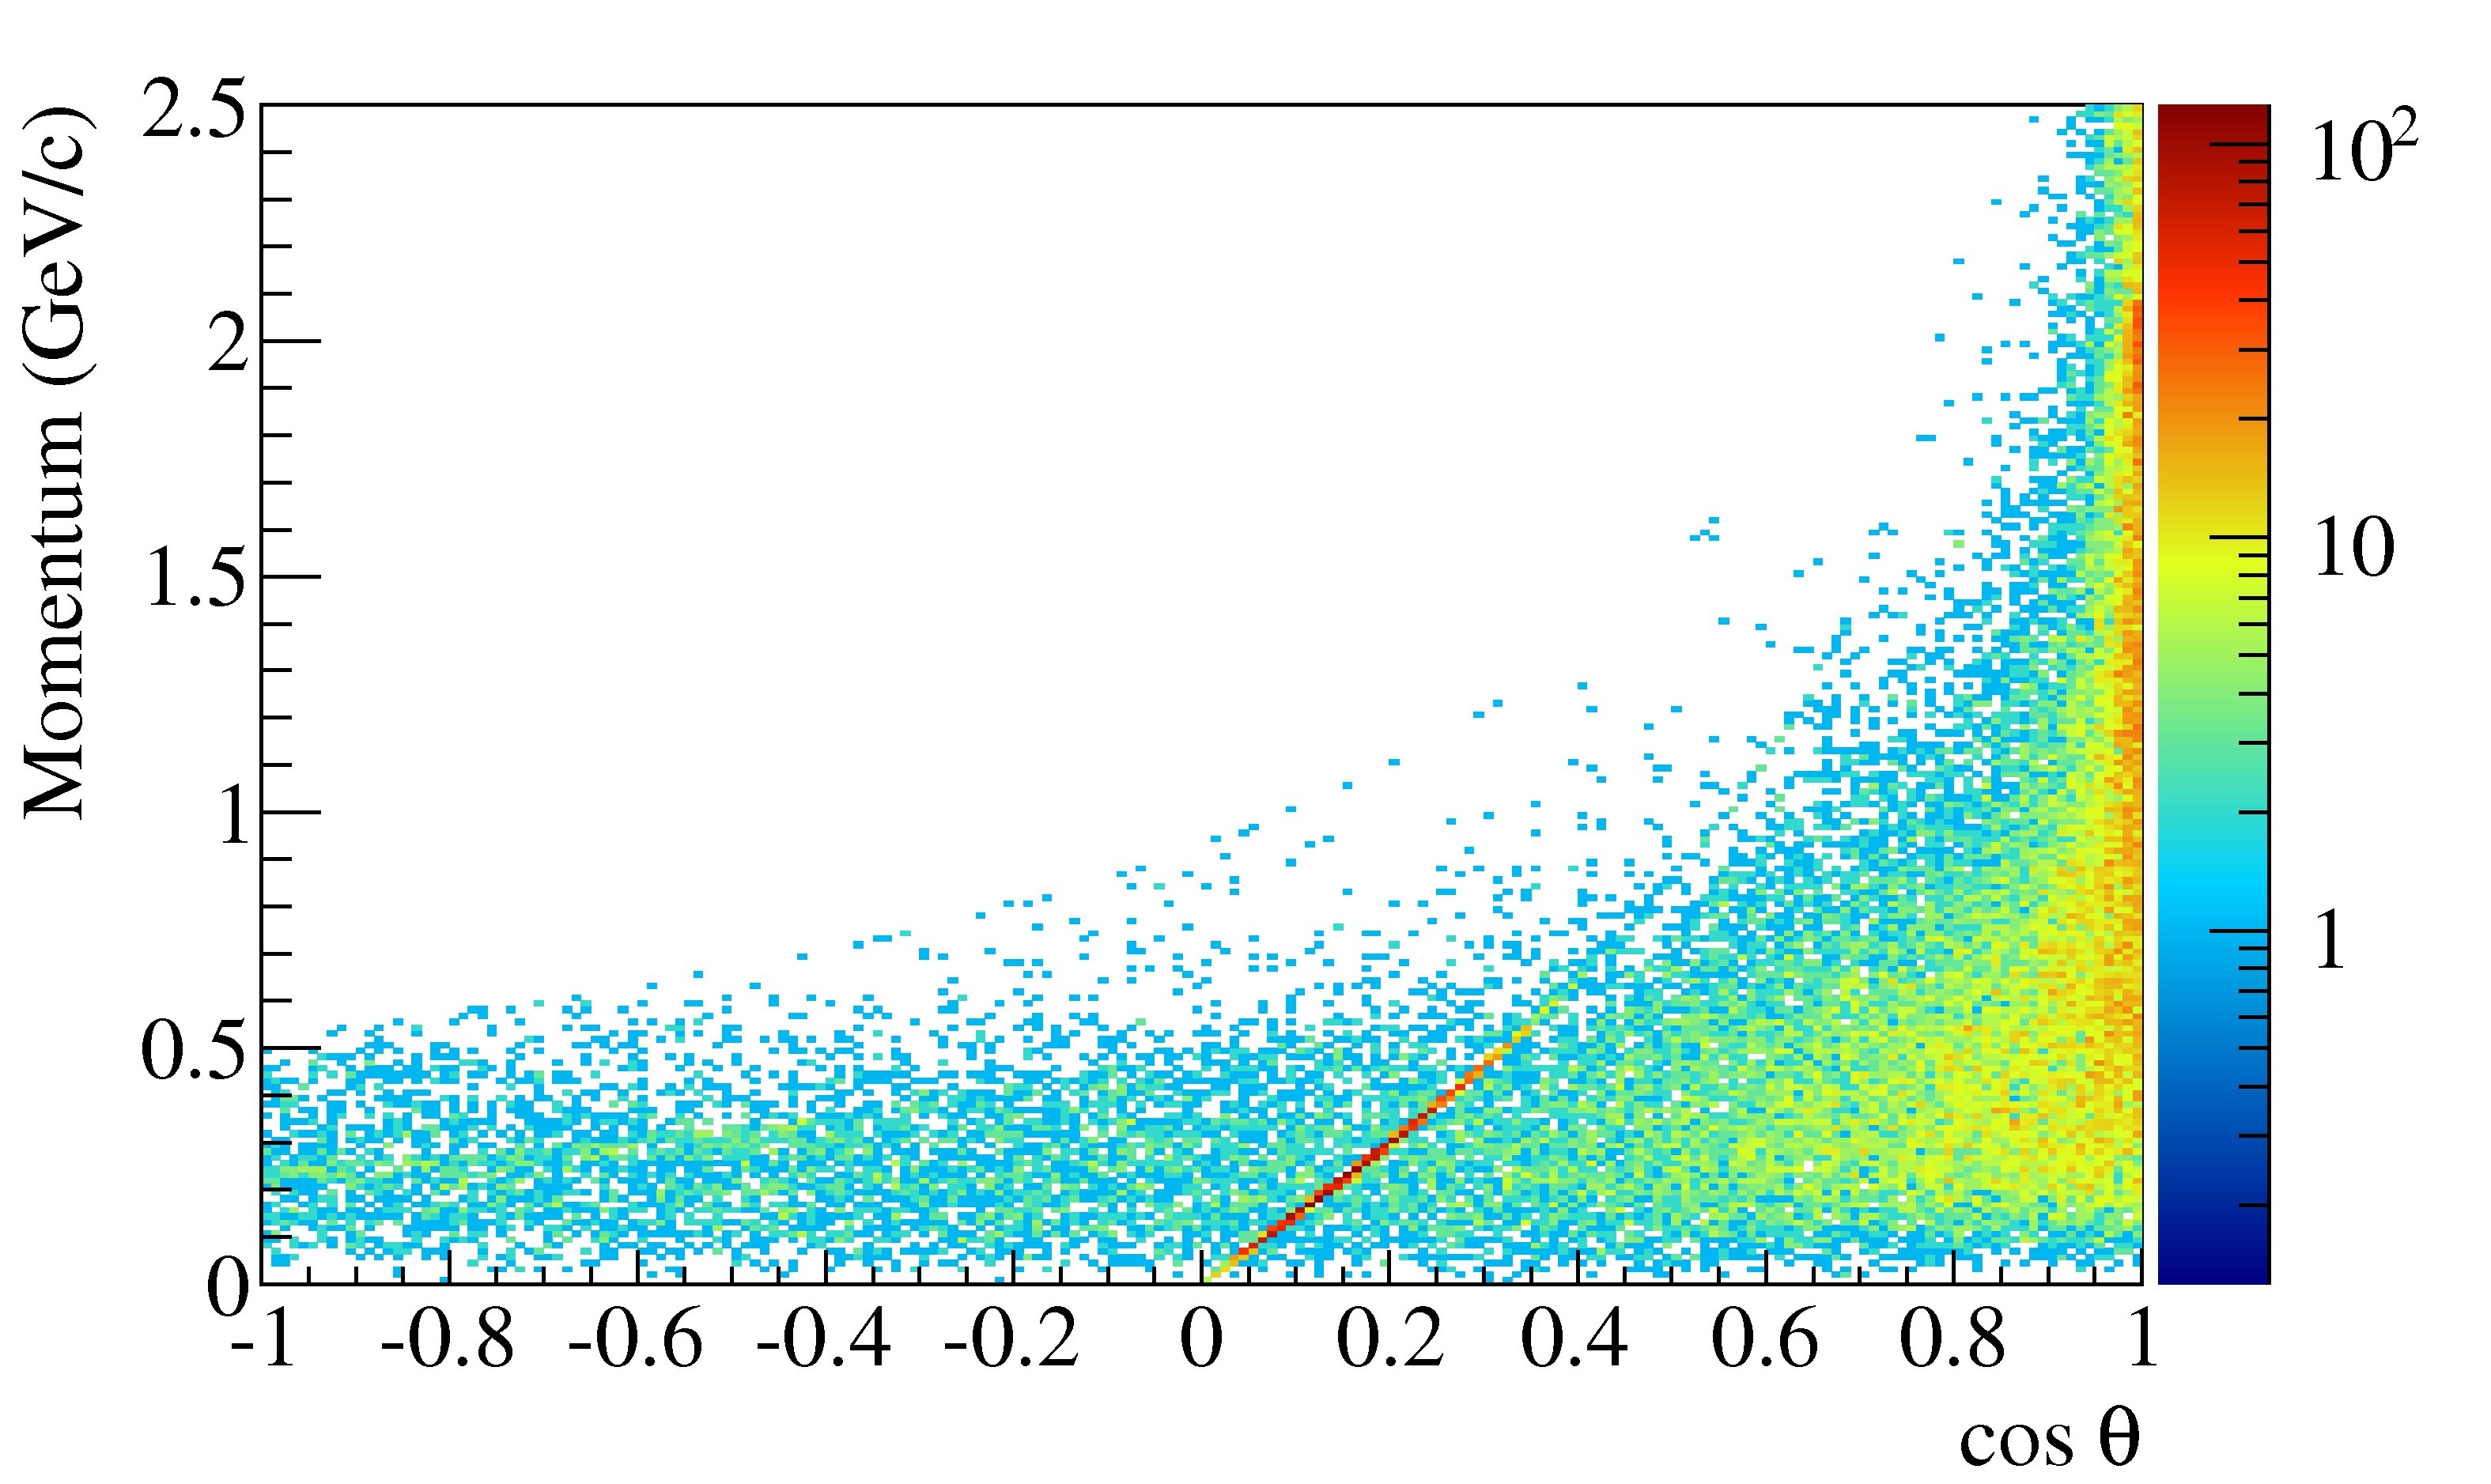
A large sample of these generated events is then passed through a GEANT [22] simulation of the detector geometry in order to calculate the energy loss of the particles in the TPC gas volume. For the simulations presented here we used GEANT3 with a simplified energy loss model as proposed in the ALICE TPC Technical Design Report [23] and experimentally verified in [24]. From the GEANT energy deposit in a volume element around a point inside the TPC, summed up for a given number of simulated events , the number of ionization electrons/ions produced in this volume element is calculated using an average energy per electron–ion pair for the Ne/CO2 (90/10) gas mixture of [25, 26]. Here, , and denote cylindrical coordinates, where the axis coincides with the symmetry axis of the TPC. The creation rate of ionization charge in is then
| (8) |
with being the event rate.
3.2 Model of Space Charge Accumulation
In general, the charge density at time in a volume element centered around a point inside the TPC volume is given by:
| (9) |
Here is the net rate of ions entering/leaving the volume element in the time interval . includes both ions directly created in gas ionization processes, , as well as ions moving through the volume surface by drift and diffusion.
Solving Eq. (9) in principle requires perfect knowledge of the dynamics of charge creation and drift/diffusion inside the TPC volume. In order to arrive at a manageable, yet sufficiently realistic simulation model, the following assumptions are made:
-
1.
Azimuthal symmetry: Owing to the cylindrical geometry of the TPC, we treat the problem in cylindrical symmetry so that the resulting charge density map can be represented in the -plane.
-
2.
Constant luminosity: We assume that , i.e. the rate of charge created in gas ionization processes is constant on time scales of interest to us []: .
-
3.
Electrostatic forces between the ions are neglected: the ion drift proceeds along straight lines with constant velocity .
-
4.
The effect of diffusion on the motion of ions is neglected.
In addition, we move from the infinitesimal volume elements of Eq. (9) to macroscopic volumes with constant bin widths and . Each such bin (,) then represents a ring-shaped volume in the TPC:
| (10) |
where and are the outer and inner radius of bin (,), respectively. The integral in Eq. (9) can then be solved numerically by a Riemann sum:
| (11) |
with the time given by the number of steps in time bins .
During each time step , the ionization charge is newly created in bin of the chamber. Now the backflow of ions from the amplification stage has to be included. As can be seen from Table 1, the drift velocity of electrons exceeds that of ions by several orders of magnitude. In order to calculate the ion space charge we can therefore assume instantaneous electron drift. As a consequence, a contribution proportional to the total amount of newly added gas ionization charge in the full TPC volume has to be added to the first bin in () for each time bin . The total number of ions added in each time step is therefore
| (12) |
with being the Kronecker delta symbol.
As a last ingredient, the drift of ions has to be taken into account. For the geometry of the p anda TPC, where the readout anode is located at the upstream endcap of the chamber, the ion drift proceeds along the positive direction towards the cathode endcap. We choose to correspond to the time needed for an ion of drift velocity to travel the distance . This allows us to include the ion drift in a time bin simply by shifting the total charge by one bin in . We therefore arrive at a recursive algorithm to calculate the space charge in the time step:
| (13) |
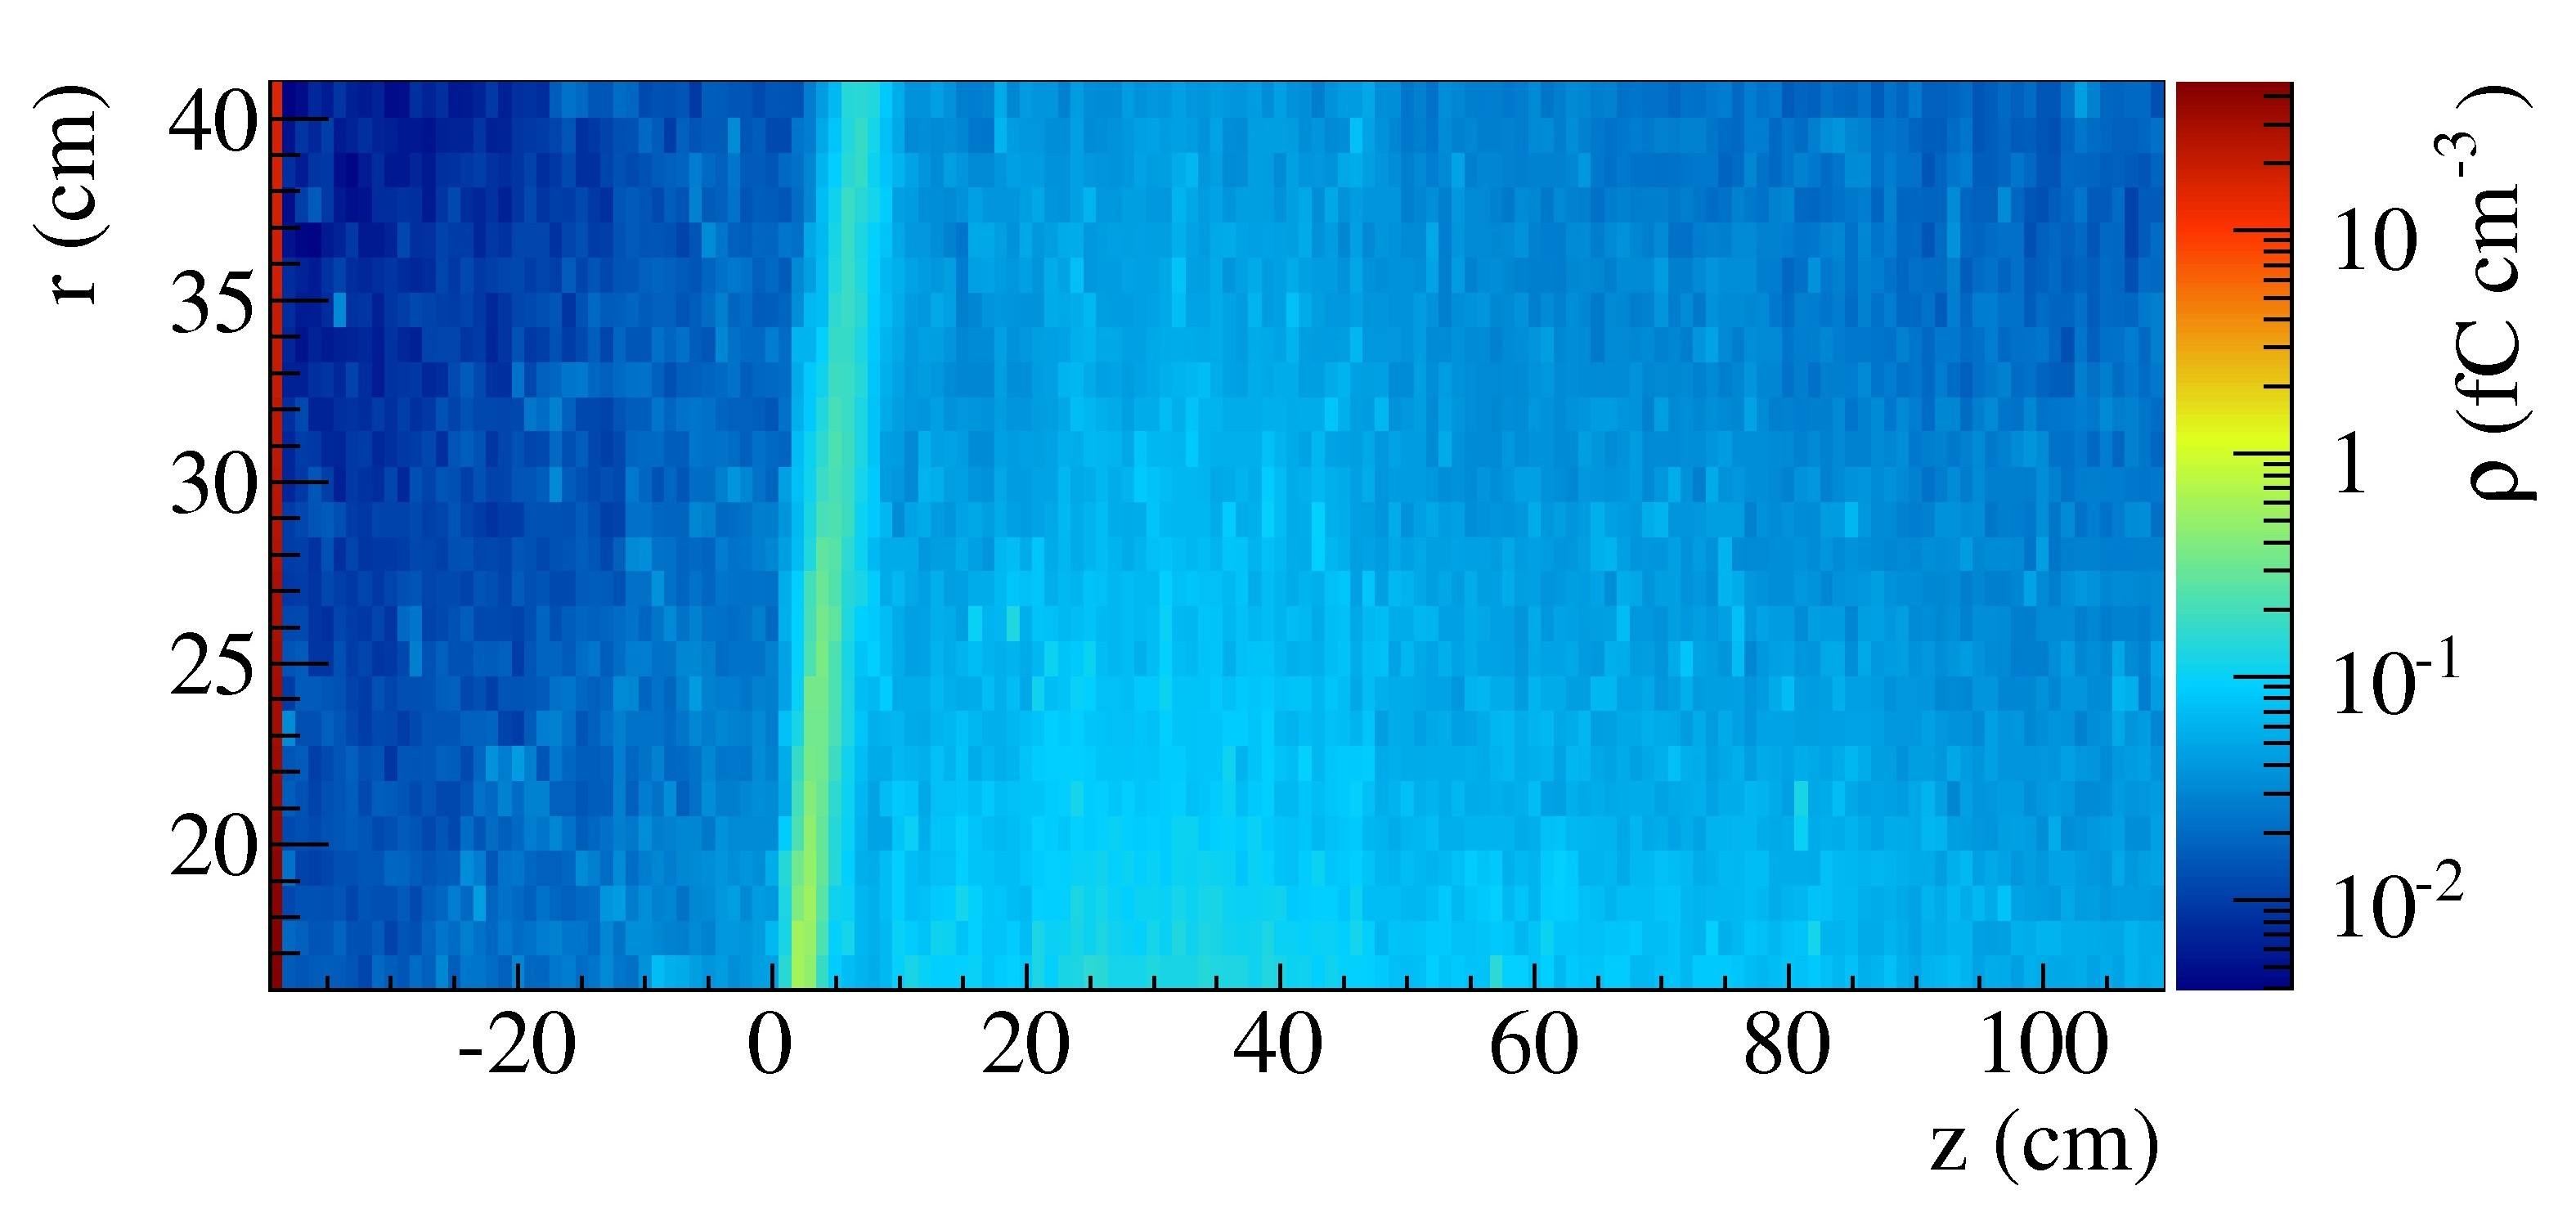
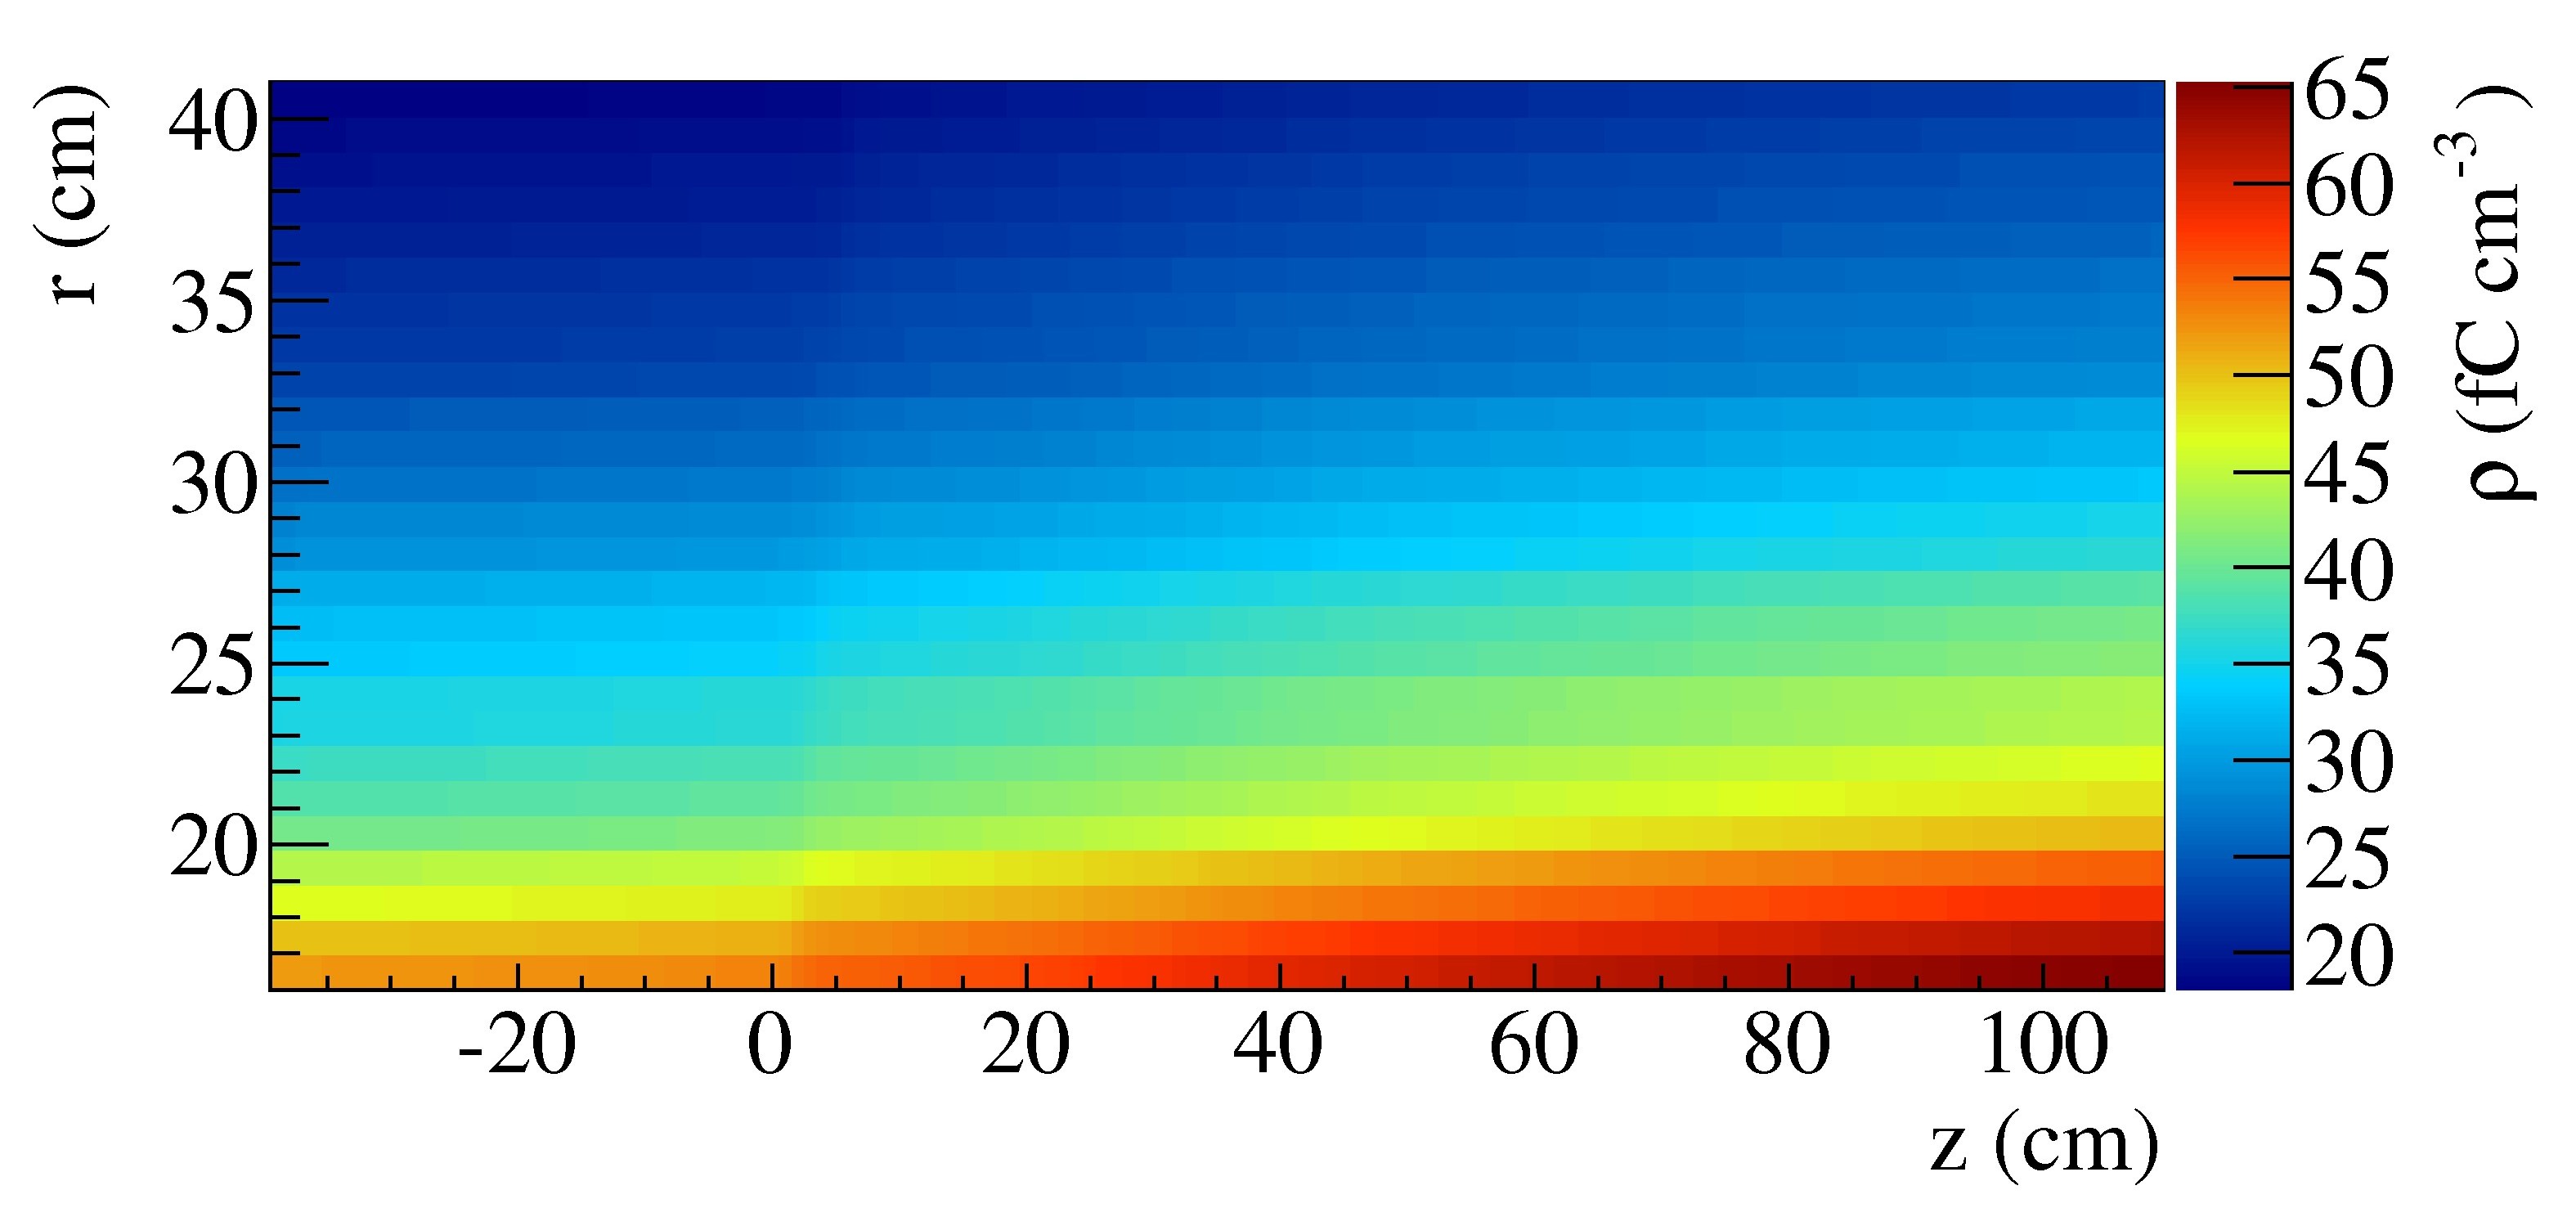
From the equations above it is clear that an equilibrium space charge in time, , will be reached everywhere in the chamber as soon as the perturbation due to ion backflow reaches the cathode, i.e. for , where is the maximum drift distance. Figure 4 shows the space charge distributions calculated with this method after the first step in time (i.e. immediately after switching on the beam) and after reaching equilibrium. The input parameters to the simulation are given in Table 1. After the first step, Fig. 4a, the distribution of ions from direct gas ionization by charged particles from annihilations with a band at a polar angle close to from elastic -scattering is visible, together with the sheet of charge at starting to drift back from the amplification region for this time bin. Due to the fixed target geometry of p anda and the resulting forward boost of the scattered particles, the charge distribution is not symmetric in around the interaction point. Figure 4b shows the equilibrium space charge distribution which is reached after ions from the amplification stage have reached the cathode. The final space charge density varies between and .
4 Drift Distortions
4.1 Electric Field due to Space Charge
From the charge-density distribution the electrostatic potential is computed by solving Poisson’s equation, which in cylindrical coordinates reads:
| (14) |
In case of rotational symmetry, , Eq. (4.1) reduces to
| (15) |
Equation (15) is solved numerically with the Finite Element Method. The corresponding variational formulation [27] is given by:
| (16) |
Here, is the drift region in the --plane, , and is an arbitrary, dimensionless test function which satisfies the same Dirichlet boundary condition as :
| (17) |
where represents the boundary of the drift region, i.e. the field cage wall. This boundary condition corresponds to a perfectly conducting field cage, such that the potential of the field-cage is fixed to zero. The software package Dolfin/FeniCs [28] is used to realize the finite element solver.
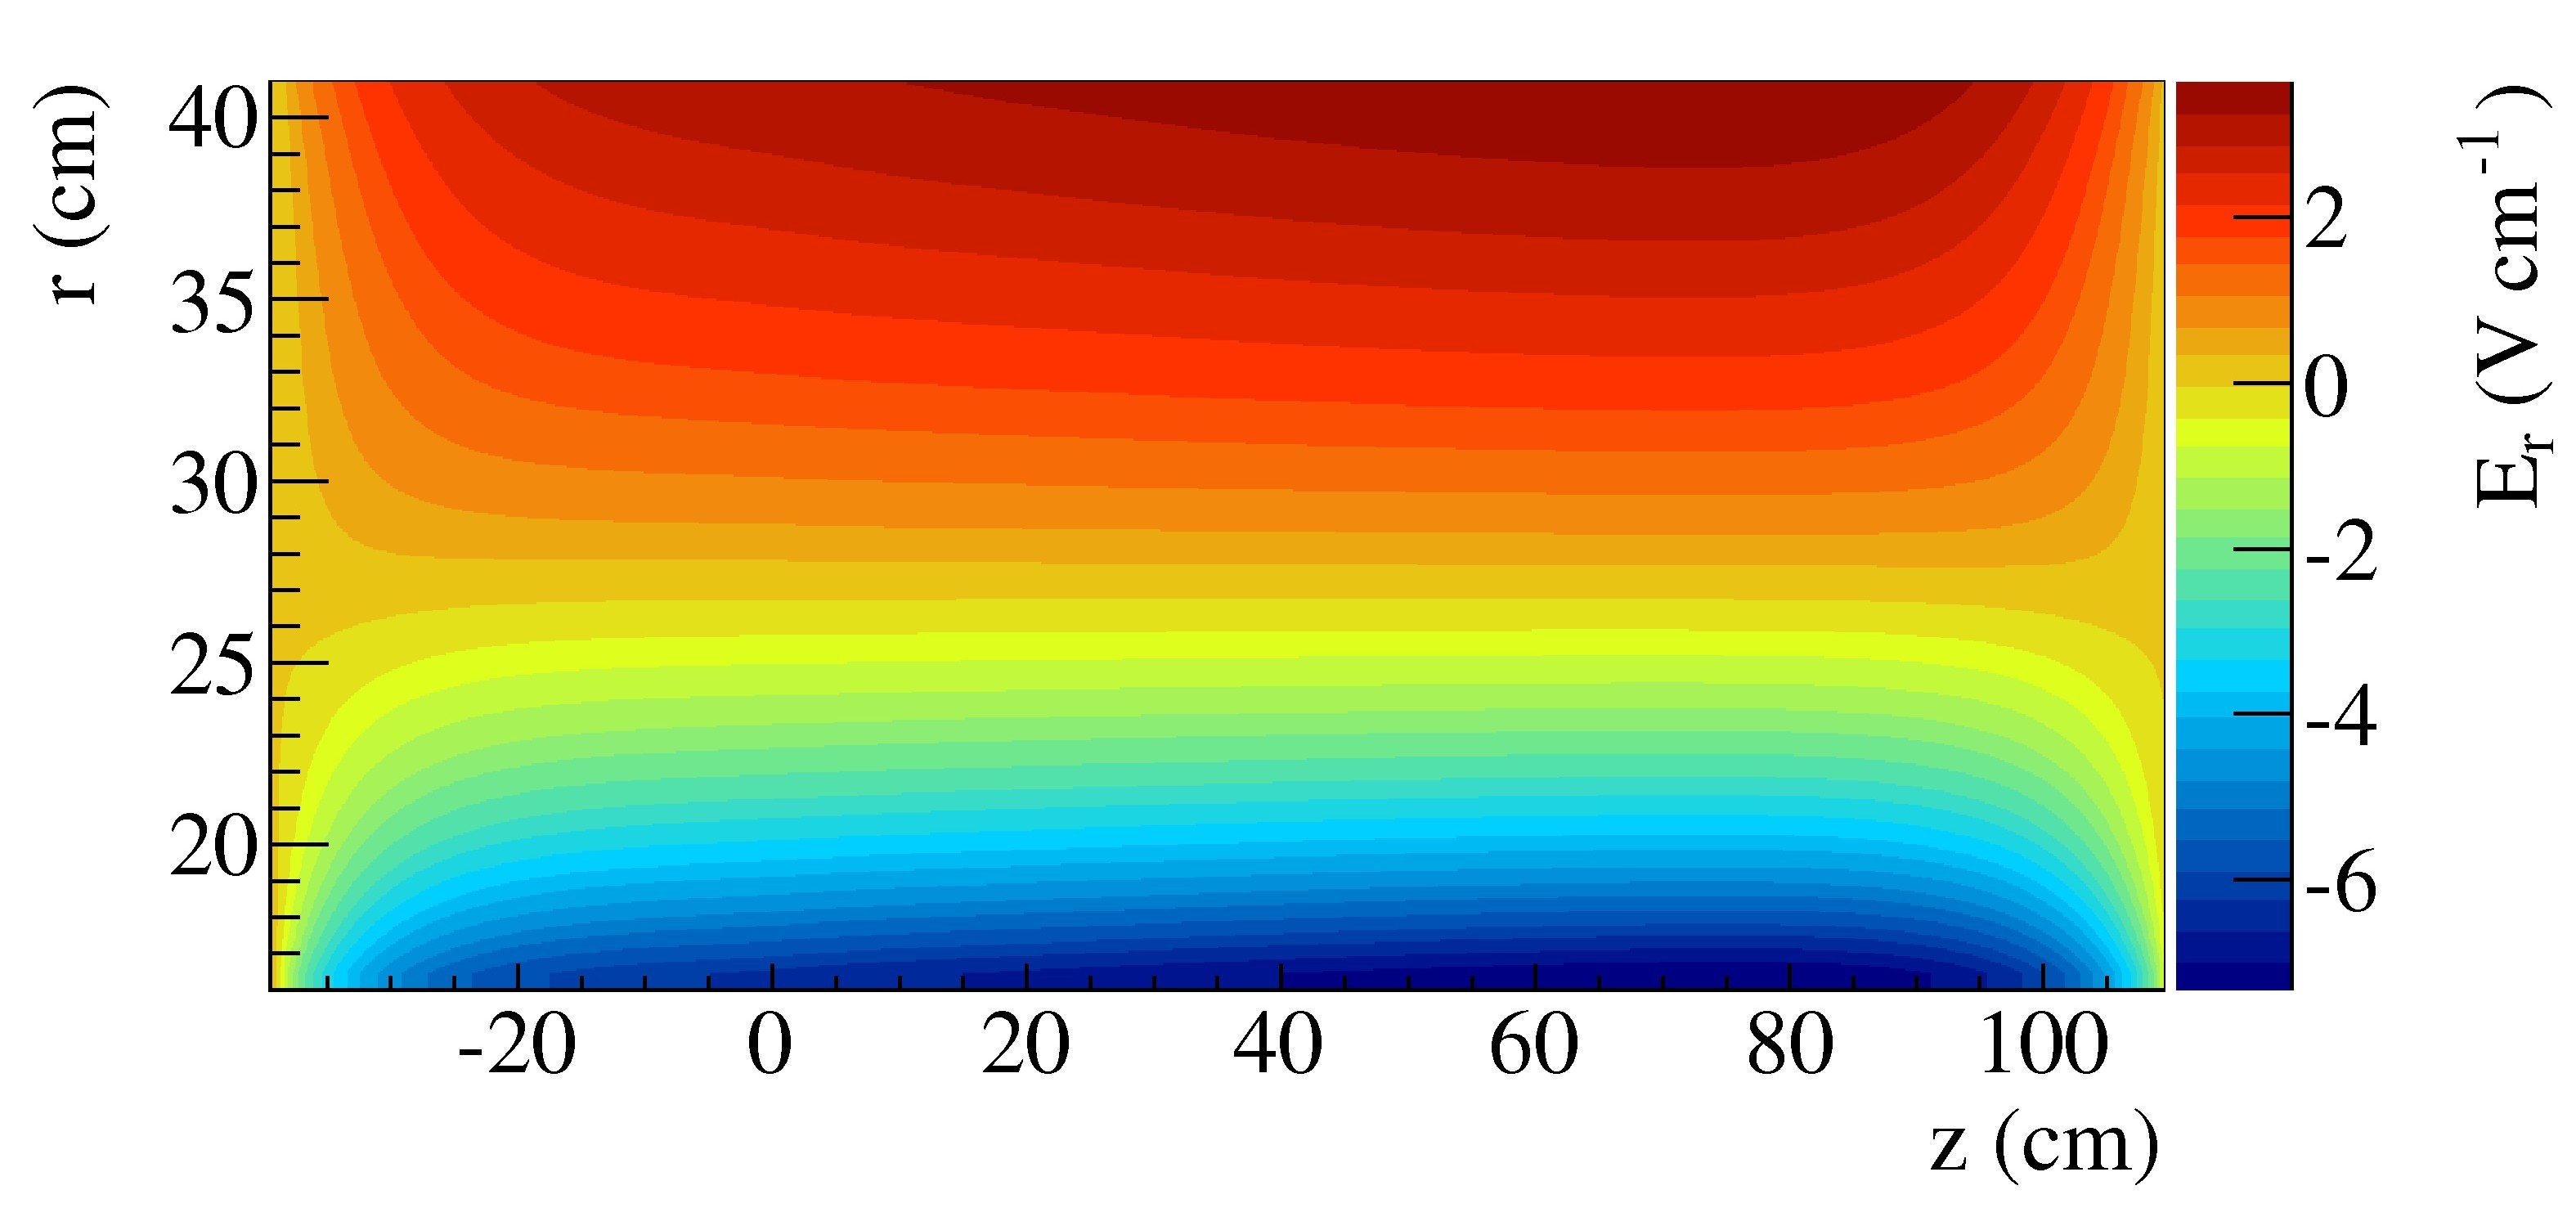
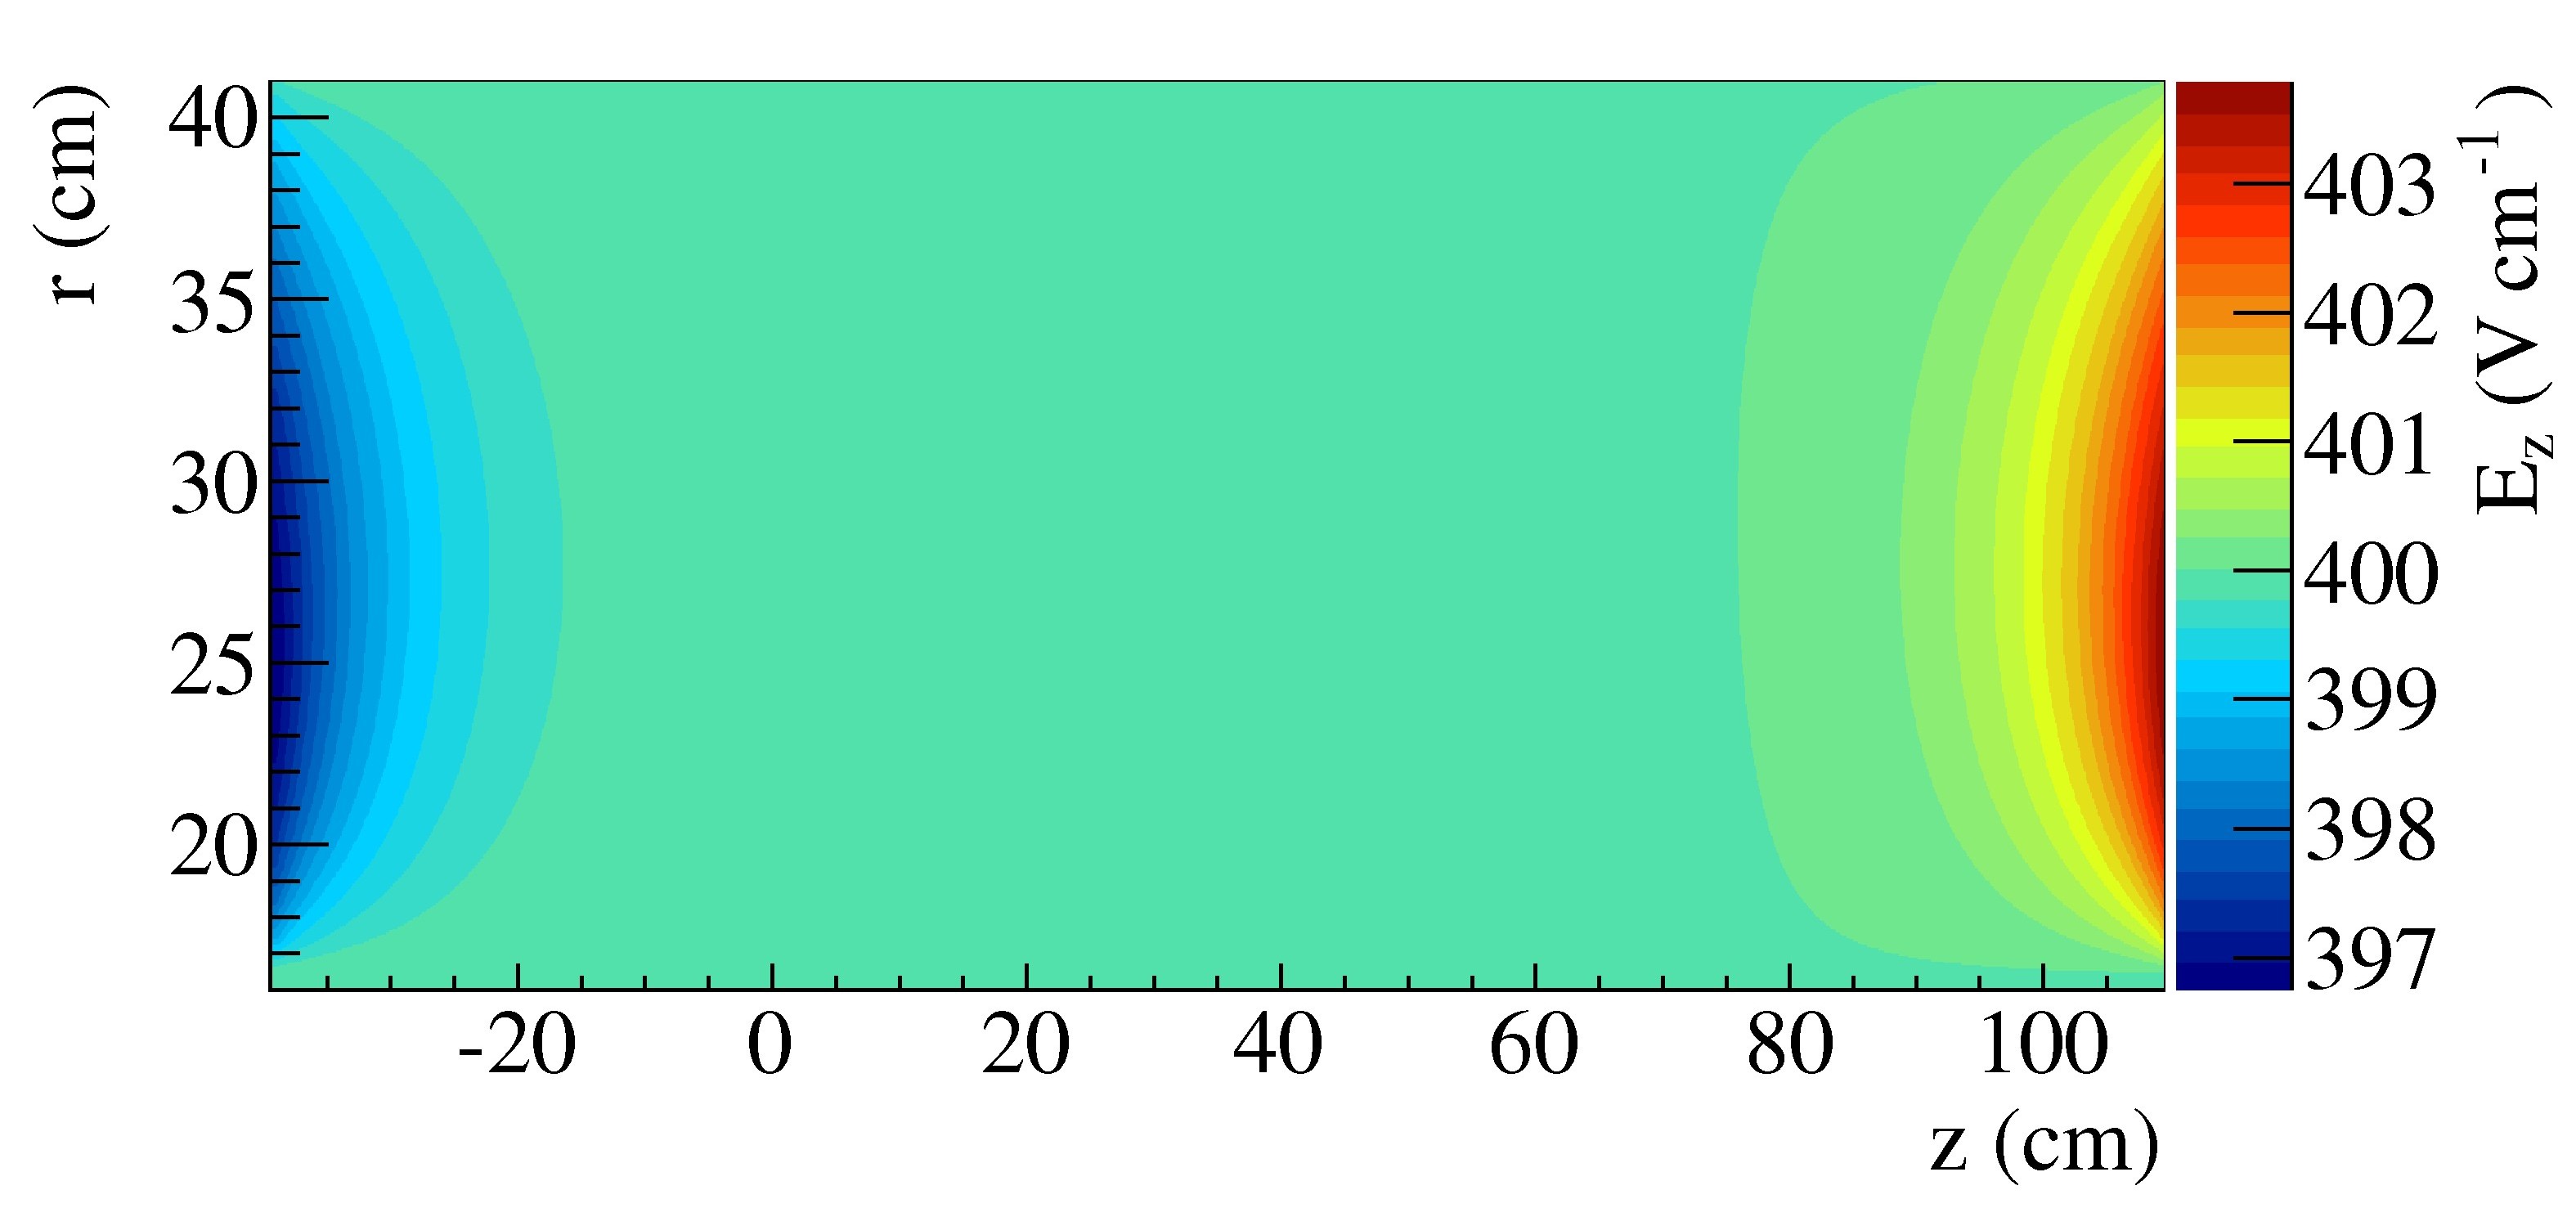
By calculating the gradient of the resulting potential we finally obtain the electric field caused by the space charge. Due to the assumed -symmetry, the non-vanishing components of are the and components. The drift field is oriented along the direction and is superimposed onto the distortion field (see Fig. 5).
4.2 Electron Drift Offsets
To compute a map of the drift distortions as a function of the starting point of the drift, the equation of motion for electrons drifting in electric and magnetic fields (),
| (18) |
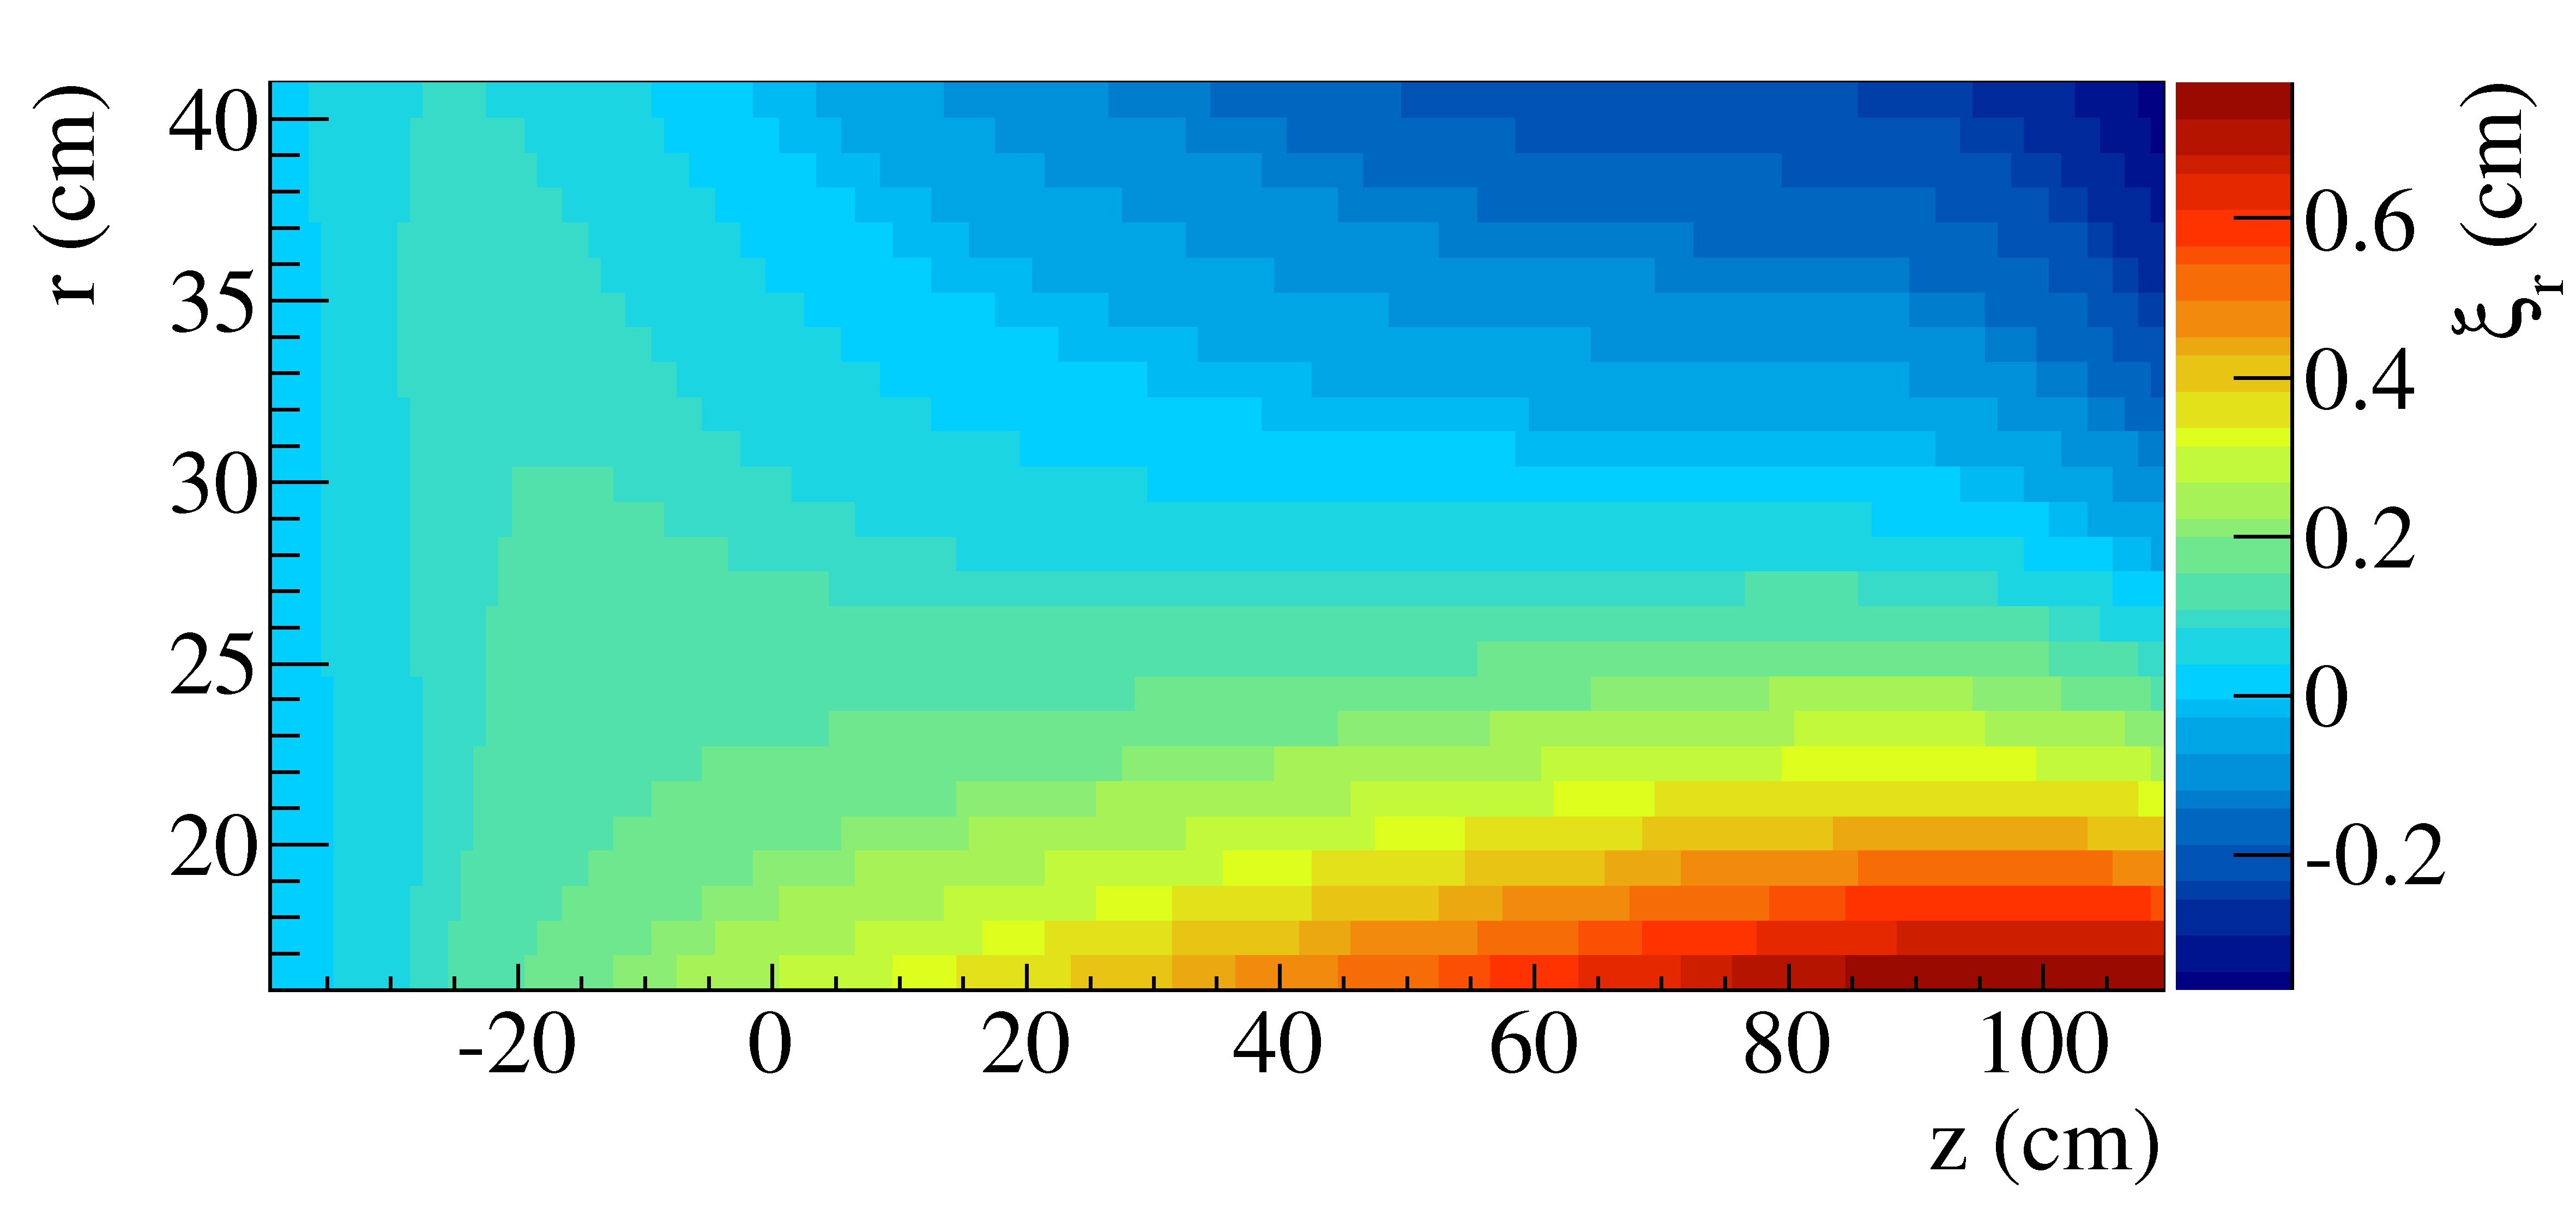
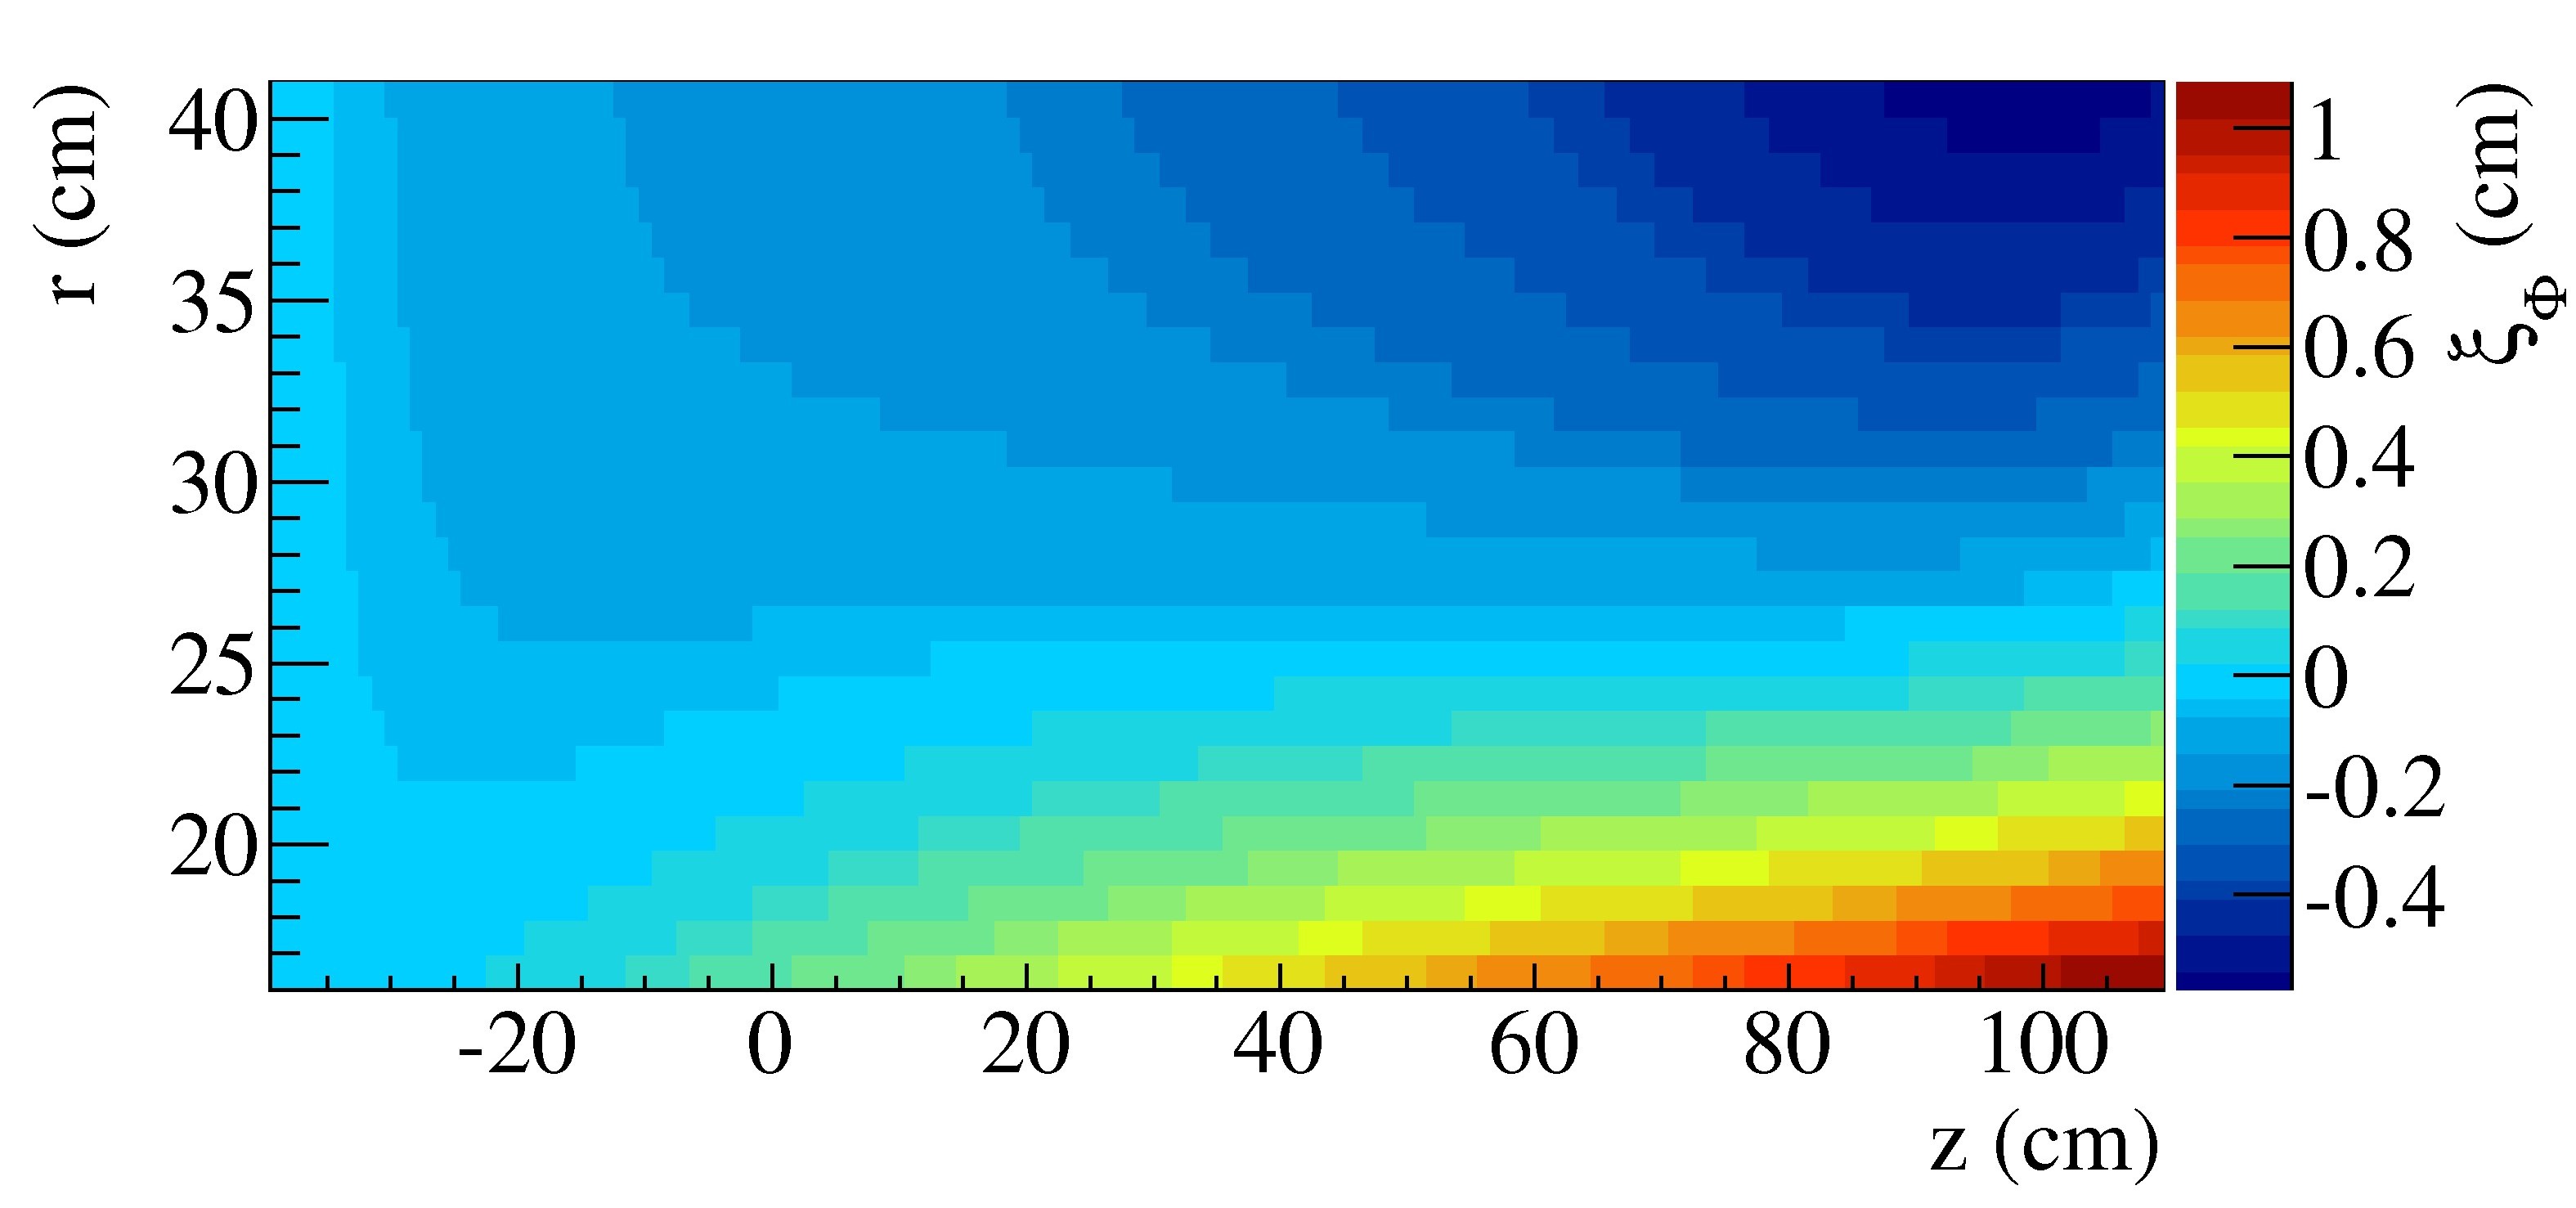
is integrated with a fourth order Runge Kutta algorithm333When reading field values from maps with finite bin size, linear interpolation in between bin centers is applied.. In Eq. (18) is the electron mass, is the macroscopic electron drift velocity, is the electron charge and is a constant friction term modeling the microscopic stop-and-go motion of the drifting electron due to collisions with the gas components (mobility with being the component of ). The electric field is the result of the steps described in Sec. 4.1, while the magnetic field is given by the calculated field map of the p anda solenoid, with a nominal field of and a relative uniformity of better than everywhere in the active volume of the TPC [29]. The fact that both and have non-zero components perpendicular to leads to a displacement of drifting electrons compared to the ideal drift with constant velocity along . Figure 6 shows the radial and azimuthal components of this deviation at the readout plane as a function of the coordinates of the starting point of the drifting electron. It should be noted that although both fields are assumed to exhibit cylindrical symmetry, there are nevertheless drift distortions perpendicular to the --plane. This is due to the term in the solution to Eq. (18).
5 Measurement and Correction of Drift Distortions
In order to correct track data for space charge effects, the resulting drift distortions have to be measured during the operation of the TPC. This can be achieved by creating a well defined pattern of electron sources in the TPC and analyze its image as measured by the detector. A comparison with the expected image directly yields the distortions. Straight line ionization tracks from UV lasers can provide such a pattern [30] and have already been used for calibration in other drift chambers (e.g. in STAR [31]). To assess the potential of this method in the case of an ungated TPC, we have simulated such a laser system.
5.1 Laser Calibration System Simulation
Having found the drift distortions in -direction to be small, we want to measure the distortions in the --plane as precisely as possible. Ideally, this can be done with laser tracks parallel to the drift direction / detector symmetry axis. We chose a grid of 6 laser beams aligned equidistantly in radial direction, where the innermost (outermost) laser is placed away from the inner (outer) field cage wall. One such row of lasers is created every in azimuthal direction. The laser beams are parametrized as straight line tracks with an average ionization density of [31], and a Gaussian beam profile ().
In the simulation routines, the electrons created by the laser rays are then drifted to the readout anode, applying the calculated distortion map and taking into account diffusion. The induced signals are calculated using GEM amplification and signal induction with a realistic response of hexagonal readout pads with an outer radius of as designed for the p anda TPC. In a last step, signals adjacent in space and time are combined to hits by a clustering algorithm. A sample of such hit data as written out by the simulation framework is shown in Fig. 7.

5.2 Reconstruction of Drift Distortions
The reconstruction of the laser tracks is greatly simplified by the knowledge of the geometry (and the time, at which the laser grid has been illuminated): The hits are assigned to tracks by applying simple residual cuts, such that all hits inside a tube of reasonable radius ( for the results presented) around the nominal track position are associated to the corresponding laser track. It is assured that each reconstructed hit is assigned to only one (the closest) track. For each hit, a residual vector is obtained in the plane perpendicular to the corresponding track.
In order to map out drift distortions as a function of the point of electron creation in the drift volume, the large amount of signal data from the laser calibration needs to be fitted, smoothed and parametrized. For this purpose we have implemented an algorithm for fitting of a bi-cubic spline surface [32] to the measured residual data (c.f. Fig. 7). A two-dimensional mesh of knots over the data area is chosen 444In addition 4 knots on each side outside the data area are required to define the full set of B-splines.. At each of these knots two cubic B-splines , are attached, each of which has a fixed shape and spans over five mesh knots (). Coefficients at every knot scale the B-splines:
| (19) |
Assuming the underlying noise (mainly given by diffusion during drift) to be Gaussian, the surface fitting problem is equivalent to finding the set of coefficients which minimize the sum of squared distances
| (20) |
to the residual data (where ). The corresponding matrix-equation (“normal equation”) reads:
| (21) |
where is an -dimensional matrix containing the spline information, is the vector of knot coefficients with elements and is the vector containing the measured residuals. Weighting of hits can be incorporated by introducing a weight matrix . Under the assumption of independent hit errors, becomes diagonal, and instead of Eq. (20) one now has to minimize
| (22) |
Equation (21) then reads
| (23) |
where , , and . The weights for each hit are obtained from the covariance ellipsoid available after clustering, taking into account the orientation of the laser track. By setting the error to be large along the track direction, it is possible to work also with laser grids that are not optimized to the distortions topology.
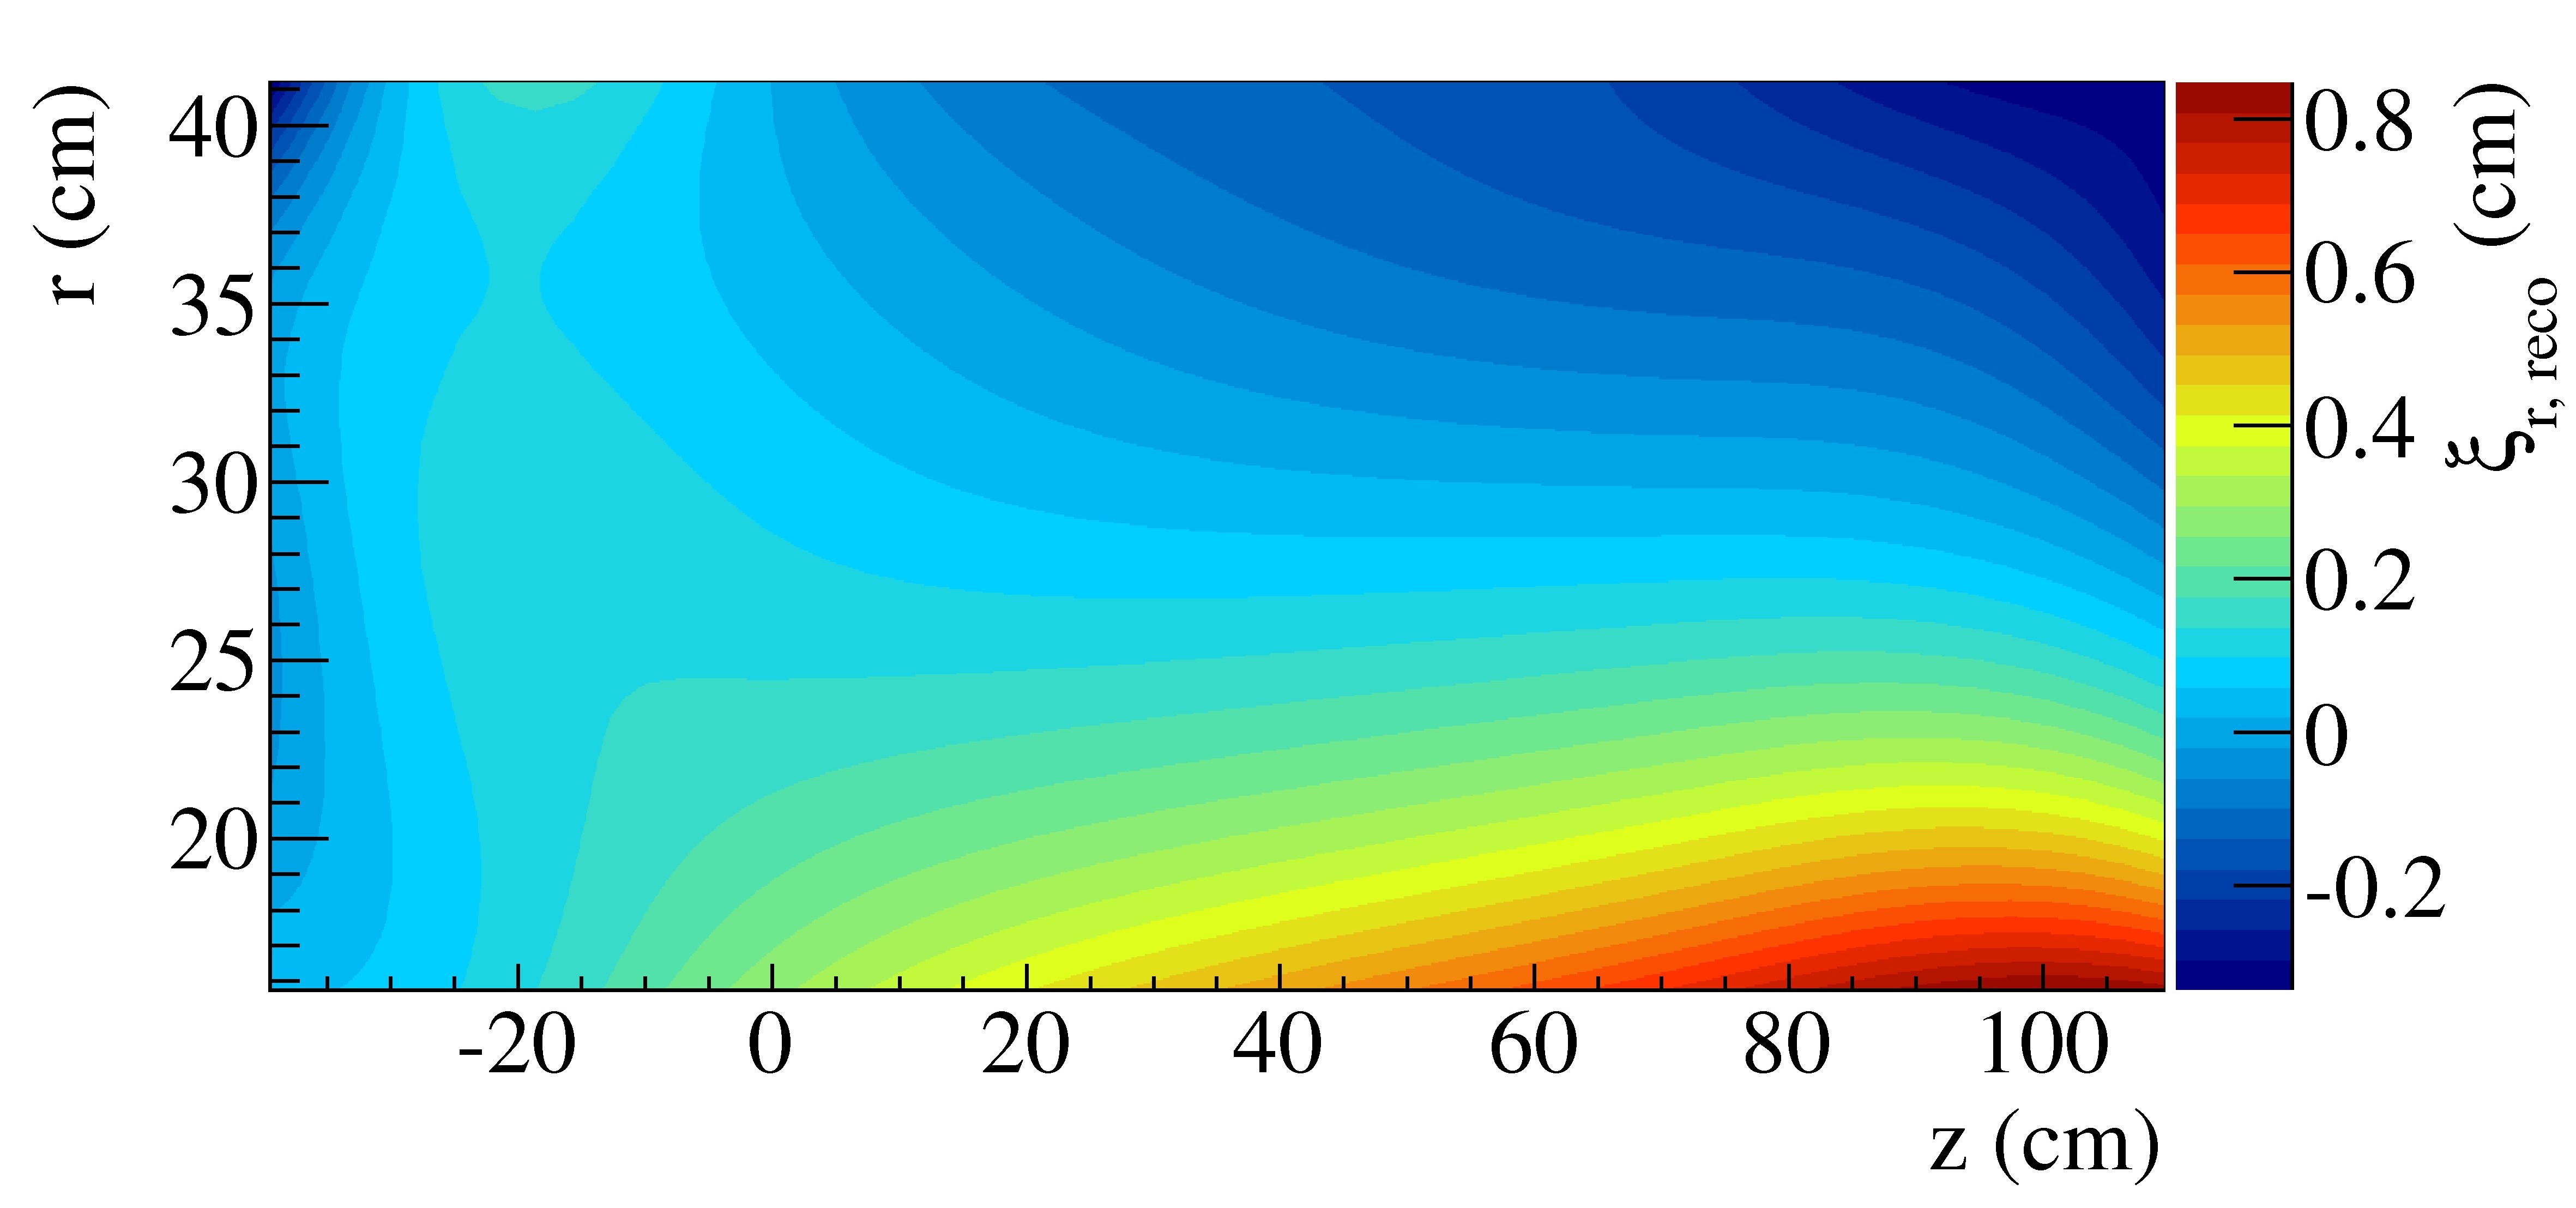
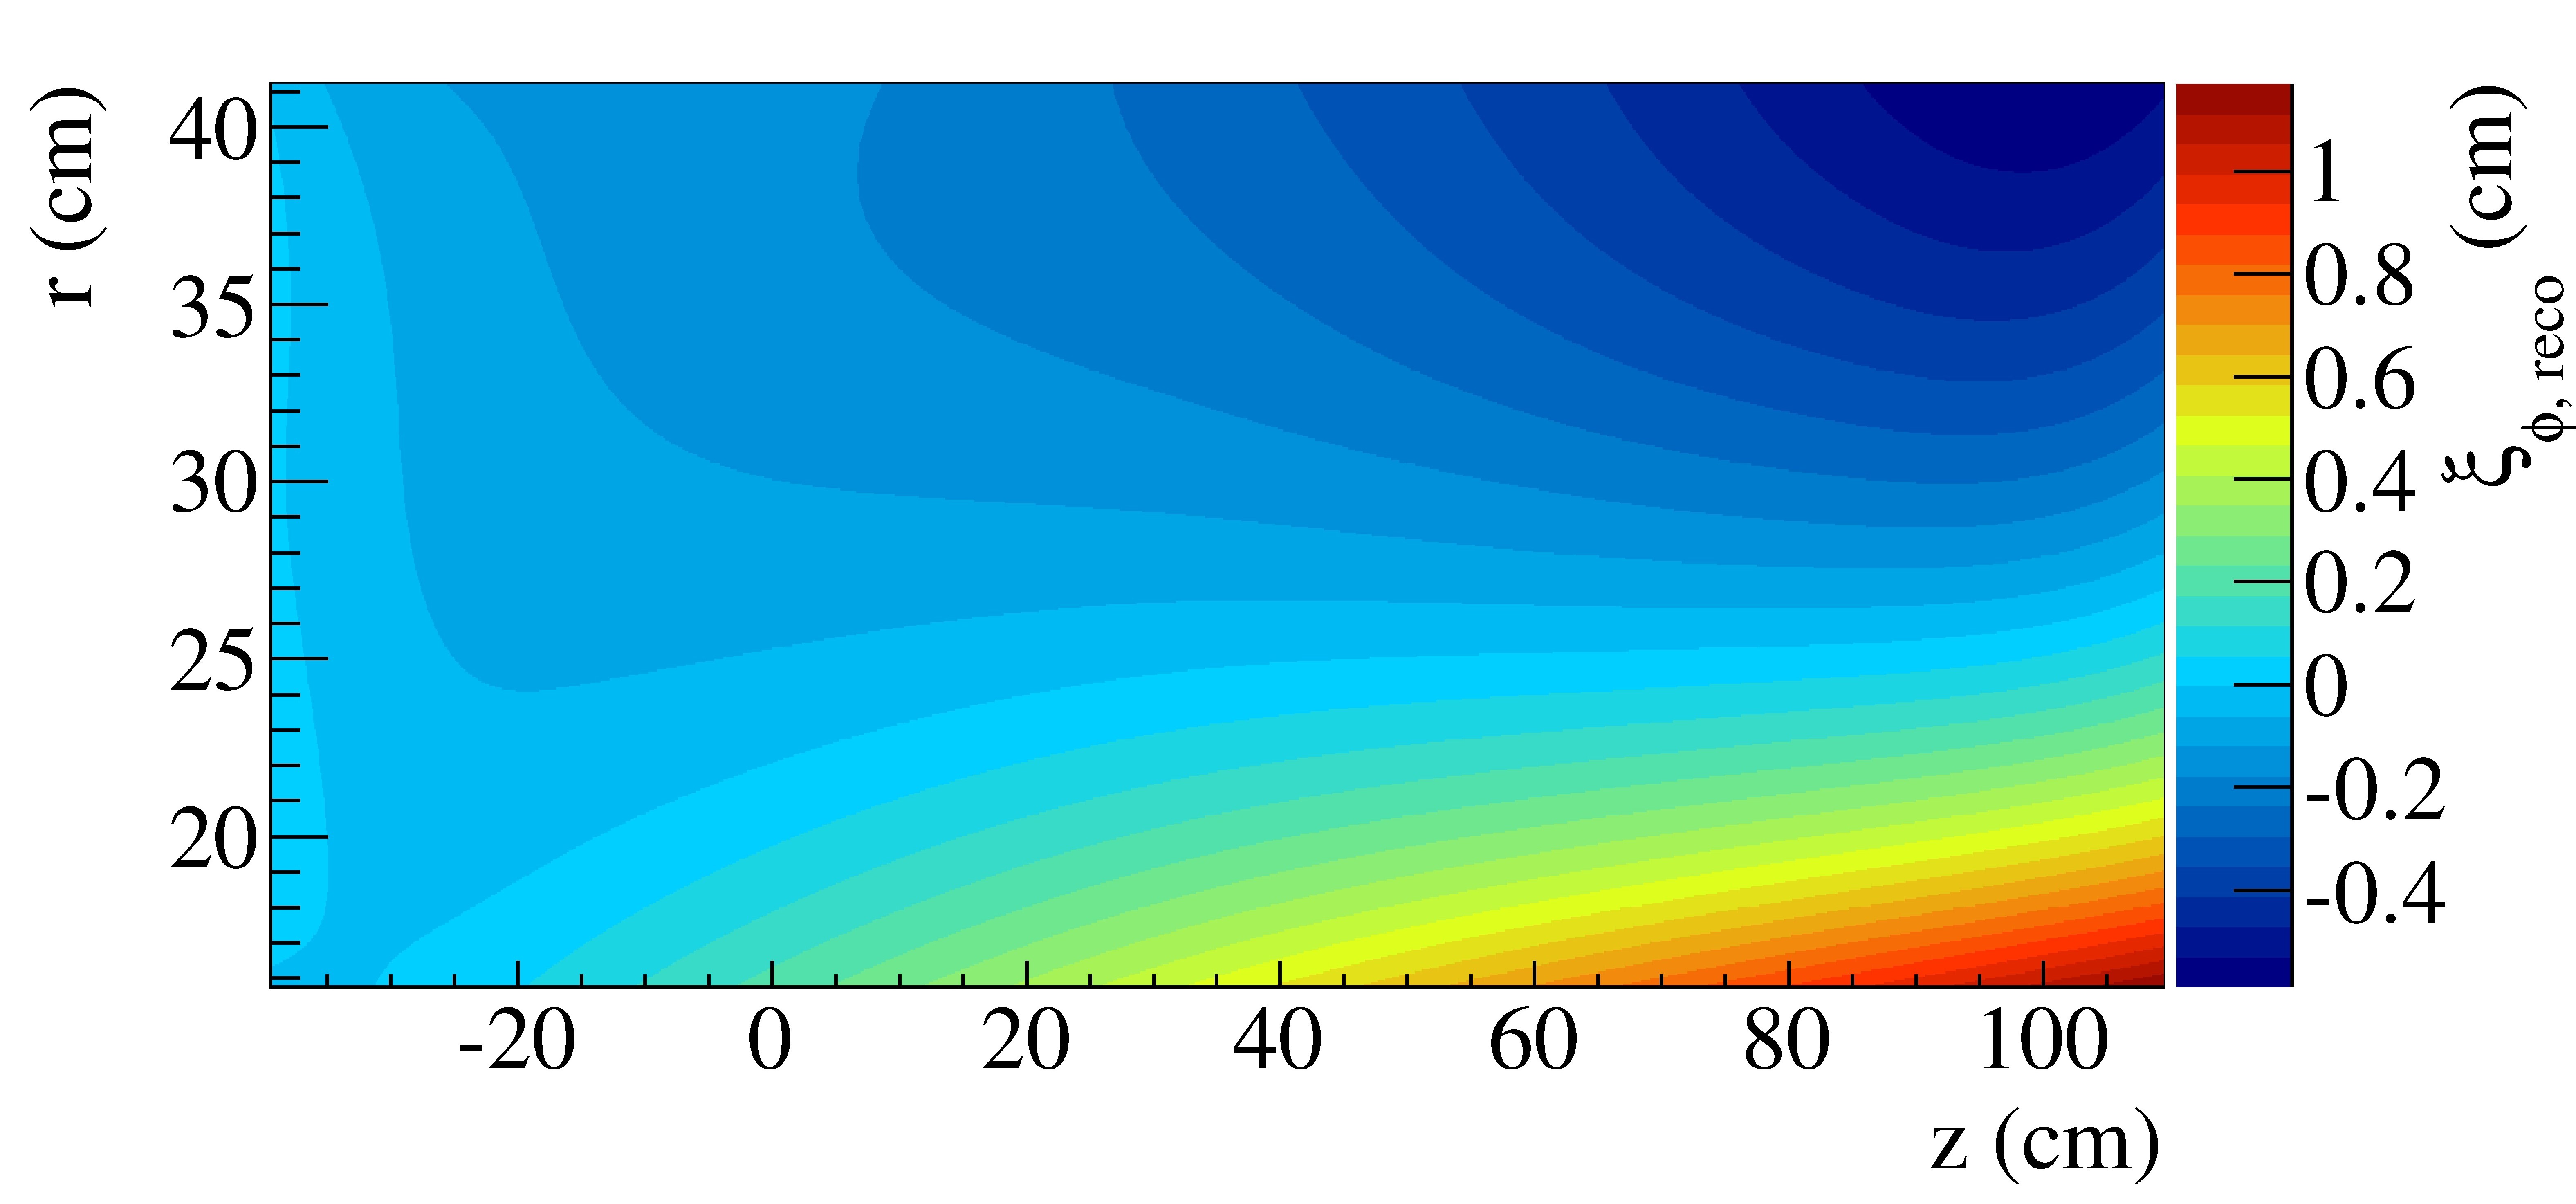
The solution to Eq. (23) can be obtained by matrix inversion or, more stably, by QR-decomposition. Figure 8 shows the least squares spline solution to the reconstructed residual data for both radial and azimuthal drift distortions. One laser event as described in Sec. 5.1 is used, resulting in reconstructed residuals. Typical fit times are of the order of on a single CPU desktop PC.
5.3 Quality of Reconstructed Distortion Map
The choice of the number of spline-mesh knots over the data area is very important for the procedure. On the one hand, a higher number of knots means higher overall fit precision, but overfitting becomes an issue. A lower number of knots, on the other hand, results in a smoother result, but the fit might not be able to follow the important features of the data set. We found to be a balanced value.
To be able to judge the quality of the result shown in Fig. 8, we compare the reconstructed distortion maps to our original drift distortion input (Fig. 6) in Fig. 9, which shows the distribution of differences between the reconstructed and the calculated distortion maps.


Fitting a Gaussian to the peak of the distributions gives and a mean well centered around 0, showing that the total systematic error of the laser correction method is small and the overall precision of the presented distortion reconstruction and fitting method is better than the expected single-hit resolution of the TPC. Hence, using a grid of laser beams, drift distortions in the TPC can be measured with a precision better than (, not taking into account mechanical distortions of the calibration system.
5.4 Effect on Track Reconstruction
The most important question to be answered is of course the impact of space charge effects on track reconstruction. As explained in the previous sections, the steps required to obtain a model of space charge and study its possible effects and their correction are:
-
1.
calculate space charge based on background events;
-
2.
calculate the drift distortion map;
-
3.
create one “laser event” consisting of the full laser beam mesh;
-
4.
reconstruct the laser tracks and fit the data with a spline;
-
5.
use this spline to correct for drift distortions.
In the running experiment, measurements of drift distortions have to be constantly updated, requiring steps 4 and 5 to be triggered on a timescale short enough to be able to resolve possible space charge fluctuations.
To study the effect of drift distortions on charged particle tracks, we simulated a test sample of 5000 pion tracks () at a momentum of and uniformly distributed scattering angle () in the p anda TPC. Tracks are reconstructed using a Kalman-filter-based track fitting framework [33]. Figure 10 visualizes the impact of uncorrected drift distortions on the momentum measurement compared to the ideal situation of a completely homogeneous electrical field. Without correction, the distribution of reconstructed momenta is deformed and systematically shifted towards larger values by space charge effects. This can be understood within the scope of the preceding sections: Depending on its polar angle, a track is more or less affected by drift distortions (c.f. Fig. 6), leading to the broadening of the distribution. The asymmetric nature of the drift distortions with respect to the radial coordinate causes the measured curvature of the track to appear smaller than it actually was, leading to the shift to higher momenta. Applying the correction derived from the laser system essentially recovers the momentum reconstruction, with a resolution of . For comparison, the distribution of reconstructed momenta for the ideal case without any space charge effects yielding a resolution of is shown as outline in Fig. 10. The reconstructed mean changes from in the ideal case to , respectively.

6 Conclusions and Outlook
In this paper we have presented detailed studies on space-charge buildup in a continuously operating GEM-TPC without a gating grid exposed to high interaction rates. We have presented a recursive algorithm to calculate the space charge accumulating in the drift region, starting from minimum bias physics events, and taking into account the primary ionization as well as the ions drifting back from the amplification region. Assuming constant luminosity, an equilibrium space-charge distribution is reached after one full drift time of ions through the chamber. In the example of the environment of the future p anda detector, ion space charges of up to are reached. The electric field resulting from this space charge is calculated using a finite element method to solve the Poisson equation. The drift of electrons in the full electric and magnetic field of the setup is calculated from the Langevin equation solved by a fourth order Runge-Kutta method. Drift-path distortions of () are found for the p anda enviromment, requiring corrections to be applied to the measured hit coordinates.
To this end, we have simulated a laser calibration system creating a regular grid of straight ionization tracks at known positions in the chamber. The geometry of the laser grid was optimized to yield an accurate measurement of the expected distortions, which are dominantly in radial and azimuthal direction for the p anda case. In the case of azimuthal symmetry of the distortions, a two-dimensional spline fit to the measured residuals is sufficiently fast and accurate, reproducing distortions with a precision better than , thus opening the possibility to be applied even in the online reconstruction software. This distortion map is then used to correct hits from charged particle tracks. Using a Kalman-Filter-based track fitting we are able to reconstruct the momentum of tracks with a resolution very close the ideal case of no distortions in the chamber.
The method to calculate the space charge effects and their correction presented in this paper is also applicable to the case of other TPCs with azimuthal symmetry, e.g. at STAR or ALICE. If one cannot exploit symmetry features of the distortions or it is not possible to realize the optimal laser grid geometry due to technical constraints, proper treatment of errors taking into account the grid geometry, as realized in the present work, is important to minimize systematic errors arising from residual projections. This allows the algorithm to be extended to make use of track information from other detectors instead of a fixed laser grid to measure the drift distortions.
References
- [1] D.R. Nygren and J.N. Marx, Phys. Today 31N10 (1978) 46.
- [2] TPC/Two Gamma Collaboration, R.J. Madaras et al., IEEE Trans. Nucl. Sci. 30 (1983) 76.
- [3] TOPAZ-TPC group, T. Kamae et al., Nucl. Instr. Meth. A 252 (1986) 423.
- [4] C. Brand et al., Nucl. Instr. Meth. A 283 (1989) 567.
- [5] W.B. Atwood et al., Nucl. Instr. Meth. A 306 (1991) 446.
- [6] NA49 Collaboration, M. Fuchs, Nucl. Instr. Meth. A 367 (1995) 394.
- [7] STAR Collaboration, K.H. Ackermann et al., Nucl. Phys. A 661 (1999) 681.
- [8] CERES Collaboration, D. Adamova et al., Nucl. Instr. Meth. A 593 (2008) 203, 0802.1443.
- [9] J. Alme et al., Nucl. Instr. Meth. A 622 (2010) 316, 1001.1950.
- [10] W. Blum, W. Riegler and L. Rolandi, Particle Detection with Drift Chambers, 2 ed. (Springer-Verlag, Berlin, 2008).
- [11] F. Sauli, Nucl. Instr. Meth. A 386 (1997) 531.
- [12] F. Sauli, S. Kappler and L. Ropelewski, IEEE Trans. Nucl. Sci. 50 (2003) 803.
- [13] A. Bondar et al., Nucl. Instr. Meth. A 496 (2003) 325, physics/0208017.
- [14] PANDA Collaboration, M. Kotulla et al., Technical progress report for PANDA: Strong interaction studies with antiprotons, FAIR-ESAC/Pbar/Technical Progress Report, 2005.
- [15] Q. Weitzel et al., 2007 IEEE Nucl. Sci. Symp. Conf. Rec., pp. 227–233, Piscataway, NJ, 2007, IEEE.
- [16] GEM-TPC Collaboration, M. Ball et al., Technical Design Study for the PANDA Time Projection Chamber, arXiv 1207.0013, 2012.
- [17] R. Veenhof, Simulation of gaseous detectors, http://consult.cern.ch/writeup/garfield/, 1984 - 2008.
- [18] S. Bachmann et al., Nucl. Instr. Meth. A 479 (2002) 294, CERN-EP-2000-151.
- [19] S. Blatt et al., Nucl. Phys. B (Proc. Suppl.) 150C (2006) 155.
- [20] R. Veenhof, Choosing a gas mixture for the ALICE TPC, ALICE-INT-2003-29, 2003.
- [21] A. Capella et al., Physics Reports 236 (1994) 225 .
- [22] R. Brun and F. Carminati, GEANT - detector description and simulation tool, CERN Program Library Long Writeup W5013, 1993, http://wwwasdoc.web.cern.ch/wwwasdoc /geant_html3/geantall.html.
- [23] ALICE Collaboration, G. Dellacasa et al., ALICE Technical Design Report of the Time Projection Chamber, 2000.
- [24] P. Christiansen et al., Nucl. Instr. Meth. A 609 (2009) 149.
- [25] S. Biagi, Nucl. Instr. Meth. A 421 (1999) 234.
- [26] R. Veenhof, Nucl. Instr. Meth. A 419 (1998) 726.
- [27] H.G.R. Ch. Grossmann, Numerik partieller Differentialgleichungen, 1st ed. (Teubner, 1992).
- [28] A. Logg et al., DOLFIN Project, http://www.fenics.org/dolfin/, 2009.
- [29] PANDA Collaboration, W. Erni et al., Technical Design Report for the PANDA Solenoid and Dipole Spectrometer Magnets, arXiv 0907.0169, 2009.
- [30] H. Hilke, Nucl. Instr. Meth. A 252 (1986) 169 .
- [31] J. Abele et al., Nucl. Instr. Meth. A 499 (2003) 692 , The Relativistic Heavy Ion Collider Project: RHIC and its Detectors.
- [32] J.G. Hayes and J. Halliday, IMA Journal of Applied Mathematics 14 (1974) 89.
- [33] C. Höppner et al., Nucl. Instr. Meth. A 620 (2010) 518, 0911.1008.
- MWPC
- Multi Wire Proportional Chamber
- TPC
- Time Projection Chamber
- HESR
- High-Energy Storage Ring
- FAIR
- Facility for Antiproton and Ion Research
- p anda
- Anti-Proton Annihilations at Darmstadt
- TUM
- Technische Universität München
- GEM
- Gas Electron Multiplier
- DPM
- Dual Parton Model