Signatures of accretion events in the halos of early-type galaxies from comparing PNe and GCs kinematics
Abstract
We have compared the halo kinematics traced by globular clusters (GCs) and planetary nebulae (PNe) for two elliptical galaxies in the Fornax and Virgo clusters NGC 1399 and NGC 4649, and for the merger remnant NGC 5128 (Centaurus A). We find differences in the rotational properties of the PN, red GC, and blue GC systems in all these three galaxies. NGC 1399 PNe and GCs show line of sight velocity distributions in specific regions that are significantly different, based on Kolmogorov-Smirnov tests. The PN system shows multi-spin components, with nearly opposite direction of rotation in the inner and the outer parts. The GCs velocity field is not point-symmetric in the outer regions of the galaxy, indicating that the system has not reached dynamical equilibrium yet. In NGC 4649 PNe, red and blue GCs have different rotation axes and rotational velocities. Finally, in NGC 5128 both PNe and GCs deviate from equilibrium in the outer regions of the galaxy, and in the inner regions the PN system is rotationally supported, whereas the GC system is dominated by velocity dispersion. The observed different kinematic properties, including deviations from point-symmetry, between PNe and GCs suggest that these systems are accreted at different times by the host galaxy, and the most recent accretion took place only few Gyr ago. We discuss two scenarios which may explain some of these differences: i) tidal stripping of loosely-bound GCs, and ii) multiple accretion of low luminosity and dwarf galaxies. Because these two mechanisms affect mostly the GC system, differences with the PNe kinematics can be expected.
keywords:
galaxies: elliptical and lenticular, cD; galaxies: haloes; galaxies: individual: NGC 1399, NGC 4649, NGC 5128; galaxies: kinematics and dynamics.1 Introduction
Stellar halos of galaxies offer an important laboratory to understand the processes of galaxy formation and evolution. The dynamic time scales in the halos are large111They are of the order of 1 Gyr (estimated for distance kpc and circular velocity , e.g. Binney & Tremaine 1987), which represents a significant fraction of the age of the universe., and the imprint of the formation mechanisms may still be preserved at large radii in the kinematics and orbital structure, in streams and substructures, or in the chemical composition and distribution of stars. Therefore, if the last interaction or merger episodes that build up the galaxy halo occurred only few Gyr ago, the halo may not have reached dynamical equilibrium yet. For the case of elliptical galaxies, we can test the dynamic state of the halo by simple symmetry arguments. Elliptical galaxies are intrinsically triaxial systems (e.g. Statler 1994 and references therein), hence their projected light and kinematics on the sky must be consistent with point symmetry when in equilibrium. We can quantify perturbations from this status by measuring deviations from such point symmetry as a function of radius. This simple approach does not require the full computation of the equilibrium status, and measures a basic property of the kinematical quantities projected on the sky.
Due to the rapid dimming of the stellar light at large radii, discrete tracers of the underlying stellar population must be used. Planetary Nebulae (PNe) and Globular Clusters (GCs) can be detected in large numbers out to several effective radii. They and have been used to probe the kinematics (e.g. Coccato et al., 2009; Herrmann & Ciardullo, 2009; Teodorescu et al., 2010; Lee et al., 2010; Schuberth et al., 2012; Pota et al., 2013), dark matter content (e.g. Côté et al., 2001; Romanowsky et al., 2003; de Lorenzi et al., 2009; Napolitano et al., 2011; Richtler et al., 2011; Deason et al., 2012) and chemical composition (e.g. Forbes et al., 2011; Alves-Brito et al., 2011) of the stellar halos in nearby galaxies, probing regions much further out than those reachable with absorption-line kinematics (e.g. Weijmans et al. 2009; Coccato et al. 2010a; Greene et al. 2012). PNe have been found to be good tracers of the underlying stellar population, as their spatial distribution and kinematics agree well with those of the stars (Coccato et al., 2009; Cortesi et al., 2013a). This is not self evident for GCs: they have a bi-modal color distribution (see the review by Brodie & Strader 2006 and references therein) where red GCs have a radial density profile similar to that of the stars and PNe, while blue GCs have a more extended spatial distribution (e.g. Pota et al. 2013; Schuberth et al. 2010).


Recently, the distribution and kinematics of PNe and GCs in galaxy halos have been used as first attempts to detect substructures, which can be interpreted as signatures of minor mergers and accretion events that contribute to the build up of the stellar halos in early-type galaxies (Shih & Méndez, 2010; Woodley & Harris, 2011; Romanowsky et al., 2012) or to the disk heating in spirals (Herrmann et al., 2009).
So far, a direct and detailed comparison between the two-dimensional velocity fields inferred by GCs or PNe has been done only in few cases (e.g. Pota et al. 2013). The commonly used approach was either to combine the two datasets in the analysis, or use the most suited dataset to study a particular science case. Little attention was paid to the information potentially contained in the “discrepancies” between the PNe and GCs velocity fields, which may arise from differences in the progenitor population, and are worth further investigation. We therefore compared the halo kinematics independently traced by GCs and PNe in a sample of galaxies, for which both data are available. In this paper, we describe the properties of three galaxies in our sample (namely NGC 1399, NGC 4649 and NGC 5128), whose two-dimensional velocity fields have kinematic quantities that are different for these tracers. The complete analysis of the entire sample will be presented in a future paper. Here we concentrate on the average kinematic properties and we do not discuss the radial distribution of individual tracers.
In this paper we will consider three aspects of the kinematics of these tracers. In Section 2 we will construct the global velocity fields, derive the direction of rotation, and then look for the properties of point-symmetry in the velocity fields as a test for dynamical equilibrium. In Section 3 we will compare the global kinematics of different tracers in our galaxies, and also study specific regions of their field of view. In Section 4 we discuss the observed discrepancies and infer implications on the multi-epoch mass assembly of these galaxies. Finally, in Section 5 we summarize our results.
2 Halo kinematics
2.1 Global kinematic maps
We want to derive independently and compare the PNe and GCs halo kinematics in the galaxies NGC 1399, NGC 4649, and NGC 5128. In two of these galaxies (NGC 1399, NGC 4649) there is a satellite in the field of view, therefore we have to account for its tracers before deriving the global kinematic properties of the main galaxies.
2.1.1 Separation of tracers of the satellite and galaxy
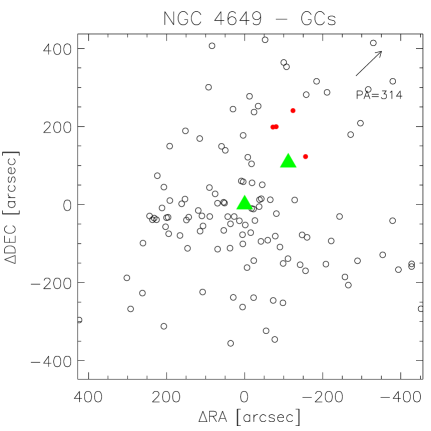
The PNe and GCs detected in NGC 1399 and NGC 4649 contain objects associated to the satellite galaxies NGC 1404 and NGC 4647, respectively. Therefore, we need to separate the sample of discrete tracers of galaxy and satellite. We use the procedure described in McNeil et al. (2010), which assigns to each tracer (PNe and GCs) a probability to belong to the satellite, which is computed on the basis of the surface brightness of the galaxies at the position of the tracer and its velocity along the line of sight. The probability of a tracer to belong to the main galaxy is equal to .
The probability is computed as the product of two terms. The first term is the ratio of the surface brightness of the satellite and the total surface brightness at the projected position of the tracer on the sky. This assumes that the spatial density of the tracer is proportional to the galaxy surface brightness (e.g. Coccato et al. 2009; McNeil et al. 2010; Pota et al. 2013; Cortesi et al. 2013a). We consider the proportionality factors to be the same for galaxy and satellite222The decomposition is robust for variations of the proportional factors up to 20%.. The second term quantifies the probability that a tracer of a given velocity belongs to the Line of Sight Velocity Distribution (LOSVD) of the satellite. The LOSVDs of the galaxy and the satellite are obtained by fitting the observed LOSVD with two Gaussian functions (see also Figure 10 in McNeil et al. 2010). The probability is then normalized in the sense that each tracer is either a member of the galaxy or the satellite. Measurement errors on the velocity of the tracers and the surface brightness of the galaxies at the positions of the tracers have an impact on of the order of , as estimated from Monte Carlo simulations.
According to this method, tracers with low values of are likely members of the galaxy, whereas tracers with high values of are likely members of the satellite.
We decide to exclude from the analysis of the galaxy global kinematics all the tracers that have probability (see Figure 1). The adopted probability threshold is a compromise that removes the tracers that are likely bound to the satellite from the final catalog. It includes i) tracers that are likely bound to the main galaxy, and ii) tracers that may have been previously stripped from the satellite, have moved away from the phase-space location of the progenitor galaxy, have not phase mixed yet into the main galaxy potential, and thus trace a recent interaction. Using a higher may leave a larger number of satellite members in the catalog, whereas a lower may leave only tracers that are securely bound to the main galaxy, and exclude those associated with recent accretion episodes. Although we choose a particular value for probability threshold ( = 60%), the main results found in this work are robust, as discussed in Appendix A.
2.1.2 Constructing the global velocity and velocity dispersion fields
We now use the tracers associated with the galaxy to compute the mean halo kinematic properties of PNe and GCs. In the case of the GCs, we analyze red and blue GCs independently, as they have different spatial and kinematic properties (e.g. Forbes et al. 1997; Schuberth et al. 2010; Pota et al. 2013)333We note that red and blue GC populations do not necessarily represent two GC populations with different metallicity; in fact, different features in the horizontal branch of a GC can led to different total colors for the same metallicity (e.g. Chies-Santos et al. 2012)..
We reconstruct the mean two-dimensional velocity and velocity dispersion fields for the tracers using an adaptive Gaussian kernel smoothing technique. The procedure is fully described and tested in Coccato et al. (2009), and here we provide a short description. First, we remove 3 velocity outliers iteratively through the friendless algorithm as in Merrett et al. (2006), and then we convolve the measured velocities with a Gaussian kernel. The smoothing kernel defines the spatial resolution, and it is chosen to get a good compromise with noise smoothing. Because the distribution of the kinematic tracer (either PNe or GCs) is not uniform across the field of view, we allow the kernel to vary as a function of the local tracer’s number density. In this way, regions with low number density have a kernel larger than that used in regions with high number density, minimizing the effects of spatial incompleteness of the tracers. We allow the PNe and GCs to have different kernels, but we adopt the same kernel for the red and blue GC sub-populations. We do not assume any particular symmetry of the data so as not to bias the analysis.
2.2 Rotation properties with radius
We measure the amount and direction of rotation as a function of radius for each tracer (PNe, red and blue GCs) in each galaxy by fitting the following function in different radial bins:
| (1) |
where is the distance of the tracer (PNe or GCs) from the galaxy center, is its position angle on the sky, is its mean velocity at a given position the sky.
The fit variables for each radial bin are: (amplitude of rotation), (mean velocity), and (kinematic position angle). is found to be consistent with the galaxy systemic velocity at all radii within the errors; this suggests that the measured kinematics are not biased by spatial incompleteness. Errors on the best fit quantities , , and , are computed by means of Monte Carlo simulations, as follows. For each galaxy and each tracer, we create 500 mock catalogs with simulated tracers at the PNe, red and blue GCs observed positions. In each mock catalog, the th tracer has simulated velocity that is drawn from a Gaussian distribution with mean and standard deviation that includes the local velocity dispersion and measurement errors. We then use the simulated catalogs to generate 500 best fit parameters, whose standard deviations define the errors of our variables. Therefore, the errors computed in this way account for: i) the local velocity dispersion of the galaxy, ii) errors in the velocity measurements of the individual objects; and iii) the incompleteness or inhomogeneity of the objects distribution on the sky.
2.3 Point symmetry as a test for equilibrium
As a further step in the analysis, we test the point-symmetry of the computed mean velocity fields to detect deviations from dynamical equilibrium in our galaxies. In dynamical equilibrium, objects on one side of the galaxy should have velocities symmetric with respect to objects on the opposite side (, with respect to the systemic velocity).
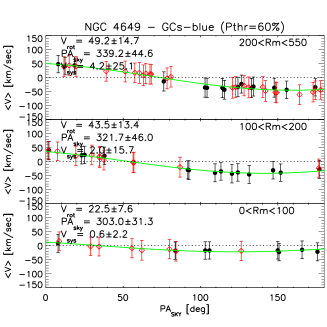
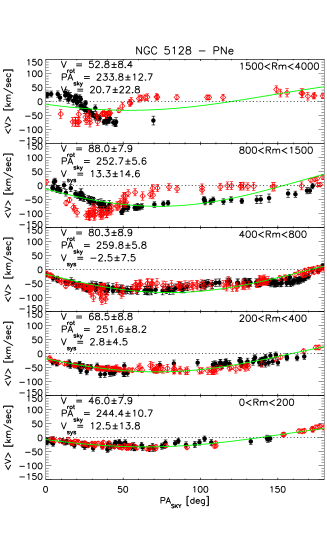
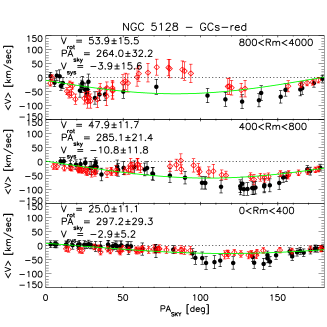
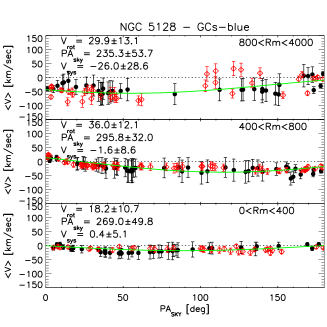
In Figures 4, 5, and 6 we plot the mean velocities computed at the positions of each tracer against their position angles in each radial bin. Mean velocities are folded with respect to the value of computed in each bin to highlight asymmetries in the kinematics and therefore to identify those regions where the population of tracers may deviate from dynamical equilibrium. In these figures, we also show the best fit from Equation 1 for each radial bin.
3 RESULTS
In the following sections, we present the results of the comparison of the kinematics of PNe, red and blue GCs in the three galaxies of our sample.
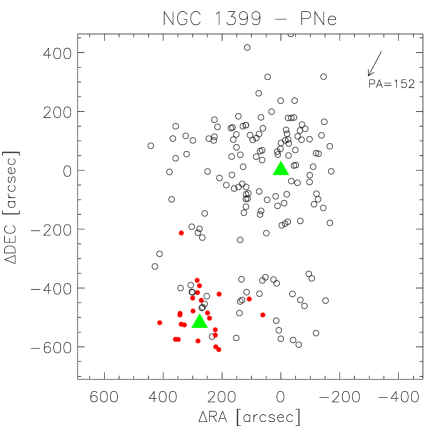
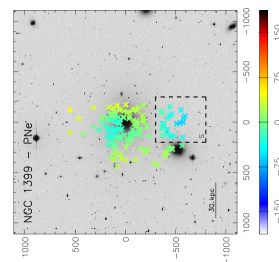
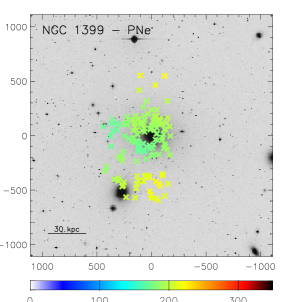
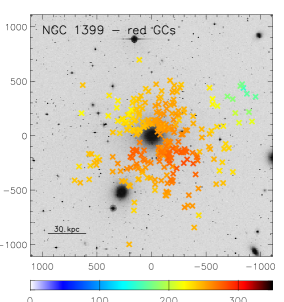
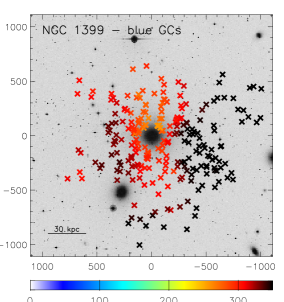
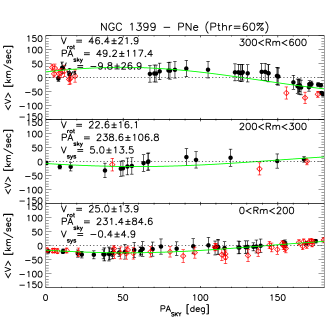
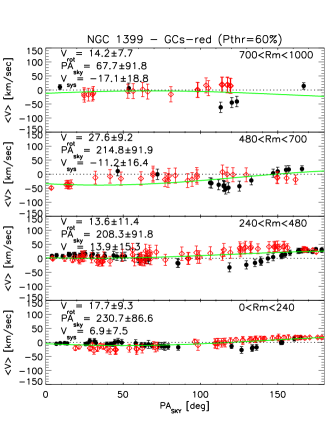
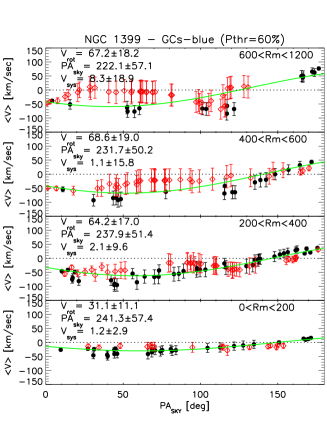
3.1 NGC 1399
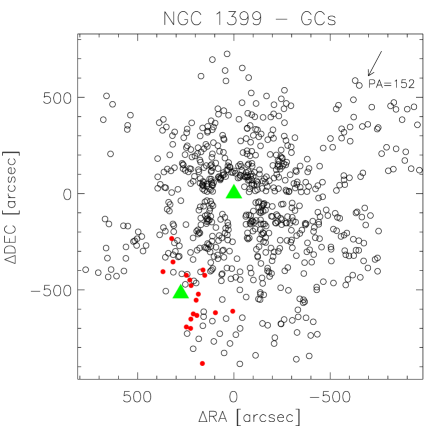
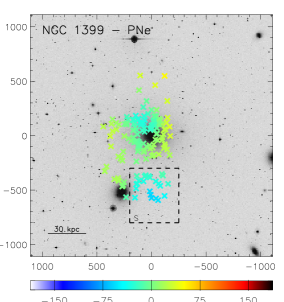
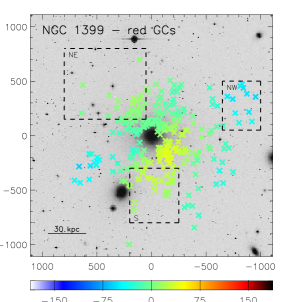
PNe data and the systemic velocity of the PN system are from McNeil et al. (2010), GC data and the corresponding systemic velocity are from Schuberth et al. (2010). We divide the GCs in NGC 1399 in red and blue populations adopting a magnitude limit of and color separation from Schuberth et al. (2010). We now discuss their properties in turn.
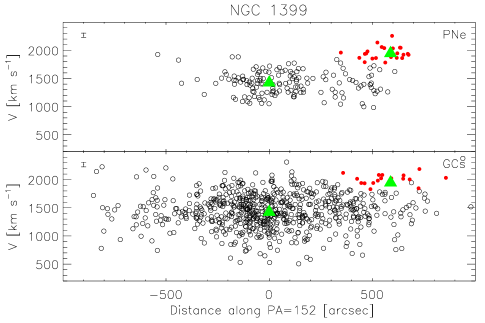
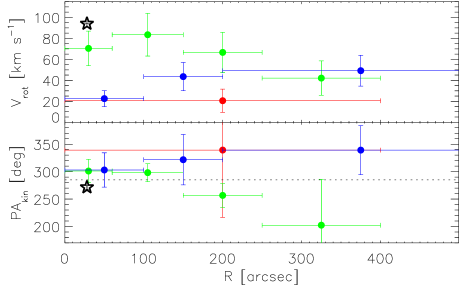
The PN system is dominated by random motions (Figs. 2, 3). In the innermost , PNe are characterized by and a kinematic major axis , consistent with the galaxy photometric major axis (, Dirsch et al. 2003). As we go to the outer regions, , PNe are characterized by and a kinematic major axis , nearly along opposite direction to that of the inner PNe (Figure 4). The observed kinematic decoupling between the PNe in the inner and outer regions is in agreement with the results by McNeil et al. (2010), and it does not depend on the adopted probability threshold (see Appendix A).
The red GC population shows an asymmetric velocity field, see Figure 2 where it is difficult to identify a clear direction of rotation. The asymmetry of the velocities is more evident in Figure 4, where the mean velocities computed at the position of each tracer are plotted against the position angles: for the red GCs velocity deviates from point-symmetry. This suggests that the red-GC system has not reached dynamical equilibrium yet.
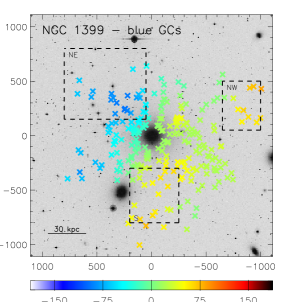
The blue-GC system display less asymmetry than the red GCs within . Using Equation 1, we find rotation of in the radial range , consistent with Schuberth et al. (2010). For larger radii () blue GCs also deviate from point symmetry.
Rotation in the innermost is small, , whereas it increases up to in the outskirts. The kinematic position angle remains constant () with radius within the error bars, consistent with that of the inner PN system.
3.1.1 Local velocity differences in the field of view
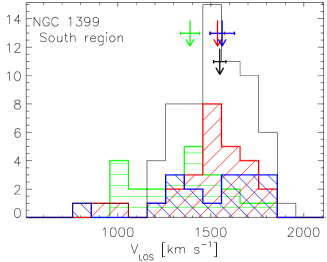
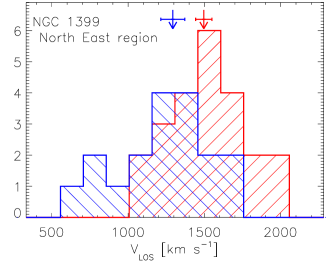
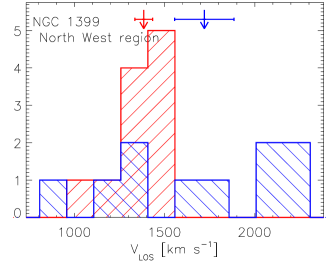
There are also “local” differences among PNe and GCs kinematics in NGC 1399, in addition to those among the mean velocity fields . Indeed, there are regions in the field of view where the difference between the kinematics of the different tracers is more pronounced. They are located at North-East, North-West and South of NGC 1399, see locations in Fig. 2. We show in Figure 7 the line-of-sight velocity distributions of PNe and GCs in these regions, and quantify their differences below.
-
•
In the S-region, the PNe and GCs have median velocities that differ at 81% confidence level (). From a Kolmogorov-Smirnov test (Press et al., 2002), the probability that PNe and GCs are drawn from the same distribution is %. The error on the probability is computed by a set of MC simulations that account for errors in . The probability depends marginally on the GCs color.
The probability that PNe and red GCs are drawn from the same distribution is %, this value is robust towards contamination from the blue GC population. The probability that PNe and blue GCs are drawn from the same distribution is %, and depends on the amount of contamination from the red GCs (see Appendix B). The red and blue GCs have higher probability to be drawn from the same distribution (%).
-
•
In the NE-region, the probability that red and blue GCs are drawn from the same distribution is %. Their median velocities differ at 77% confidence level () , and they have consistent velocity dispersion. No PNe are detected in this region.
-
•
In the NW-region, the probability that red and blue GCs are drawn from the same distribution is %. Their median radial velocities differ at 77% confidence level, and their velocity dispersion differ at 98% confidence level (). The standard deviation of red GCs in the NW region is , whereas the standard deviations of the blue GCs in the NW region is . No PNe are detected in this region.
GCs in the NW region might also be contaminated or perturbed by the presence of NGC 1387, which is 20 arcmin to the west of NGC 1399 and at a systemic velocity of 1328 , which is very close to the systemic velocity of NGC 1399 (1447 ). The fact that blue GCs have higher velocity dispersion than the red GCs in this region indicates that the blue GC system could be more contaminated by the presence of objects from NGC 1387. Unfortunately, the photometric data of NGC 1399 and NGC 1387 are not extended enough to allow a membership determination like the one done for NGC 1404.
Results shown in Figure 7 plot the observed , and are independent from the kernel smoothing technique used to recover the mean velocity fields. In addition, they weakly depend on the adopted threshold probability for satellite membership (see Appendix A).
In summary, the kinematics of PNe, red and blue GCs in NGC 1399, are dominated by velocity dispersion, with global and local differences among their velocity fields. Furthermore, the blue and red GCs velocity fields deviate from point-symmetry at large radii, indicating that they have not reached dynamical equilibrium yet.
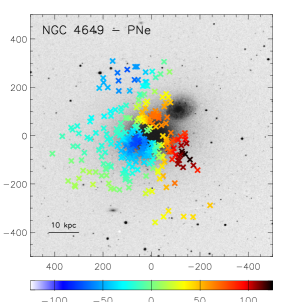
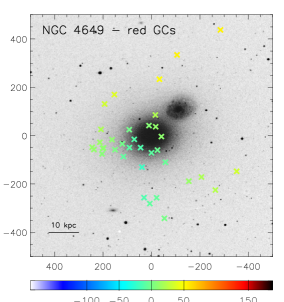
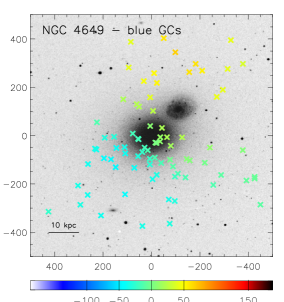
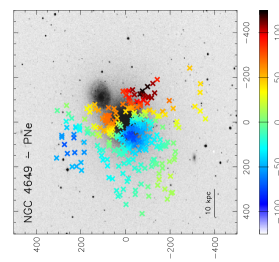
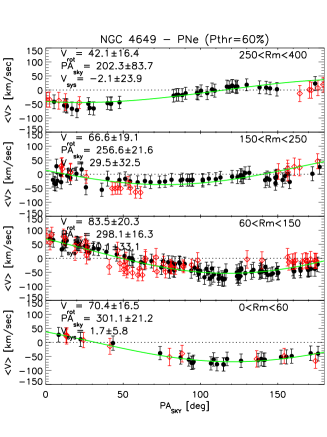
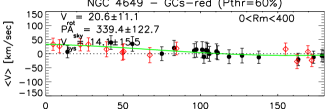
3.2 NGC 4649
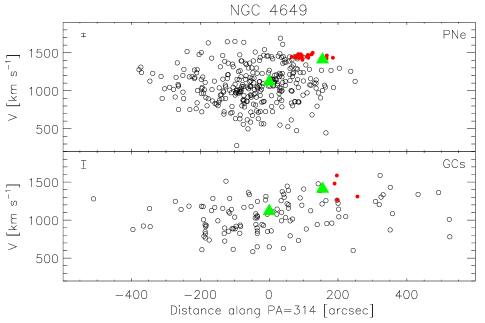
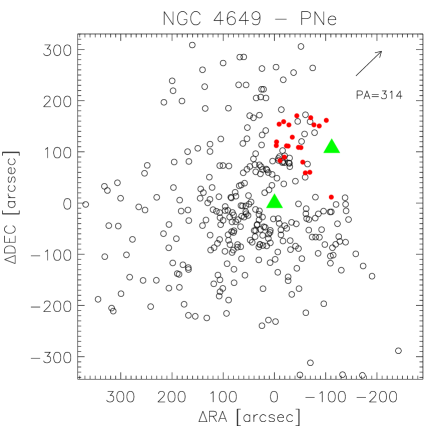
PN data and the corresponding systemic velocity are from Teodorescu et al. (2011), GC data and the corresponding systemic velocity are from Lee et al. (2008). We divide the GC system of NGC 4649 in red and blue GCs adopting a color separation of mag as in Lee et al. (2008). We now discuss their properties in turn.
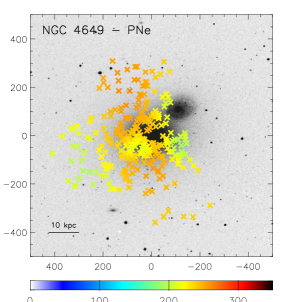
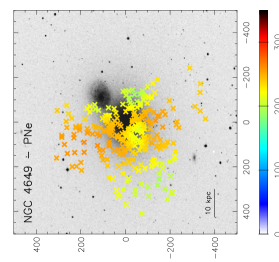
The PN system in NGC 4649 is dominated by velocity dispersion and it is a multi-spin system with two kinematic components at nearly orthogonal directions of rotation (see Figs. 2 and 3). As clearly shown in Figure 5, PNe in the inner rotate with an amplitude along , consistent with the photometric major axis (, de Vaucouleurs et al. 1991); wherease PNe in the outer rotate along with similar amplitude ( ). The PNe velocity field is consistent with point-symmetry (Figure 5). The two-dimensional velocity field is similar to that shown by Das et al. (2011), obtained using different criteria for the removal of satellite members.
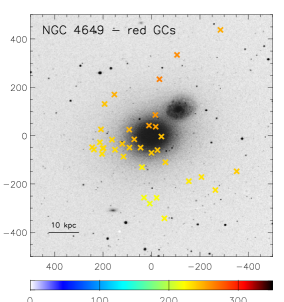
We measure and for the red GC system, independently from the adopted , and the system is pressure supported ( ).
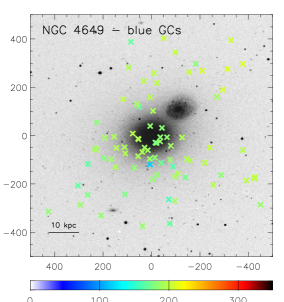
The blue GC sub-population shows a regular velocity field. In the inner the blue GCs rotate along with an amplitude of , slower than the PNe in the same radial range but along similar direction. The and change gradually with the radius. At we measure rotation along , nearly opposite to that of the outermost PNe; see Figure 5.
In Figure 8 we show the value of and for stars, PNe, red and blue GCs in different radial bins. The difference in between PNe and blue GCs is for the outer radial bin. The orthogonal directions of rotation between outermost PNe and blue GCs is independent from the adopted probability threshold , whereas the amplitude of rotation mildly depends on it (Appendix A). The derived kinematic properties of blue GCs are not affected by contamination from the red-GC sub-population (Appendix B).
In summary, the kinematics of PNe, red and blue GCs in NGC 4649, are dominated by velocity dispersion; with differences in the angular momentum vectors. PNe are a multy-spin system, with inner and outer regions having nearly orthogonal angular momenta. Furthermore, the PNe, blue and red GCs velocity fields are point-symmetric, and consistent with dynamical equilibrium in the studied radial range.
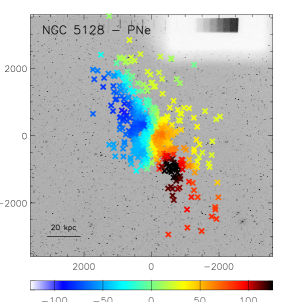
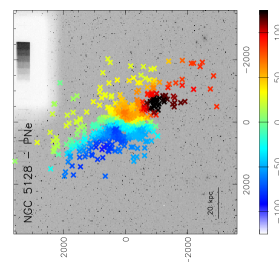
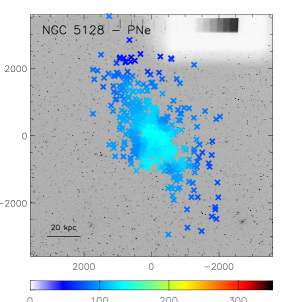
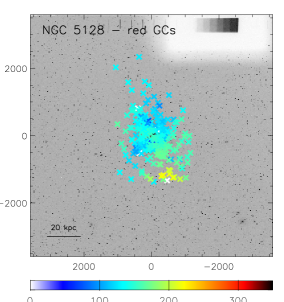
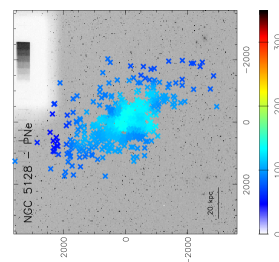
3.3 NGC 5128
Differences of the PNe and GCs kinematics in NGC 5128 were previously noted by Peng et al. (2004b) and Woodley et al. (2007, 2010b). The latter found that the GC system rotates slowly, with no significant differences between red and blue GCs. The PNs system rotates faster along the same direction than the GC system, but they have lower velocity dispersion in the outer regions.
Here, we re-analyze these data sets with the same method as the one adopted for the other galaxies in our sample. PNe data and the corresponding systemic velocity are from Peng et al. (2004a), GC data and the corresponding systemic velocity are from Woodley et al. (2010a, b). Following Woodley et al. (2010b), we use the GCs metallicity [Fe/H] as threshold to separate red (metal rich) and blue (metal poor) GCs.
From Eq. 1, we find that PNe reach a maximum rotation around , and then a decline to in the halo, consistent with Woodley et al. 2007. The velocity dispersion is in the center and then it declines with radius down to . Within , the PNe velocity field shows disk-like rotation, with a variation of the kinematic position angle in the central 5 kpc due to the triaxiality of the system (see also Peng et al. 2004a).
At radii the PN system is not point-symmetric: if we apply Equation 1 independently to the PN sub-samples for the approaching and receding side of NGC 5128, the two kinematic position angles differ by (see also Figure 6). This asymmetry is clearly visible in Figure 6 for the two outermost radial bins. This result suggests that the PN system of NGC 5128 has not yet reached dynamical equilibrium in the halo at these radii.
We check that this result is not an artifact due to spatial incompleteness of the PN sample in the outer regions, as follows. We select the PNe on the receding (approaching) side of the galaxy, and symmetrize them onto the approaching (receding) side. We compute the smoothed velocity and velocity dispersion fields from the approaching and receding symmetric PN samples. We then extracted a simulated PN data set with positions that matches the observations, and velocities randomly selected from a Gaussian distribution with mean velocity and velocity dispersion . These simulated data sets therefore have the same spatial incompleteness as the original observed sample. We then compute the smoothed velocity fields and study their point symmetry properties. The smoothed velocity fields reconstructed from these simulated PN data turn out to be point symmetric. We repeat the test for 100 simulated datasets, and the results are consistent with point symmetry. We conclude that the observed deviation from point-symmetry is an intrinsic property of the PN population in NGC 5128 and it is not caused by spatial incompleteness.
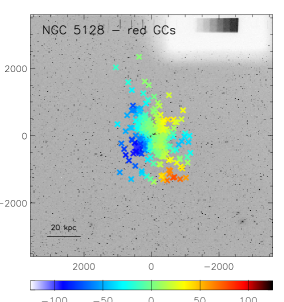
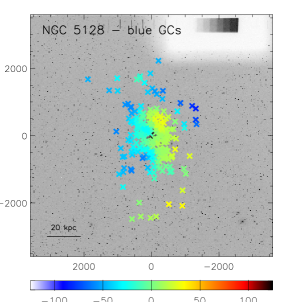
Within the velocity fields of red and blue GCs are well reproduced by Equation 1, they both show weak average rotation of , , respectively, along similar position angles ().
The central velocity dispersion for GCs is consistent with that of PNe ( ), but it does not decrease with radius. Similarly to PNe, red and blue GCs deviates from point symmetry at radii , signaling that they have not reached dynamical equilibrium yet. This is effect is stronger for the red GC system (see Figure 6).
In Summary, within the current result supports a picture where the GCs are more related to a spheroidal component, dominated by velocity dispersion, while the PNe are more rotationally supported, and related to a disk-like component. At large radii, deviations from point-symmetry are observed for both PNe and GC systems, which indicate that the halo has not reached equilibrium yet.
4 Discussion
We show in Sect. 3 that the PN and red and blue GC systems in NGC 1399, NGC 4649, and NGC 5128 have different kinematic properties. Moreover, in the outer regions of NGC 1399 and NGC 5128 we detect deviations from point-symmetry in their velocity fields (Figures 2, 4, 5, and 6), which are not consistent with dynamical equilibrium. The observed different kinematic properties, including deviations from point-symmetry, between PNe and GCs suggest that these systems have been accreted at different times by the host galaxy.
The observed asymmetries in the velocity fields in the outer radial bins are consistent with an interaction/accretion event which occured in the last few Gyr, because the dynamical timescale in the halos of massive galaxies is of the order of 1 Gyr, and therefore dynamical equilibrium is expected to be reached in a few Gyr. The statement that NGC 1399 and NGC 4649 could have experienced a recent interaction, is supported by the fact that they are located in dense environments and have a luminous companion nearby (NGC 1404 and NGC 4647, respectively). Moreover, multi-epoch accretion events for the mass assembly of their halos are also consistent with the presence of the multi-spin components observed in their PN system. In the case of NGC 5128, this galaxy is considered a merger remnant (e.g. Peng et al. 2004b; Woodley et al. 2010a; Crnojević et al. 2013 and references therein) and deviations from symmetry in the outer regions indicate that this event took place in the last few Gyr.
We now discuss how the observed differences between PNe and GCs kinematics may arise from a multi-epoch mass assembly scenario.
-
•
Tidal stripping. NGC 1399 and NGC 4649 could have stripped material from their less massive satellites. The GC systems in galaxies are generally more extended than the underlying stellar population (e.g. Harris 1991); this implies that in some cases the outer GCs may be stripped in the interaction, more frequently than stars and PNe, which are tightly bound. It follows that the signature of the tidal stripping will be most visible in the GC system, which then traces different kinematics than PNe and stars. Although our sample is limited, the above prediction is supported by the fact that the PNe kinematics are on average more point symmetric than the GC system thus suggesting that the PN system is less perturbed.
Forbes et al. (1997) explored this scenario for NGC 1399. This galaxy has an high specific frequency (i.e. number of GCs per unit galaxy luminosity, normalized at , Harris & van den Bergh 1981), and GCs are preferentially distributed in the outer galaxy regions. Its satellite, NGC 1404, has an observed luminosity which is consistent with its stellar velocity dispersion. This suggests that only a small fraction of its stars were removed in the stripping process, whereas its low specific frequency for GCs indicates that they many of them were lost to NGC 1399 during the interaction.
Information on the GCs specific frequency is not available for NGC 4647, the companion of NGC 4649, and we therefore do not have elements to study the tidal stripping between NGC 4649 and NGC 4647 as in the case of NGC 1399. Nevertheless, NGC 4647 shows mild asymmetries in the stellar and neutral gas distributions, and in the neutral gas kinematics, suggesting an on-going interaction with NGC 4649 (Young et al., 2006).
Within the GC system, the hypothesis that blue GCs can trace the interaction between the two galaxies more strongly than the red GCs (e.g. Forbes et al. 1997; Cortesi et al. 2013b) is supported by the following observations: i) the majority of GCs with redshifted velocities in NGC 4649 are blue, and are located on the NGC 4647 side (Figs. 1 and 2); and ii) the blue GCs in the South and North West regions of NGC 1399 (close to the nearby galaxies) have a broader line-of-sight velocity distribution than the red GCs in the same region (Figs: 3 and 7).
-
•
Kinematic disturbances from a satellite. Kinematic disturbances induced by the gravitational interaction with a satellite can generate asymmetries in the stellar and ionized-gas velocity fields as observed in interacting binary galaxies (e.g. Borne et al. 1994) and galaxies in clusters (e.g. Rubin et al. 1999). However, stars, PNe and GCs would experience the same gravitational perturbation from the satellite, and therefore their velocity fields would be affected in the same way. Hence, this scenario would not cause differences in the kinematics between these tracers.
-
•
Multiple mergers and accretion episodes. Massive galaxies in dense environments are subject to many accretion events of different kinds, i.e. major/minor, wet/dry mergers, etc (e.g. De Lucia & Blaizot 2007). If the fractions of accreted GCs and stars/PNe differ for different accretion events, we may expect the kinematic signature of these events to be more visible in one system of tracers than in the other.
It is therefore interesting to compare the expected number of accreted GCs and PNe for galaxies of different luminosity and type to see if there are any galaxies that would preferentially imprint the kinematic signature of the accretion in one system of tracers from the other. In Figure 9 we compare the expected numbers of accreted GCs and PNe as functions of the total magnitude and morphological type of galaxies. Despite the scatter, due to the low number statistics for dwarf galaxies and the different observational constraints for the PN and GC sample (which may add to an intrinsic scatter of the relation) there is an indication that low luminosity and dwarf galaxies contribute more GCs than PNe. The expected contributions from bright spiral galaxies are instead more alike. Therefore, when a massive galaxy accretes many low luminosity galaxies and dwarfs, it will preferentially accrete GCs. In this case, the signature of the merging events will be imprinted in the GCs kinematics more strongly than in the PNe and stars, therefore differences in the velocity fields of these tracers are to be expected.
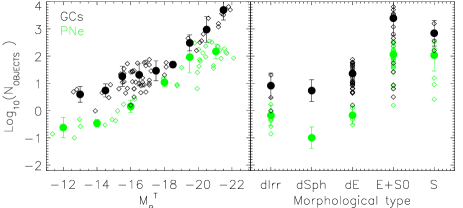
Figure 9: Expected number of sources (GCS or PNe) as a function of galaxy absolute magnitude (left) and morphology (right). GCS data are from Harris & van den Bergh (1981), Brodie & Strader (2006), and references therein. PN data are from Zijlstra et al. (2006), Buzzoni et al. (2006), Coccato et al. (2009), and references therein. The expected number of GCs and PNe are computed from: i) the specific frequencies of GCs and PNe, and ii) the total galaxies’ luminosities in the and bands, for GCs and PNe respectively. The definitions of specific frequencies for GCs () and PNe () are given by Harris & van den Bergh (1981) and Jacoby (1980), respectively. This interpretation is consistent with the data of NGC 1399. In fact: 1) its globular cluster specific frequency (, Harris & van den Bergh 1981) is nearly twice the number expected for galaxies of the same total luminosity (, see Figure 9); and 2) its PN specific frequency (, Buzzoni et al. 2006) is nearly a third of that expected for the galaxies of the same luminosity (, see Figure 9). Therefore, these values are consistent with a scenario where NGC 1399 accreted preferentially GCs from low luminosity and dwarf galaxies.
Similarly, the GC specific frequency in NGC 4649 (, Harris & van den Bergh 1981) is higher than expected from galaxies of the same total luminosity (, from Figure 9). Unfortunately, its PN specific frequency is not available in the literature.
The situation of the merger remnant NGC 5128 is different because it is not in a dense environment. Recent accretions events, as suggested by the presence of substructures (Woodley & Harris, 2011; Mouhcine et al., 2011; Crnojević et al., 2013), may come from the late infall of tidal tail material after the merger. In fact: 1) the GC specific frequency (, Harris & van den Bergh 1981) is consistent with the mean of galaxies of similar total luminosity (; and 2) its PN specific frequency (, Buzzoni et al. 2006) is higher than that expected for galaxies of the same luminosity ().
The difference in the PNe and GCs kinematics in NGC 5128 is similar to the one recently found in the S0 galaxy NGC 2768 (Forbes et al., 2012), where the velocity PN field is indicative of a disk-like system, whereas the GCs kinematics are more indicative of a spheroidal component. It would be interesting to investigate the presence of a PN sub-population associated with the spheroidal component in NGC 5128 with similar methodology as in Forbes et al. (2012) and Cortesi et al. (2013b).
5 Summary
In summary, we found that the kinematics of PNe, red GCs, and blue GCs are different in the three galaxies studied in this work. They contain different angular momentum vectors and their kinematics deviates from point-symmetry at large radii, indicating deviations from dynamical equilibrium. Tidal interactions, multi-epoch mass assembly and different specific frequencies depending on the progenitor galaxies can explain the occurence of different kinematics for different tracers.
It would be interesting to follow-up and compare the extended PNe and GCs kinematics in other massive galaxies in dense environments, where the evidence for accretion comes from independent arguments and techniques, for example NGC 4889 (Coccato et al., 2010a; Coccato et al., 2010b), NGC 3311 (Coccato et al., 2011; Arnaboldi et al., 2012), M87 (Mihos et al., 2005; Doherty et al., 2009; Romanowsky et al., 2012), and NGC 1316 (Richtler et al., 2012).
Acknowledgments
LC is supported by the European Community’s Seventh Framework Programme (/FP7/2007-2013/) under grant agreement No 229517. We thank K. Woodley and E. McNeil-Moylan for providing updated datasets for NGC 5128 and NGC 1399, C. Wegg and M. Lucio for useful discussion. We thank the anonymous referee for useful comments that helped to improve the paper.
References
- Alves-Brito et al. (2011) Alves-Brito A., Hau G. K. T., Forbes D. A., Spitler L. R., Strader J., Brodie J. P., Rhode K. L., 2011, MNRAS, 417, 1823
- Arnaboldi et al. (2012) Arnaboldi M., Ventimiglia G., Iodice E., Gerhard O., Coccato L., 2012, ArXiv e-prints
- Binney & Tremaine (1987) Binney J., Tremaine S., 1987, Galactic dynamics
- Borne et al. (1994) Borne K. D., Balcells M., Hoessel J. G., McMaster M., 1994, ApJ, 435, 79
- Brodie & Strader (2006) Brodie J. P., Strader J., 2006, ARA&A, 44, 193
- Buzzoni et al. (2006) Buzzoni A., Arnaboldi M., Corradi R. L. M., 2006, MNRAS, 368, 877
- Chies-Santos et al. (2012) Chies-Santos A. L., Larsen S. S., Cantiello M., Strader J., Kuntschner H., Wehner E. M., Brodie J. P., 2012, A&A, 539, A54
- Coccato et al. (2010a) Coccato L., Arnaboldi M., Gerhard O., Freeman K. C., Ventimiglia G., Yasuda N., 2010a, A&A, 519, A95
- Coccato et al. (2010b) Coccato L., Gerhard O., Arnaboldi M., 2010b, MNRAS, 407, L26
- Coccato et al. (2009) Coccato L., Gerhard O., Arnaboldi M., Das P., Douglas N. G., Kuijken K., Merrifield M. R., Napolitano N. R., Noordermeer E., Romanowsky A. J., Capaccioli M., Cortesi A., de Lorenzi F., Freeman K. C., 2009, MNRAS, 394, 1249
- Coccato et al. (2011) Coccato L., Gerhard O., Arnaboldi M., Ventimiglia G., 2011, A&A, 533, A138
- Cortesi et al. (2013a) Cortesi A., Arnaboldi M., Coccato L., Merrifield M. R., Gerhard O., Bamford S., Romanowsky A. J., Napolitano N. R., Douglas N. G., Kuijken K., Capaccioli M., Freeman K. C., Chies-Santos A. L., Pota V., 2013a, A&A, 549, A115
- Cortesi et al. (2013b) Cortesi A., Merrifield M. R., Coccato L., Arnaboldi M., Gerhard O., Bamford S., Napolitano N. R., Romanowsky A. J., Douglas N. G., Kuijken K., Capaccioli M., Freeman K. C., Saha K., Chies-Santos A. L., 2013b, MNRAS, 432, 1010
- Côté et al. (2001) Côté P., McLaughlin D. E., Hanes D. A., Bridges T. J., Geisler D., Merritt D., Hesser J. E., Harris G. L. H., Lee M. G., 2001, ApJ, 559, 828
- Crnojević et al. (2013) Crnojević D., Ferguson A. M. N., Irwin M. J., Bernard E. J., Arimoto N., Jablonka P., Kobayashi C., 2013, ArXiv e-prints
- Das et al. (2011) Das P., Gerhard O., Mendez R. H., Teodorescu A. M., de Lorenzi F., 2011, MNRAS, 415, 1244
- de Lorenzi et al. (2009) de Lorenzi F., Gerhard O., Coccato L., Arnaboldi M., Capaccioli M., Douglas N. G., Freeman K. C., Kuijken K., Merrifield M. R., Napolitano N. R., Noordermeer E., Romanowsky A. J., Debattista V. P., 2009, MNRAS, 395, 76
- De Lucia & Blaizot (2007) De Lucia G., Blaizot J., 2007, MNRAS, 375, 2
- de Vaucouleurs et al. (1991) de Vaucouleurs G., de Vaucouleurs A., Corwin Jr. H. G., Buta R. J., Paturel G., Fouque P., 1991, Third Reference Catalogue of Bright Galaxies (RC3)
- Deason et al. (2012) Deason A. J., Belokurov V., Evans N. W., McCarthy I. G., 2012, ApJ, 748, 2
- Dirsch et al. (2003) Dirsch B., Richtler T., Geisler D., Forte J. C., Bassino L. P., Gieren W. P., 2003, AJ, 125, 1908
- Doherty et al. (2009) Doherty M., Arnaboldi M., Das P., Gerhard O., Aguerri J. A. L., Ciardullo R., Feldmeier J. J., Freeman K. C., Jacoby G. H., Murante G., 2009, A&A, 502, 771
- Forbes et al. (1997) Forbes D. A., Brodie J. P., Grillmair C. J., 1997, AJ, 113, 1652
- Forbes et al. (2012) Forbes D. A., Cortesi A., Pota V., Foster C., Romanowsky A. J., Merrifield M. R., Brodie J. P., Strader J., Coccato L., Napolitano N., 2012, MNRAS, 426, 975
- Forbes et al. (2011) Forbes D. A., Spitler L. R., Strader J., Romanowsky A. J., Brodie J. P., Foster C., 2011, MNRAS, 413, 2943
- Greene et al. (2012) Greene J. E., Murphy J. D., Comerford J. M., Gebhardt K., Adams J. J., 2012, ApJ, 750, 32
- Harris (1991) Harris W. E., 1991, ARA&A, 29, 543
- Harris & van den Bergh (1981) Harris W. E., van den Bergh S., 1981, AJ, 86, 1627
- Herrmann & Ciardullo (2009) Herrmann K. A., Ciardullo R., 2009, ApJ, 705, 1686
- Herrmann et al. (2009) Herrmann K. A., Ciardullo R., Sigurdsson S., 2009, ApJ, 693, L19
- Jacoby (1980) Jacoby G. H., 1980, ApJS, 42, 1
- Lee et al. (2008) Lee M. G., Hwang H. S., Park H. S., Park J.-H., Kim S. C., Sohn Y.-J., Lee S.-G., Rey S.-C., Lee Y.-W., Kim H.-I., 2008, ApJ, 674, 857
- Lee et al. (2010) Lee M. G., Park H. S., Hwang H. S., Arimoto N., Tamura N., Onodera M., 2010, ApJ, 709, 1083
- McNeil et al. (2010) McNeil E. K., Arnaboldi M., Freeman K. C., Gerhard O. E., Coccato L., Das P., 2010, A&A, 518, A44
- Merrett et al. (2006) Merrett H. R., Merrifield M. R., Douglas N. G., Kuijken K., Romanowsky A. J., Napolitano N. R., Arnaboldi M., Capaccioli M., Freeman K. C., Gerhard O., Coccato L., Carter D., Evans N. W., Wilkinson M. I., Halliday C., Bridges T. J., 2006, MNRAS, 369, 120
- Mihos et al. (2005) Mihos J. C., Harding P., Feldmeier J., Morrison H., 2005, ApJ, 631, L41
- Mouhcine et al. (2011) Mouhcine M., Ibata R., Rejkuba M., 2011, MNRAS, 415, 993
- Napolitano et al. (2011) Napolitano N. R., Romanowsky A. J., Capaccioli M., Douglas N. G., Arnaboldi M., Coccato L., Gerhard O., Kuijken K., Merrifield M. R., Bamford S. P., Cortesi A., Das P., Freeman K. C., 2011, MNRAS, 411, 2035
- Peng et al. (2004a) Peng E. W., Ford H. C., Freeman K. C., 2004a, ApJ, 602, 685
- Peng et al. (2004b) Peng E. W., Ford H. C., Freeman K. C., 2004b, ApJ, 602, 705
- Pota et al. (2013) Pota V., Forbes D. A., Romanowsky A. J., Brodie J. P., Spitler L. R., Strader J., Foster C., Arnold J. A., Benson A., Blom C., Hargis J. R., Rhode K. L., Usher C., 2013, MNRAS, 428, 389
- Press et al. (2002) Press W. H., Teukolsky S. A., Vetterling W. T., Flannery B. P., 2002, Numerical recipes in C++ : the art of scientific computing
- Richtler et al. (2012) Richtler T., Bassino L. P., Dirsch B., Kumar B., 2012, A&A in press (ArXiv: 1203.1879)
- Richtler et al. (2011) Richtler T., Salinas R., Misgeld I., Hilker M., Hau G. K. T., Romanowsky A. J., Schuberth Y., Spolaor M., 2011, A&A, 531, A119
- Romanowsky et al. (2003) Romanowsky A. J., Douglas N. G., Arnaboldi M., Merrifield M. R., Napolitano N. R., Capaccioli M., Freeman K. C., 2003, Science, 301, 1696
- Romanowsky et al. (2012) Romanowsky A. J., Strader J., Brodie J. P., Mihos J. C., Spitler L. R., Forbes D. A., Foster C., Arnold J. A., 2012, ApJ, 748, 29
- Rubin et al. (1999) Rubin V. C., Waterman A. H., Kenney J. D. P., 1999, AJ, 118, 236
- Schuberth et al. (2010) Schuberth Y., Richtler T., Hilker M., Dirsch B., Bassino L. P., Romanowsky A. J., Infante L., 2010, A&A, 513, A52
- Schuberth et al. (2012) Schuberth Y., Richtler T., Hilker M., Salinas R., Dirsch B., Larsen S. S., 2012, ArXiv: 1205.2093
- Shih & Méndez (2010) Shih H.-Y., Méndez R. H., 2010, ApJ, 725, L97
- Statler (1994) Statler T. S., 1994, ApJ, 425, 500
- Teodorescu et al. (2010) Teodorescu A. M., Méndez R. H., Bernardi F., Riffeser A., Kudritzki R. P., 2010, ApJ, 721, 369
- Teodorescu et al. (2011) Teodorescu A. M., Méndez R. H., Bernardi F., Thomas J., Das P., Gerhard O., 2011, ApJ, 736, 65
- Weijmans et al. (2009) Weijmans A.-M., Cappellari M., Bacon R., de Zeeuw P. T., Emsellem E., Falcón-Barroso J., Kuntschner H., McDermid R. M., van den Bosch R. C. E., van de Ven G., 2009, MNRAS, 398, 561
- Woodley et al. (2010b) Woodley K. A., Gómez M., Harris W. E., Geisler D., Harris G. L. H., 2010b, AJ, 139, 1871
- Woodley & Harris (2011) Woodley K. A., Harris W. E., 2011, AJ, 141, 27
- Woodley et al. (2007) Woodley K. A., Harris W. E., Beasley M. A., Peng E. W., Bridges T. J., Forbes D. A., Harris G. L. H., 2007, AJ, 134, 494
- Woodley et al. (2010a) Woodley K. A., Harris W. E., Puzia T. H., Gómez M., Harris G. L. H., Geisler D., 2010a, ApJ, 708, 1335
- Young et al. (2006) Young L. M., Rosolowsky E., van Gorkom J. H., Lamb S. A., 2006, ApJ, 650, 166
- Zijlstra et al. (2006) Zijlstra A. A., Matsuura M., Wood P. R., Sloan G. C., Lagadec E., van Loon J. T., Groenewegen M. A. T., Feast M. W., Menzies J. W., Whitelock P. A., Blommaert J. A. D. L., Cioni M.-R. L., Habing H. J., Hony S., Loup C., Waters L. B. F. M., 2006, MNRAS, 370, 1961
Appendix A Determination of membership of tracers between galaxy and satellite in NGC 1399 and NGC 4649
In the analysis of the kinematic data of NGC 1399 and 4649 we remove the tracers that belong to the satellites identified by probability , where (Section 2).
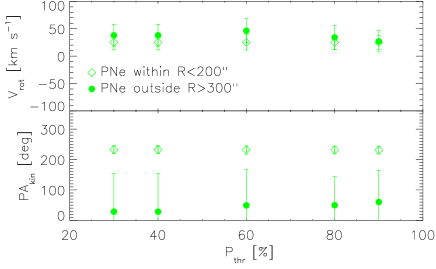
In this Section, we measure the dependency of our results on , showing that there are no strong variations in the interval . The is because the tracers with uncertain membership are few, confirming the robustness of the object separation procedure (see also McNeil et al. 2010 for the stability of the contaminants removal procedure in NGC 1399).
- •
-
•
In Fig. 7 we show that PNe and GCs in three regions of the field of view have different velocity distributions. We quantified these differences with a Kolmogorov-Smirnov test, measuring the probability that PNe and GCs (and the red and blue GC sub-populations) are drawn from the same distribution. In Figure 11 we show that the Kolmogorov-Smirnov test does not vary more than a few per cent with , confirming the robustness of our result.
-
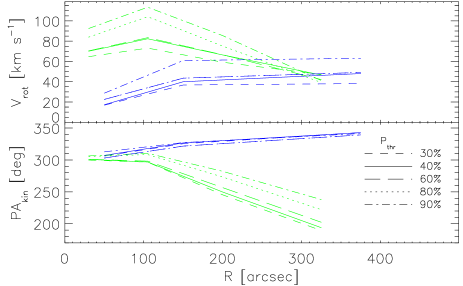
•
In Sect. 3.2 we claim that in the outer regions of NGC 4649 the PNe and blue GCS rotate along nearly opposite directions (Fig. 8). In Figure 12 we show that the direction of rotation is almost independent from , confirming the robustness of the main result, i.e. the decoupling between the kinematic position angle of PNe and blue GCs. In contrast, the rotation amplitude of these tracers slightly depends on : as increases, more red-shifted objects are included in the analysis, increasing the best fit value of . In contrast to PNe and blue GCs, the red GC system is unaffected by .


Appendix B Mutual contamination between the red and blue GC sub-systems
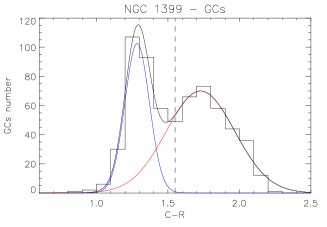
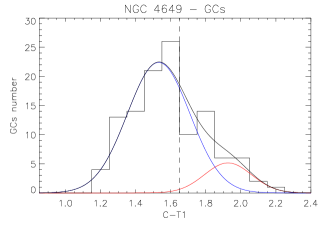
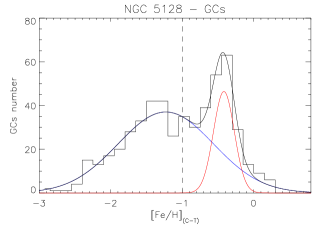
We show in Fig. 2 and 3 and discuss in Sect. 2 that PNe and GCs have different kinematic properties. We also divide the GCs into two sub-populations, based on their color, and compare their kinematics with those derived from PNe. The color classification of GCs into red and blue is based on the evidence that the color distribution is bimodal. Nevertheless, the two GC sub-populations overlap and a mutual contamination may be present. To quantify the amount of mutual contamination, we model the GCs color distribution in our sample galaxies with two Gaussian functions (Figure 13). Data and color separation criteria are those defined in the papers that published the original data.
The mutual contamination between the red and blue GC sub-systems is quantified by measuring the area of the Gaussian functions that fit the blue and red GCs ( and , respectively) within the regions defined by the color thresholds.
In NGC 1399, the blue GC population is contaminated by the blue tail of the red GC population (). On the contrary, the red GC population is not contaminated by blue GCs (). Therefore, the result that PNe and red-GCs have different line of sight velocity distributions in the South region (Fig. 7) does not change.
In NGC 4649 and NGC 5128, the red GC populations are strongly contaminated by the red tail of the corresponding blue GC populations (), therefore their kinematic properties derived in Sections 3.2 and 3.3 depend on the adopted criteria for separation. However, the blue GC populations are not contaminated by red GCs (). Therefore, the result that PNe and blue-GCs in NGC 4649 rotate along different directions (Fig. 8) does not change.