11email: luzma; akelz; mmroth; ole@aip.de 22institutetext: Instituto de Astrofísica de Canarias, E-38200 La Laguna, Tenerife, Spain 33institutetext: Departamento de Astrofísica, Universidad de la Laguna, E-38206 La Laguna, Tenerife, Spain
33email: nicola.caon; bgarcia@iac.es 44institutetext: Centro de Astrofísica and Faculdade de Ciências, Universidade do Porto, Rua das Estrelas, 4150-762 Porto, Portugal
44email: papaderos@astro.up.pt
Mapping Luminous Blue Compact Galaxies with VIRUS-P:
Abstract
Context. Blue Compact Galaxies (BCG) are narrow emission-line systems, undergoing a violent burst of star formation. They are compact, low-luminosity galaxies, with blue colors and low chemical abundances, that offer us a unique opportunity to investigate collective star formation and its effects on galaxy evolution in a relatively simple, dynamically unperturbed environment. Spatially resolved spectrophotometric studies of BCGs are essential for a better understanding of the role of starburst-driven feedback processes on the kinematical and chemical evolution of low-mass galaxies near and far.
Aims. We carry out an integral field spectroscopy (IFS) study of a sample of luminous BCGs, with the aim to probe the morphology, kinematics, dust extinction and excitation mechanisms of their warm interstellar medium (ISM).
Methods. IFS data for five luminous BCGs were obtained using VIRUS-P, the prototype instrument for the Visible Integral Field Replicable Unit Spectrograph, attached to the 2.7 m Harlan J. Smith Telescope at the McDonald Observatory. VIRUS-P consists of a square array of 247 optical fibers, which covers a field of view, with a spatial sampling of and a 0.3 filling factor. We observed in the 3550–5850 Å spectral range, with a resolution of 5 Å FWHM. From these data we built two-dimensional maps of the continuum and the most prominent emission-lines ([O ii] , H, H and [O iii] ), and investigate the morphology of diagnostic emission-line ratios and the extinction patterns in the ISM as well as stellar and gas kinematics. Additionally, from integrated spectra we infer total line fluxes and luminosity-weighted extinction coefficients and gas-phase metallicities.
Results. All galaxies exhibit an overall regular morphology in the stellar continuum, while their warm ISM morphology is more complex: in II Zw 33 and Mrk 314, the star-forming regions are aligned along a chain-structure; Haro 1, NGC 4670 and III Zw 102 display several salient features, such as extended gaseous filaments and bubbles. A significant intrinsic absorption by dust is present in all galaxies, the most extreme case being III Zw 102. Our data reveal a manifold of kinematical patterns, from overall regular gas and stellar rotation to complex velocity fields produced by structurally and kinematically distinct components.
Key Words.:
galaxies: starburst - galaxies: dwarf - galaxies: abundances - galaxies: kinematics and dynamics1 Introduction
Blue Compact Galaxies (BCGs) are low-luminosity ( ranges from to ) and low-metallicity () systems, which have optical spectra similar to those of H ii regions in spiral galaxies (Thuan & Martin 1981; Kunth & Östlin 2000). With star formation rates between and yr-1 (Fanelli et al. 1988; Hunter & Elmegreen 2004), they represent the most extreme manifestation of star-forming (SF) activity in late-type dwarf galaxies in the local Universe.
BCGs are of paramount importance in extragalactic astronomy and observational cosmology research, as they hold key clues to understand fundamental topics such as galaxy formation and evolution, and the ignition and self-regulation of SF activity in relatively isolated late-type galaxies.
They represent an unparalleled link to the early Universe, since in the well accepted framework of a Cold Dark Matter (CDM) Universe, structure formed hierarchically, with small scale objects (low mass halos) collapsing first at relatively large redshifts. About two percent of the BCGs have very low metallicities, (); these objects, often referred to as eXtremely Metal Deficient (XBCD) galaxies (Papaderos et al. 2008), constitute the best local analogs to the distant subgalactic units from which larger galaxies are formed (Papaderos et al. 1998; Kniazev et al. 2004). Also, the more luminous BCGs (or different subsamples of them) have been regarded as the local counterparts of different high redshift SF galaxy populations (Mas-Hesse et al. 2003; Grimes et al. 2009). Detailed analysis of these nearby objects are essential to interpret the observations of the more distant SF galaxy population, as their proximity allows for studies focused on their stellar content, kinematics and abundances, with an accuracy and spatial resolution that cannot be achieved at higher redshifts (Cairós et al. 2009a, b, 2010).
Moreover, low-luminosity systems are the best laboratories to study the star-formation process. Without spiral density waves to act as a triggering mechanism for star formation, these galaxies enable us to investigate in an unbiased manner all of the other factors that trigger and control SF activities. In addition, BCGs offer a unique opportunity to test star-formation models at very low metallicities, similar to those of the early Universe.
In spite of the strong interest gained for BCGs in the last decades, several key issues in the field, namely, the evolutionary status of BCGs, their Star Forming History (SFH) or the mechanisms that trigger their star-forming activity, are still open.
One of the reasons is probably that most of the BCG work published so far deal with analysis of samples by means of surface photometry (Papaderos et al. 1996; Cairós et al. 2001a, b; Doublier et al. 1997, 1999; Gil de Paz et al. 2003; Gil de Paz & Madore 2005), and spectroscopic studies typically only cover the brightest SF regions of these systems. Studies combining surface photometry with spatially resolved spectroscopy and spectral synthesis, and aiming at a quantitative study of the formation history of stellar populations in BCGs, are scarce.
That very few spectrophotometric analyses can be found in the literature, and virtually all of them focused on one single object (Guseva et al. 2003a, b, c; Cairós et al. 2002, 2007), is essentially due to the large amount of observing time that conventional observational techniques require: acquiring images in several broad-band and narrow-band filters, plus a sequence of long-slit spectra sweeping the region of interest, translate into observing times of a few nights per galaxy, making analysis of statistically meaningful samples not feasible in terms of observing time. Moreover, such observations usually suffer from varying instrumental and atmospheric conditions, which make combining all these data together complicated.
Integral Field Spectroscopy (IFS) offers a way to approach spectrophotometric BCG studies in a highly effective manner (Izotov et al. 2006a; García-Lorenzo et al. 2008; Vanzi et al. 2008; James et al. 2009; Cairós et al. 2009a, b, 2010). IFS provides simultaneous spectra of each spatial resolution element, under identical instrumental and atmospheric conditions, which is not only a more efficient way of observing, but also guarantees the homogeneity of the dataset. From only one Integral Field Unit (IFU) frame we can produce a series of broad-band images in a large number of filters, narrow-band images in a large set of bands, as well as derive a large collection of observables from the spectrum (e.g. line indices). In terms of observing time, IFS observations of BCGs are one order of magnitude more efficient than traditional observing techniques, implying that now spectrophotometric studies of large samples of BCG galaxies have become viable.
The work presented here is part of the IFS-BCG survey, a challenging long-term project that aims to perform an exhaustive spectrophotometric survey of a large sample of BCGs by means of IFS. The main scientific goals of this projects include: i) to disentangle and characterize the different stellar populations in BCGs (e.g. constrain their ages, Initial Mass Function and metallicity); ii) to investigate the evolutionary status of the galaxies and constrain their SFH; iii) to probe the mechanism responsible for the actual burst of star formation; iv) to analyze the feedback effects between massive stars and the Interstellar Medium (ISM) in dwarf galaxies; v) to investigate the recent suggestion that some BCGs harbor Active Galactic Nuclei (AGN) associated with intermediate mass black holes Izotov et al. (2010); vi) to provide an accurate dataset of photometric and spectroscopic parameters for a large sample of nearby SF dwarf galaxies, the essential template to understand the results of the investigations at intermediate and high-z.
This is the fourth in a series of papers presenting the findings of the project, in which we report on results derived for five luminous BCGs observed with VIRUS-P. In the first and second papers of the series (Cairós et al. 2009a, b) we illustrated the full potential of this study by showing results on two representative BCGs, Mrk 1418 and Mrk 409, both observed with the Potsdam multi-aperture spectrophotometer (PMAS), attached at the 3.5-m telescope at Calar Alto Observatory. A more detailed description of the project objectives, IFU observation and reduction techniques and results for another eight objects observed with PMAS, was presented in Cairós et al. (2010).
This paper is structured as follows: In Sect. 2 we describe the observations, the data reduction process and the method employed to derive the maps. In Sect. 3 we present the main outcomes of the work, that is, the flux, line ratio and velocity maps, as well as the results derived from the analysis of the integrated spectra. Finally, the main findings for each galaxy are discussed in Sect. 4, and summarized in Sect. 5.
2 Observations and Data Processing
2.1 Galaxy sample and observations
The whole survey includes the mapping of about 40 galaxies, chosen as to cover the wide range of luminosities () and metallicities () found among BCDs. We took also care that the different morphological classes observed among BCGs be well represented in the sample (Cairós et al. 2001a).
In this paper we present results for five luminous BCGs (Bergvall & Östlin 2002; Cairós et al. 2002). These objects are the most luminous (), and typically also the more irregular BCGs; they tend to have an important contribution of older stars, significant amounts of dust and very distorted starburst morphologies (Cairós et al. 2003; Bergvall 2012). As we have already stated in the introduction, these luminous BCGs have a major relevance in cosmological studies, as they (or different subsamples of them) have been regarded as the local counterparts of different galaxies populations at higher redshifts ( 2-6), as Lyman-break galaxies (Grimes et al. 2009) or Lyman- emitters (Mas-Hesse et al. 2003).
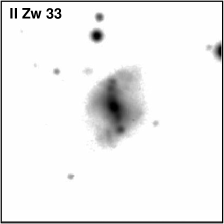
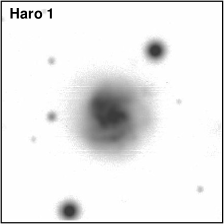
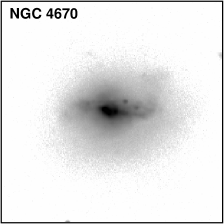
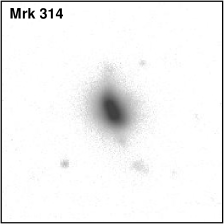
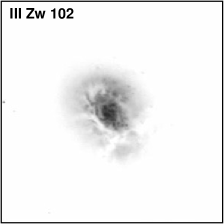
The basic data for the galaxies and the complete log of the observations are listed in Table 1 and Table 2 respectively. -band images of the galaxies are displayed in Figure 1. IFS of III Zw 102 and Mrk 314 has been previously published by García-Lorenzo et al. (2008), who studied the central of III Zw 102 and of Mrk 314 using INTEGRAL at the William Herschel Telescope. In both cases, the much smaller field of view (FOV) of INTEGRAL allows only for a partial mapping of the starburst regions.
Spectral data for the five galaxies listed in Table 1 were collected using the VIRUS-P IFU spectrograph (Hill et al. 2008), working at the 2.7m Harlan J. Smith Telescope at the McDonald Observatory (TX, USA). VIRUS-P is the prototype instrument for VIRUS (= Visible Integral-field Replicable Unit Spectrograph), a massively replicated IFU made of 150 units like VIRUS-P, which will be installed on the 9.2 m Hobby-Eberly Telescope (Hill et al. 2006, 2007).
| Galaxy | Other designations | RA | DEC | Morph | ||||
| (2000) | (2000) | (Mpc) | (mag) | (mag) | ||||
| (1) | (2) | (3) | (4) | (5) | (6) | (7) | (8) | (9) |
| II Zw 33 | UGCA 102, Mrk 1094 | 05 10 48.1 | 02 40 54 | 14.57a𝑎aa𝑎aa | 37.4 | Ch | 0.288 | |
| Haro 1 | NGC 2415, UGC 3930 | 07 36 56.7 | 35 14 31 | 12.61a𝑎aa𝑎aa | 52.9 | Ext | 0.117 | |
| NGC 4670 | UGC 7930, Arp 163, Haro 9 | 12 45 17.2 | 27 07 32 | 13.02b𝑏bb𝑏bi | 22.4 | Nuc | 0.041 | |
| Mrk 314 | NGC 7468, UGC 12329 | 23 02 59.2 | 16 36 19 | 13.78a𝑎aa𝑎aa | 29.0 | Ch | 0.234 | |
| III Zw 102 | NGC 7625, UGC 12529, Arp 212 | 23 20 30.1 | 17 13 32 | 12.50a𝑎aa𝑎aa | 23.1 | Ext | 0.069 |
VIRUS-P (with the VP-1 IFU bundle used in these observations) consists of a square array of 247 optical fibers (of which three were dead in the used configuration), which samples a FOV with a 0.3 filling factor. Each fiber is circular and has a diameter of on the sky. We observed in the spectral range 3550–5850 Å, with a spectral resolution (FWHM) of Å ( km s-1 at H).
Observations were carried out during two observing runs, in 2007 October and in 2008 March. During the latter run, due to camera alignment issues, the spectra of five fibers fell off the chip, and therefore only 239 fibers were usable.
We followed the same strategy in the two observing campaigns. Calibration frames consisted of bias frames, sky-flats and comparison lamps taken at the beginning and at the end of the night. Sky-flats are required to define and trace the fibers (apertures) on the detector as well as to perform the throughput correction. Spectra of emission-line lamps (Hg-Cd lamp in our case) are needed to carry out the wavelength calibration. Because VIRUS-P is an instrument with practically no flexures, comparison lamp spectra taken once during the night will suffice, and no arc exposures interspersed with the science observations are required.
As the filling factor of the IFU is 30%, three dithered exposures were taken in order to ensure a coverage of about 90% of the FOV. The standard observing sequence consists of a set of three exposures (of 20 to 30 minutes each) at each of the three positions (the telescope offsets are first west, south and then east, south).
Flux spectrophotometric standards were also observed, albeit using a six position dither pattern, which guarantees the collection of (almost) their total flux. The spectrophotometric standard stars BD+25d4655, G 191-B2B and BD+40d4032 were observed during the October run, and Feige 34 and BD+33d2642 in the March run.
| Galaxy | Date | Exp. time | Airmass range | Seeing | Spatial scale |
|---|---|---|---|---|---|
| (s) | (arcsec) | (pc arcsec-1) | |||
| II Zw 33 | Oct 2007 | 3600 | 1.20–1.40 | 2.2–2.4 | 760 |
| Haro 1 | Mar 2008 | 3600 | 1.01–1.10 | 2.5–3.2 | 1080 |
| NGC 4670 | Mar 2008 | 4800 | 1.00–1.13 | 2.0–3.0 | 460 |
| Mrk 314 | Oct 2007 | 5400 | 1.03–1.20 | 1.8–2.0 | 590 |
| III Zw 102 | Oct 2007 | 4200 | 1.03–1.25 | 2.0–2.8 | 470 |
2.2 Data reduction
The data have been processed using standard IRAF222IRAF is distributed by the National Optical Astronomy Observatories, which are operated by the Association of Universities for Research in Astronomy, Inc., under cooperative agreement with the National Science Foundation. tasks.
The first step in the data reduction was to remove the bias pedestal level, whose value was computed using the overscan regions in the science frames, and subtracted out. As the bias frames showed some smooth large-scale structure, we averaged all of them to obtain a master bias, to which we subtracted its mean value. This master bias was then subtracted from all the overscan-corrected frames.
Next, apertures were defined and traced on the detector. The apertures need to be traced and defined in well exposed frames: sky-flats taken at the beginning or at the end of the night were used for that. We defined the apertures using the IRAF task apall; this task first finds the centers of each fiber (the emission peak) along the spatial axis at some specified position, and then the user is prompted for the size of the extraction window, which we set to 7 pixels, a width that, in our dataset, maximized the overall signal-to-noise ratio (cross-talk is negligible, see Murphy et al. 2011). The apertures were then traced by fitting a polynomial to the centroid along the dispersion axis. A fifth degree Legendre polynomial was found to provide good fits, with a typical RMS of about 0.02 pixels.
Once the apertures were defined and traced in the continuum frames, we used again apall to extract them in all the science frames. The extraction consists of summing, for each fiber, the pixels along the spatial direction into a one-dimensional spectrum. The output is thus a “row-stacked spectrum” (RSS) of the 244 spaxels (239 for the 2008 March run).
We then performed the wavelength calibration. First, in the comparison spectra we identified several emission features of known wavelength in a reference fiber. Second, using identify, a polynomial was fitted along the dispersion direction; the standard deviation (RMS) of the polynomial fit gives an estimate of the uncertainty in the wavelength calibration. We obtained a typical RMS of about 0.01 Å by fitting a fifth degree Legendre polynomial. A total of 13 lines were fitted. Finally, with reidentify we identified the emission lines in all the remaining fibers of the arc frame, using the selected one as a reference.
Subsequently we corrected for throughput (spaxel-to-spaxel variations) by using the sky flat exposures. This step was carried out with the task msresp1.
In each spectrum, the sky background was computed by taking the median of spaxels in the periphery of the FOV where the galaxy line and continuum emission is negligible, and subtracted out. The spectrum was then corrected for atmospheric transparency variations, gauged by means of the flux of the guide star in the guider saved frames, as explained in Blanc et al. (2009), and for atmospheric extinction (the guide star exposures were also used to estimate the seeing during the observations, see Table 2).
The three spectra for each dithering position were averaged together using the IRAF task imcombine, and then stacked to form a final spectrum of 732 rows (717 for the 2008 march observations).
2.3 Flux calibration
Spectra of several spectrophotometric standard stars were obtained and reduced in the same way as the galaxy spectra.
The only remarkable difference is that the standard stars were observed with a six-position dithering pattern, which ensures that only about 3% of FOV is “lost” in inter-fibers gaps, while about two thirds of the area is covered by two overlapping fibers, as shown in 2. Combined with the PSF undersampling, this dithering pattern does not allow an accurate direct flux estimation by simple summation of all the relevant spaxels.
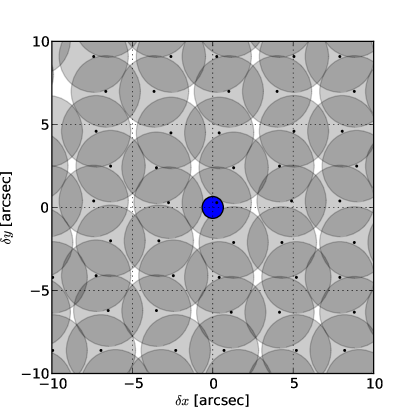
If we summed together all the spaxels with sufficiently strong stellar continuum (typically about 30 spaxels in the row-stacked final spectrum), we would overestimate the actual stellar spectrum, because of the dithering geometry. Moreover, the overestimation factor is in principle wavelength-dependent, because of both the increase of the stellar PSF width towards bluer wavelengths, and the shift of the light centroid due to differential atmospheric refraction.
To better understand it, we can think of a hypothetical star with an extremely narrow PSF, whose blue centroid happens to fall on one of the inter-fibers gaps while the red centroid falls on a spatial location covered by two overlapping fibers: we would measure very little or zero blue flux, while the red flux would be overestimated by a factor of two.
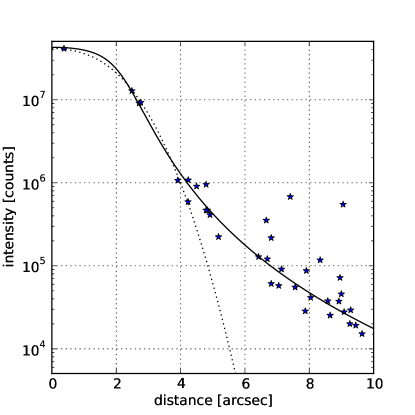
To assess the importance of this effect, we simulated the response of each fiber and did a fit to determine the PSF parameters. The fiber response is calculated by a Monte Carlo integration of the PSF over the circle area of the fiber. For the PSF, a Moffat profile is chosen to follow the instrument response to the outer wings, as shown in Fig. 3. Fit parameters were the total flux, source position and the PSF width and exponent . The Moffat fit was done individually for each wavelength bin.
We found a tight correlation between the Moffat function parameters and wavelength, as depicted in Fig. 4; also, the observed shift of the PSF centroid agrees well with the shift computed theoretically from the airmass and the parallactic angle of the spectrophotometric standard stars spectra.

However, the overestimation factor turns out to have only a very small ( mag) dependence on wavelength (Fig. 5), because of the relatively poor seeing, which spreads out the star flux over a large number of spaxels, and of having observed the standard stars at low airmasses.

To derive the final flux calibration function, for each spectrophotometric standard star we summed together all spaxels with sufficient strong signal in the stacked spectrum, and applied the overestimating factor correction. Then the IRAF tasks standard and sensfunc were used to compute the calibration function, after combining together the data for the different spectrophotometric stars.
By comparing the sensitivity curves for the different standard stars in the two observing runs, we can estimate that the relative uncertainty on the calibration factor is generally less than 2%, except at the blue end of the spectrum, where the uncertainty increases to about 7%.
As the diameter of the fibers and the average seeing values are much larger than differential atmospheric refraction (DAR) effects, no correction for DAR was applied to the data.
2.4 Emission-line fit
2.4.1 Recovering the pure emission-line spectrum
The measurement of the emission-line properties (e.g. fluxes, equivalent widths, or velocity dispersion) provides a great deal of information in regard to the nebula physical conditions and the properties of the ionizing stellar population. However, and in particular when dealing with SF galaxies, the derivation of accurate emission-line fluxes and equivalent widths is not free from problems. At any given spatial position, the observed galaxy spectrum is the sum of the nebular and stellar emission; underlying stellar absorption can under certain circumstances dramatically decrease the measured intensity and equivalent width of Balmer emission lines.
Therefore, in order to obtain precise measurements of the emission-line parameters of the ionized gas, the flux emitted by the stellar population must be modeled and subtracted. In the case of IFU data, this process must be done for every spaxel, i.e., the technique chosen to model the stellar population has to be applied to each individual spectrum of the IFS mosaic.
In order to model the stellar population, we used the penalized pixel-fitting (pPXF) method333URL: http://www-astro.physics.ox.ac.uk/ mxc/idl/ developed by Cappellari & Emsellem (2004); the pPXF software allows to simultaneously fit the optimal linear combination of stellar templates to the observed spectrum and to derive the stellar kinematics, using a maximum likelihood approach to suppress noise solutions. We made use of the MILES stellar library 444URL: http://miles.iac.es/ (Sánchez-Blázquez et al. 2006), which contains a total of 985 stars spanning a large range in stellar age and metallicity.
As a first step, we produced, for every galaxy, a high signal-to-noise integrated spectrum, adding up all the spectra of the science spaxels. Using this spectrum we find the ”optimal stellar template” for every object, i.e., the selected stars from the MILES library that produce the best fit. The fit to the stellar continuum was done after masking out the gas emission-lines expected in the spectral range under study, as well as residuals from skyline subtraction. The number of stars combined to create the ”optimal stellar template” for each galaxy was as follows: 17 stars for II Zw 33, 20 stars for Haro 1, 22 stars for NGC 4670, 20 stars for Mrk 314, and 25 stars for III Zw102.
After that, the pPXF method was run on the spectra of each individual spaxel, using the ”optimal stellar template” and allowing the weights of each star to vary. The application of the ”optimal stellar template” to each individual spectrum considerably speed up the fitting process. As the automatization of this process could lead to bad fittings, a careful individual inspection by eye was done.
Once the stellar continuum has been successfully reproduced by a sum of templates for every spaxel, it was subtracted from the original spectrum to get the pure emission-line spectrum.
We must remark here that the fit to the stellar continuum is not meant to provide a physical description of the stellar populations making up the galaxy, a topic which is outside the scope of this paper, but that the purpose of this modeling is to obtain a good representation of the underlying stellar continuum in order to decouple it from the emission lines produced by the ionized gas, and to derive more accurate values of emission-line fluxes.
The stellar continuum fit only works out in the central regions of the galaxies, while it fails, producing meaningless results, in the outer regions where the signal-to-noise of the continuum is too small.
2.4.2 Fitting the lines
Emission-line fluxes for every spaxel were measured on the pure emission-line spectrum. However, the line emission extends well beyond the galaxy region in which the pure emission-line spectrum could be computed.
To compute the fluxes in those spaxels outside such region, the original stacked spectra were used, fitting the continuum, typically 30–50 Å on both sides, by a straight line.
In order to measure the relevant parameters of the emission lines (position, flux and width), they were fitted by single Gaussians. The fit procedure was carried out by using the the Levenberg-Marquardt non-linear fitting algorithm implemented by C. B. Markwardt in the mpfitexpr IDL library 555URL: http://purl.com/net/mpfit. The [O iii] doublet was fitted imposing that both lines have the same redshift and width. Uncertainties on the fit output parameters were computed adopting a simplified poissonian model on the non-flux-calibrated spectra, where the readout noise was set equal to the rms of the nearby continuum, and the gain set to 1.
Criteria such as flux, error on flux, velocity and width were used to do a first automatic assessment of whether to accept or reject a fit. For instance, lines with too small (less than the instrumental width) or too large widths were flagged as rejected, as well as lines with an error on the flux more than about 10% of the flux (the exact limits depending on the specific line and on the overall quality of the spectrum). Such criteria were complemented by a visual inspection of all fits, which led to override, in a few cases, the automated criteria decision (by accepting a fit flagged as rejected, or vice versa).
2.5 Creating the 2D maps
The emission-line fit procedure gives, for each line and for each line parameter (for instance flux), a table with the fiber ID number, its coordinates, the measured value and the acceptance/rejection flag.
The gaussian fit parameters for the continuum-subtracted and the original spectra were merged together. For the H and the H Balmer lines, due to their strong absorption components, only the results from the continuum-subtracted spectra were used.
Line ratios were computed by simply dividing the fluxes of the corresponding lines.
To display all these maps, we explored several options. One is to interpolate the data on a regularly spaced grid, by means of an algorithm such as the Renka & Cline (1984) two-dimensional interpolation method. However, our own experience is that the interpolation can produce spurious oscillations, especially over non-contiguous spaxels, and gives the false impression of a spatial resolution higher than the actual value.
An alternative is to represent each spaxel with measured data with a circle with the fiber’s diameter at its spatial position. However, the irregular inter-fiber gaps (due to the fact that the actual position of the fibers is slightly and randomly offset from the nominal one) distract the eye of the viewer and interfere with a comfortable and effective visual assessment of the global characteristics of the map.
The solution we adopted was to depict each fiber by means of an hexagon centered on the nominal (not the actual) position of each fiber (the mean difference between nominal and actual positions is about with a maximum of ). This we found to be the best compromise between a truthful representation of the data (as no rebinning or interpolation was done: the only manipulation was to slightly change the fibers positions and shape) and a map which is both pleasant to the eye and easy to appraise and interpret.
3 Results
3.1 Emission-line and continuum intensity maps
IFS provides a simultaneous mapping of the light emitted by a galaxy in a wide spectral range. Accordingly, from one single exposure we can retrieve maps at a given wavelength or maps equivalent to narrow- or broad-band images within the whole observed range.
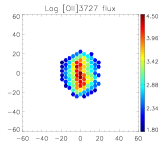
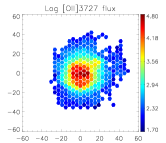
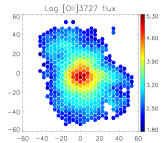
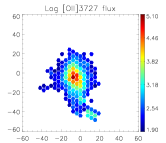
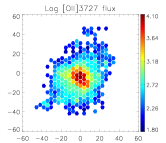
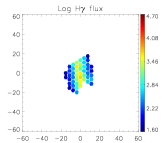
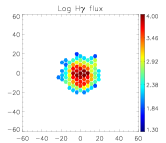
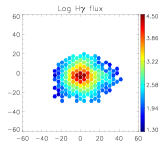
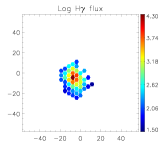
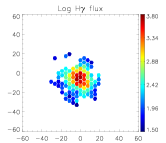
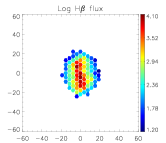
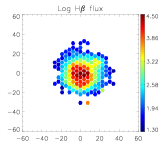
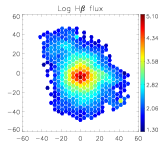
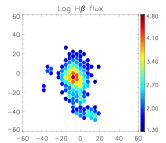
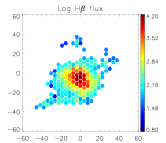
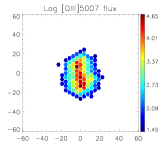
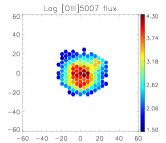
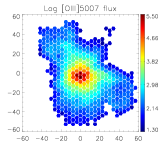
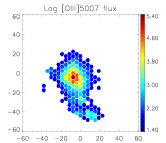
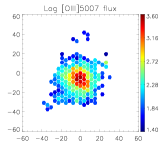
Following the steps described in Section 2.5 we built emission-line flux maps for the brightest observed emission-lines, namely [O ii] , H, H, and [O iii] ; these maps are displayed in Figure 6 (rows 2 to 5).
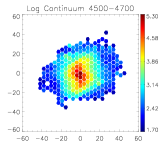
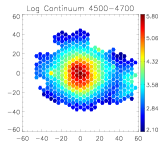
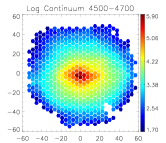
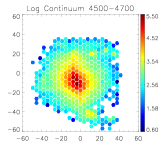
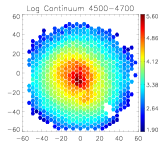
Continuum maps were obtained by summing the flux within specific wavelength intervals, selected so as to avoid emission lines or strong residuals from the sky spectrum subtraction. Continuum maps in the spectral interval 4500-4700 Å are shown in Figure 6 (row 1): this is the wavelength range where the continuum signal is stronger and better portrays the galaxy outer regions (Wolf-Rayet features are not an issue, as they are only visible in just a few central spaxels in two objects, see Sect. 4).
The emission-line maps depict the interstellar gas ionized by massive stars, while the continuum maps mainly trace the stellar light from the galaxy. The five galaxies display an irregular morphology in emission-lines; in II Zw 33 and Mrk 314, the SF regions are aligned to form a chain, while in Haro 1, NGC 4670 and III Zw 102 the ionized gas departs from the inner regions, giving rise to a complex pattern, where the presence of several bubbles and filaments is remarkable.
On the other hand, the continuum morphology is regular in the five objects; (the jagged appearance of the Haro 1 continuum map is due to the presence of a few foreground stars, which have been masked out, and a foreground galaxy at the west). In all the galaxies, the continuum peak is located roughly at the center of the outer isophotes, and its position does not depend on which specific wavelength range is used to build the continuum maps.
II Zw 33
Haro 1
NGC 4670
Mrk 314
III Zw 102
3.2 Line ratio maps
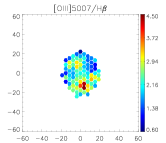
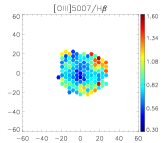
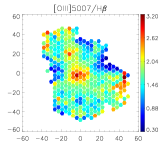
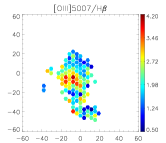
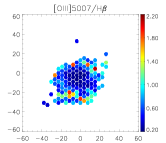
The first row of Figure 7 displays the [O iii] /H maps for the five studied galaxies. This ratio essentially probes the hardness of the stellar radiation field within the nebula, and so high values of [O iii] /H are predicted when the ionization is produced predominantly by UV photons from OB stars (McCall et al. 1985). However it is also sensitive to other factors as e.g. the metallicity (Searle 1971), the distance from the ionizing source to the [O iii] emitting layer (Stasińska 2009), or the presence of shocks (Dopita & Sutherland 1995). Therefore the information provided by [O iii] /H is limited unless additional data regarding these other parameters are added.
For II Zw 33 and Mrk 314, the excitation maps roughly mimic the emission-line maps, the highest [O iii] /H values (), spatially coinciding with the highest peak in emission-lines, as usual in systems photoionized by hot stars.
Both Haro 1 and III Zw 102 show more complex [O iii] /H patterns, with the highest values of the excitation localized in the galaxy periphery. This behavior, frequently found in spiral galaxies, has been interpreted as an abundance gradient (Smith 1975). Interestingly, Haro 1 and III Zw 102 are the two most luminous objects in the sample and both relatively far from the dwarf galaxy regime.
NGC 4670 shows a somewhat complex excitation morphology, with several [O iii] /H peaks, located in the central giant H ii region and at the outer edge of the two larger filaments. For all five galaxies, the excitation levels are consistent with H ii-like ionization.
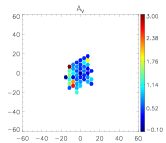
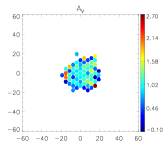
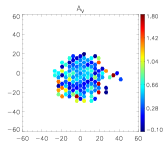
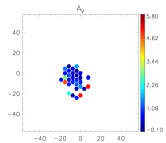
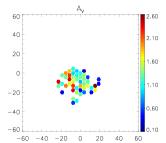
Interstellar extinction can be probed by comparing the observed ratios of hydrogen recombination lines with their theoretical values (Osterbrock & Ferland 2006). In the optical domain, extinction maps are usually derived from the ratio H/H as it involves the strongest lines, and therefore, the easiest to measure. In our case, lacking H, we have derived the extinction from the H/H line ratio; the extent of the extinction maps is dictated by the extent of the H maps (as said in Sect. 2.5 we measured H only in the continuum-subtracted spectra.
The extinction maps are shown in the second row of Fig. 7 using the parameter. We adopted the Case B, low density limit, K approximation, where the theoretical H/H ratio is 2.15 (Osterbrock & Ferland 2006). The Cardelli extinction law was used to derive from the observed H/H value.
II Zw 33
Haro 1
NGC 4670
Mrk 314
III Zw 102
3.3 Ionized gas and stellar kinematics
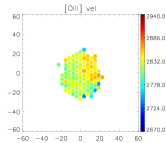
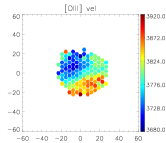
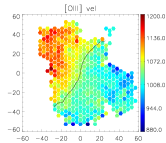
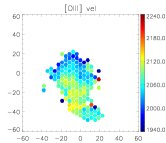
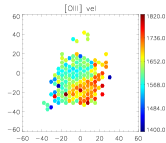
We study the kinematics of the ionized gas using the [O iii] emission-line, except for III Zw 102 for which we use H, much stronger than [O iii]. Due to the low spectral resolution of our data (about 5 Å FWHM), no reliable velocity dispersion measurements could be obtained.
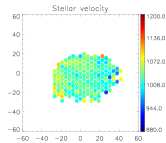
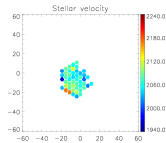
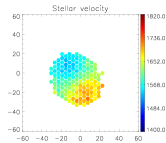
The velocity fields are shown in Figure 7 (row three); in these maps red and blue colors represent, respectively, redshifted and blueshifted regions with respect to the recessional velocity of each BCG. To estimate the errors on the velocity data, we made a combined plot (all galaxies together) of the uncertainty on the [O iii] emission-line centroid versus the logarithm of its flux. For the error is km s-1, in agreement with the mean uncertainty estimated from the scatter in the velocity maps built on the 5577 Å skyline. The error increases to about 10–15 km s-1 at , to 25–30 km s-1 at , and reaches or exceeds 40 km s-1 at fainter flux levels.
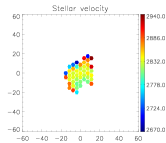
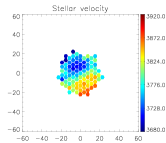
The pPXF program provides, besides the best fitting stellar template, the radial velocity and associated uncertainty for each fitted spaxel, allowing us to produce the galaxy’s stellar velocity field (given in Figure 7, row four).
The uncertainty on the stellar radial velocity varies between km s-1 in the nuclear regions and km s-1 in the outer spaxels.
3.4 Integrated spectroscopy
For every galaxy we have also produced its integrated and nuclear spectrum. In order to generate the integrated spectrum we included only those spaxels in which the stellar contribution was successfully modeled as a sum of templates (see Section 2.4); in this way we ensure a better correction for the contribution of the underlying stellar population and, therefore, a more accurate determination of the emission-lines fluxes. The integrated spectrum was produced by summing together the individual pure emission-line spectra of the selected spaxels. A corresponding continuum spectrum was obtained by summing the best-fit continuum spectra for the same spaxels.
On the same line, we also obtained line-emission and best-fit continuum spectra for the central region by summing over 6–8 spaxels around the continuum peak (for short, we shall refer to them as “nuclear spectra”).

Figure 8 displays the integrated spectra for the sample objects. All objects but III Zw 102 display a typical BCG spectrum, in which strong optical emission-lines are superposed on an almost flat continuum. On the contrary, III Zw 102’s spectral shape, with a high and red continuum, resembles more those typical of an early type galaxy, rather than those of BCGs. All objects display prominent absorption features, including the higher-order Balmer lines, H, H, H, Ca ii H and K lines, and the G-band at 4304 Å.
For both the integrated and nuclear spectra, the flux of the visible emission-lines was measured on the pure emission-line spectrum using the Gaussian profile fitting option in the IRAF task splot. In order to compute equivalent widths, the continuum level was measured on the best-fit continuum spectrum. For Balmer lines, the continuum level was determined by interpolating over the absorption feature using two continuum windows on either side. The interstellar extinction coefficient, (H), was computed through a least-square fit to the Balmer decrement, using the H, H and H lines.
Reddening-corrected intensity ratios and equivalent widths of the integrated and nuclear spectra are listed in Table 3. The listed uncertainties on the line ratios and the H fluxes are derived by summing in quadrature measurement errors, uncertainties on the flux calibration (Sect. 2.3) and the uncertainty on the computed (H).
| Ion | II Zw 33 | Haro 1 | |||||||
|---|---|---|---|---|---|---|---|---|---|
| Integrated | Nucleus | Integrated | Nucleus | ||||||
| 3727 | [O ii] | ||||||||
| 3835 | H9 | — | — | — | — | ||||
| 3868 | [Ne III] | ||||||||
| 3889 | HeI+H8 | ||||||||
| 3968 | [Ne III] | — | — | — | — | ||||
| 4101 | H | ||||||||
| 4340 | H | ||||||||
| 4363 | [O III] | — | — | — | — | ||||
| 4861 | H | ||||||||
| 4959 | [O III] | ||||||||
| 5007 | [O III] | ||||||||
| Area: kpc2 | Area: kpc2 | Area: kpc2 | Area: kpc2 | ||||||
| Ion | NGC 4670 | Mrk 314 | |||||||
| Integrated | Nucleus | Integrated | Nucleus | ||||||
| 3727 | [O ii] | ||||||||
| 3835 | H9 | ||||||||
| 3868 | [Ne III] | ||||||||
| 3889 | HeI+H8 | ||||||||
| 3968 | [Ne III] | ||||||||
| 4101 | H | ||||||||
| 4340 | H | ||||||||
| 4363 | [O III] | — | — | — | — | ||||
| 4861 | H | ||||||||
| 4959 | [O III] | ||||||||
| 5007 | [O III] | ||||||||
| Area: kpc2 | Area: kpc2 | Area: kpc2 | Area: kpc2 | ||||||
| Ion | III Zw 102 | ||||||||
| Integrated | Nucleus | ||||||||
| 3727 | [O ii] | ||||||||
| 3835 | H9 | — | — | — | — | ||||
| 3868 | [Ne III] | — | — | — | — | ||||
| 3889 | HeI+H8 | — | — | — | — | ||||
| 3968 | [Ne III] | — | — | — | — | ||||
| 4101 | H | ||||||||
| 4340 | H | ||||||||
| 4363 | [O III] | — | — | — | — | ||||
| 4861 | H | ||||||||
| 4959 | [O III] | ||||||||
| 5007 | [O III] | ||||||||
| Area: kpc2 | Area: kpc2 | ||||||||
3.4.1 Heavy element abundances
In the two galaxies Mrk 314 and II Zw 33, where the [O iii] auroral line could be measured, electron temperatures and oxygen and neon abundances were derived using the ”direct” method.
First, we computed the electron temperature (O III) from the [O iii] /[O iii] ratio using the equations provided by Aller (1984). As in our spectra there are no useful lines to obtain the electron density, , we assumed cm-3.
The metal abundances were derived using the revised expressions in Izotov et al. (2006b), which take into account the latest atomic data and incorporate an appropriate grid of photoionization models with state-of-the-art model atmospheres. We used their equations (3) and (5) to compute the O+/H, O++/H and Ne2+ abundances, after computing (O II) using equation (14). The total oxygen abundance was obtained by simply summing the abundances of O+ and O++, as the fraction of the O+++ ion is generally negligible. The correction factor for Ne, , was computed using equation (19). (Using the ratio instead of the ICF we would get a Ne abundance about 0.2 dex larger.)
For the remaining three galaxies, where [O iii] could not be measured, we had to rely on the so-called ”strong-line methods”, in order to derive the oxygen abundance. We adopted the revised calibration of the P-method (Pilyugin 2000, 2001), provided in Pilyugin & Thuan (2005).
Electron temperatures and abundances are listed in Table 4. For II Zw 33 and Mrk 314, we provide only the abundances derived from the direct method; since both galaxies lie in the transition zone , the Pilyugin & Thuan (2005) calibration does not give reliable abundance values.
| II Zw 33 | Haro 1 | NGC 4670 | Mrk 314 | III Zw 102 | ||||||
| Value | Integrated | Nuclear | Integrated | Nuclear | Integrated | Nuclear | Integrated | Nuclear | Integrated | Nuclear |
| (O III) (K) | — | — | — | — | — | — | ||||
| (O II) (K) | — | — | — | — | — | — | ||||
| 111111O | — | — | ||||||||
| 222222O | — | — | — | — | 8.44 | 8.49 | ||||
| — | — | — | — | — | — | |||||
3.4.2 Comparison with literature data
To assess the quality of our measurements, we compared our integrated fluxes and equivalent widths with the integrated data published by Moustakas & Kennicutt (2006). Four of our objects are in common with their sample, the exception being II Zw 33.
For this comparison, our measurements have been corrected for foreground galactic extinction only. The results of the comparison are displayed in Figure 9. Taking into account the different integration area used in the Moustakas & Kennicutt (2006) spectra (a aperture) and our own spectra, the comparison looks fair.

4 Discussion
4.1 II Zw 33 (=Mrk 1094)
II Zw 33 is a well-studied object, cataloged as BCG in Thuan & Martin (1981). Optical imaging and surface photometry has been presented in several works (Loose & Thuan 1986; Cairós et al. 2001a, b; Gil de Paz et al. 2003; Gil de Paz & Madore 2005). The presence of a central SF bar and the striking twisting of the isophotes have been interpreted as interaction signs (Méndez et al. 1999). II Zw 33 is also a well known Wolf-Rayet (WR) galaxy, included in the WR galaxy lists by Vacca & Conti (1992) and Schaerer et al. (1999).
Maps of II Zw 33 are displayed in Figures 6 and 7. At the II Zw 33 distance, the fiber diameter provides a spatial sampling of 760 pc per spaxel.
The line emission is concentrated along a central bar-like structure, with no clear peak, while the stellar emission extends further out from the central SF regions, evidencing the presence of a much more extended, more evolved stellar population. The continuum map displays a well defined peak, located roughly at the center of the galaxy.
The excitation map ([O iii]/H) traces the regions of star-formation, as expected for objects photoionized by stars. The peak in [O iii]/H is located at the southern tip of the bar (knot ’A’ as labeled in Méndez et al. 1999); their value of 5.5 agrees well with the peak value we find, (the small discrepancy is likely due to the difference in spatial resolution).
The extinction is relatively uniform in the central region, with values around 0.4; these values are significantly smaller than those published by Méndez et al. (1999).
The [O iii] velocity map does not show a clear rotation pattern, although the northwest side seems to have a slightly higher radial velocity as a whole. The ionized gas kinematics is in good qualitative agreement with the H I kinematical map published by (Walter et al. 1997, see their Fig. 6). The stellar velocity field is not as extended as required to make a sensible comparison, and is also much noisier.
We derived an oxygen abundance of , in good agreement with the value of reported by Shi et al. (2005), who also used the method.
The Wolf-Rayet bump around 4600–4680 Å is visible in two spaxels, marked by a star in the [O iii] flux maps in Figure 6.
4.2 Haro 1 (=NGC 2415)
Haro 1 is classified as BCG by Gordon & Gottesman (1981) and Klein et al. (1984), and is included in the H ii galaxies sample studied by Deeg et al. (1997). It has been defined as a paired galaxy with little (if any) tidal disturbance (Schneider & Salpeter 1992). Its companion is UGC 3937, with a redshift difference of only 210 km s-1 and a projected distance of 350 kpc (23 arcmin at Haro 1’s distance). Broad-band surface brightness photometry was presented in Cairós et al. (2001a, b).
Maps are shown in Figures 6 and 7 (column 2). At the Haro 1 distance, the spatial resolution is about 1.1 kpc per spaxel.
Haro 1 displays outer regular isophotes in the continuum maps. (The jagged appearance is the result of masking several foreground stars; for the sake of clarity, a smaller star, located at east from the center, has been left, as well as the background galaxy on the west-side). The continuum emission peak is placed roughly at the center of the isophotes. The emission-line maps display a more irregular pattern: a considerably large filament extends out to the north-west, and the emission peak seems to be slightly offset to the west with respect to the continuum peak.
The [O iii]/H ratio map has a shallow minimum, 0.40, in the galaxy’s central region (where the emission peaks), and increases slightly outwards, reaching its maximum at the position of the extension detected in emission-line maps. Radial changes in the [O iii]/H ratio have been found in spiral galaxies, and have been interpreted as variation in the heavy element abundances (Searle 1971; Smith 1975). Interestingly, Haro 1 is the most luminous object in our sample, and it has been also classified as a Sm galaxy (HyperLeda888http://leda.univ-lyon1.fr; Paturel et al. 2003).
The extinction map shows little or no spatial variations, with an average extinction .
Haro 1’s kinematics show an overall regular rotation about an axis oriented southeast-northwest, with pretty much the same pattern and amplitude (about 160 km s-1) both in the gas and in the stellar velocity maps.
4.3 NGC 4670 (=Haro 9, Arp 163)
NGC 4670 has been classified as a blue amorphous galaxy (Hunter et al. 1994; Marlowe et al. 1997), as a peculiar, barred S0/a galaxy (de Vaucouleurs et al. 1991) and as a BCG (Gil de Paz et al. 2003). It is listed as a peculiar galaxy with ”diffuse counter tails” in Arp’s catalogue (Arp 1966), and as a WR galaxy in Mas-Hesse & Kunth (1999) and Schaerer et al. (1999). Broad-band photometry and H imaging have been provided in Gil de Paz et al. (2003), Gil de Paz & Madore (2005) and Marlowe et al. (1997). It is also cataloged as a WR galaxy .
Maps are shown in Figures 6 and 7 (column 3). At the NGC 4670 distance, the VIRUS-P IFU fiber diameter corresponds to about 460 pc.
The continuum map shows an outer regular morphology, with elliptical isophotes; the bulge, extremely bright, is clearly elongated on an east-west axis. The continuum peak appears to be a little displaced to the east, in agreement with the -band image (Figure 1). In emission-lines, the galaxy displays a rather complex pattern, with a central, roughly circular and very bright H ii region, surrounded by an extended filamentary envelope, which has several bubbles, loops and extensions. Remarkable are the two biggest filaments, which expand to the southwest and northeast, extending up to about 7.5 and 6.5 kpc respectively.
The ionization map displays an intriguing structure. The [O iii]/H ratio clearly shows higher values in the central region, with a peak value , and at the outer edge of the two larger extensions. Highest values of [O iii]/H in the central knot, where the line-emission intensity also peaks, are consistent with photoionization produced by hot stars; it is not clear however what the ionizing mechanism acting on the filaments is. Although the morphology suggests a shock-like excitation mechanism, no conclusions can be drawn without the measurement of additional diagnostic lines. The excitation values we found agree very well with those reported in Hunter et al. (1994), [O iii]/H = 2.97, derived for the spectra positioned on the center of the galaxy.
The extinction map shows a roughly flat behavior in the inner region, with around 0.40, and seems to be dominated by noise in the outer parts.
Hunter et al. (1994), analyzing VLA data, report an “ordered rotation east-west, and the motion appears to be that of a disk at the same position angle as the optical galaxy ()”. Our velocity maps show a more complex picture. At first sight a rotation pattern, though somewhat irregular, is visible in the gaseous component, with an amplitude of about 150 km s-1, around an axis oriented roughly northwest-southeast; the velocity gradient seems to be a little steeper in the northeast side of the galaxy compared to the southwest part. The stellar velocity field is overall flat, and broadly agrees with the gas kinematics in the same area, except for the slight velocity rise toward its east edge, visible in the [O iii] radial velocity map but not in the stellar one.
The behavior of the gas and stellar kinematics can be better perceived in Fig 10, where we plot a velocity profile along a line with , where the gas distribution extends the most from the galaxy center, and a velocity profile at , the value adopted by Hunter et al. (1994). Both graphs show a somewhat irregular rise of the gas velocity in a central region of about in size, and are flat, though noisier, outside it. The stellar velocity profile shows that the stars co-rotate with the gas, but with a lower velocity gradient, and seems to flatten out at somewhat smaller radial distance than the gas. Furthermore, the isovelocity contour at km s-1 in the [O iii] velocity field is clearly S-shaped, a characteristic typical of barred galaxies (Peterson et al. 1978).
Thus, the kinematics of NGC 4670 is unlike the one of a rotating disk, and resembles more the kinematics of a barred galaxy, in line with its morphological classification, SB(s)0/aP?, listed in de Vaucouleurs et al. (1991).
The derived metallicity, , is slightly lower but consistent with the value of reported in Mas-Hesse & Kunth (1999).
The Wolf-Rayet bump around 4600–4680 Å is visible in three spaxels, marked by a star in the [O iii] flux maps in Figure 6.

4.4 Mrk 314 (=NGC 7468)
Mrk 314 has been cataloged as a polar-ring galaxy candidate (Whitmore et al. 1990; van Driel et al. 2000) and is included in the Mazzarella & Boroson (1993) catalogue of multiple nuclei galaxies. Surface photometry in the optical and in the NIR was presented in Cairós et al. (2001a, b), Caon et al. (2005) and Noeske et al. (2005).
The maps of Mrk 314 are shown in Figures 6 and 7 (column 4). The spatial sampling is about 590 pc per spaxel.
The galaxy displays a similar morphology in both emission-line and continuum maps, with the SF knots aligned along the northeast southwest direction. In the continuum map, a more extended stellar component, with elliptical isophotes, surrounds the SF region. The brighter knot is located roughly at the center of the outer isophotes, and a tail-like feature departs in the southwest direction; a second filament extends out to the northwest. In the emission-line maps, the emission is concentrated in a central SF bar, the emission peak being slightly displaced from the continuum peak.
The peak of the [O iii]/H ratio is spatially co-located with the line emission maximum, as expected for objects ionized by OB hot stars; the excitation peak value of agrees well with the value found by García-Lorenzo et al. (2008).
The extinction map does not show any definite pattern, but a more or less homogeneous distribution with somewhat higher values at the south, and a value around 0.7–0.8 in the central part; this result is consistent with the H/H map presented in García-Lorenzo et al. (2008), measured in a smaller FOV ().
The ionized gas velocity field displays a complicated pattern. Around the main body of the galaxy, the velocity field is similar to a rotating disk, with the rotation axis oriented east-west, the northern side approaching and the southern one receding. This rotation is however perturbed in the central galaxy regions (within ), where the velocity field shows an S-shape distortion, indicative of the presence of a second rotating system. South of the main body (this area coincides with the tail-like feature), the ionized gas is not rotating with the main-body galaxy disk.
An extensively kinematic analysis of this galaxy has been done by Shalyapina et al. (2004), who found that Mrk 314 harbors two kinematics subsystems of ionized gas: the main gaseous disk, and a smaller inner disk oriented orthogonally to it. Our coarse spatial resolution does not allow us to either confirm or disprove the existence this inner disk, but the kinematics of the main disk agree well with the data shown by Shalyapina et al. (2004): see for instance the peak in the velocity profile at south of the nucleus, and then the sharp decrease (their Fig. 2a).
The stellar velocity field looks more irregular, though there seems to be some rotation along an axis at about , with a total amplitude of about 70–80 km s-1.
The oxygen abundance we found in the integrated spectrum, , is somewhat lower than the one reported by Shi et al. (2005), (derived using also the method), and the ones reported by García-Lorenzo et al. (2008), which range spatially from 8.14 to 8.35 (using the empirical calibrator N2, Denicoló et al. 2002).
4.5 III Zw 102 (=NGC 7625, Arp 212)
III Zw 102 is a galaxy well studied in a large range of wavelengths, but still a puzzling system. It is included in the Vorontsov-Velyaminov catalogue of interacting galaxies (Vorontsov-Velyaminov 1959) and in Arp’s Atlas of Peculiar Galaxies (Arp 1966). It has been classified as a SA(rs) a pec in RC2 (de Vaucouleurs et al. 1976), as a S0 pec (Lynds & Furenlid 1973), as an elliptical with dust lanes (Hawarden et al. 1981; Bertola 1987; Yasuda et al. 1992), and as a BCG (Thuan & Martin 1981). Whitmore et al. (1990) considered III Zw 102 to be ”related to polar-ring galaxies”. Broad-band photometry was presented in Cairós et al. (2001a, b). III Zw 102 kinematics was first studied by Demoulin (1969), which concludes, from optical spectroscopy, that the galaxy rotates as a nearly solid body within the central . H i gas displays a more complicated behavior, with the outer H i showing apparent counter-rotation with respect to the stellar and molecular gas components (Li et al. 1993).
Results from 3D investigations of III Zw 102 have been published in García-Lorenzo et al. (2008), where the central of the galaxy were mapped with a spatial resolution of spaxel-1, using the IFS integral, and in Moiseev (2008), where the distribution and kinematics of the ionized gas was studied by means of Fabry-Perot scanning interferometry.
Maps of III Zw 102 are shown in Figures 6 and 7 (column 5). The VIRUS-P IFU fiber diameter corresponds to about 470 pc.
In the continuum the galaxy displays outer circular isophotes, indicative of the presence of an underlying population of older stars, extending up to a radius of about 7 kpc. The central regions are more irregular, and have elliptical isophotes, with the major axis oriented in the northeast-southwest direction. The presence of dust is clear seen on the continuum map: a dust lane crosses the galaxy in a southwest-northeast direction, almost parallel to the ellipses’ major axis, and large dust patches are also evident at the south, almost parallel to the galaxy minor axis. In the narrow-band maps the morphology is more irregular, with several filaments, bubbles and holes. The extended filaments, departing to the southeast and to the northwest, are very well traced in the [O ii] and H maps.
The [O iii]/H ratio (see Figure 7) is lower in the central part of the galaxy, with a minimum value of , in good agreement with the values published by García-Lorenzo et al. (2008). The excitation, like in Haro 1, increases towards the galaxy outskirts, a behavior often seen in spiral galaxies (Smith 1975). Just like Haro 1, III Zw 102 is a luminous object, which has been classified as a spiral by de Vaucouleurs et al. (1976).
The extinction map is highly inhomogeneous, and traces well the dust lanes detected in optical frames and color maps. The values are indicative of a considerable amount of dust.
The stellar kinematics display an overall rotation around an axis oriented approximately northwest-southeast, with the northeast side approaching and the southwest receding, and a velocity amplitude of about 160 km s-1. The gas kinematics, which in this galaxy is better mapped by the H line (stronger than [O iii]) broadly agrees with the stellar kinematics in the inner region. Notable are the two features protruding from either side of the galaxy, and which, together with the knot northeast of the galaxy center, seem to form a structurally and kinematically independent system. These findings are in line with the results of the detailed analysis of this galaxy published by Moiseev (2008): III Zw 102 is made up of two distinct systems: an inner disk, where gas and stars co-rotate, and a polar ring orthogonal to it.
The oxygen abundances, in the integrated spectrum, and in the nuclear spectrum, are much lower than those derived in García-Lorenzo et al. (2008) using the empirical calibrator N2 (Denicoló et al. 2002), ranging from 8.81 to 8.84 in the circumnuclear regions and about 8.85 for the nucleus. While the disagreement can be due partly to the different corrections for the underlying absorption at H, discrepancies of up to 0.4 dex between values obtaining using the P-method and N2 have already been reported (Shi et al. 2005).
5 Summary
We present results of an IFS analysis of five luminous BCG galaxies, based on VIRUS-P data covering the wavelength interval 3550–5850 Å with a resolution of about 5 Å FWHM. The mapped area is by , each fiber corresponding to a circle of on the sky.
For each galaxy, spaxel by spaxel, we modeled and subtracted the stellar continuum before fitting the most important emission-lines with a Gaussian. We produced an atlas of maps of the most relevant emission-lines in the spectra: [O ii] , H, H, and [O iii] , of the continuum, of the extinction () and the excitation ([O iii] /H) ratios, as well as of the gas and the stellar kinematics. Integrated and nuclear spectroscopic properties (line fluxes, extinction coefficient, and metal abundances) were also derived. From this study, we highlight the following results:
-
•
All galaxies show a regular morphology in the continuum, with outer elliptical or circular isophotes; the ionized gas displays a more complex pattern, with filamentary emission and the presence of bubbles and holes. Remarkable are NGC 4670, where the gas emission shows two large extensions north and southwest of the center, and III Zw 102, where the two narrow features protruding almost symmetrically from the main body, and a knot north of the galaxy center, form part of a polar ring.
-
•
The galaxies display different ionization patterns: in II Zw 33 and Mrk 314 the excitation ratio, [O iii] /H traces the SF regions, as expected in objects ionized by stars. NGC 4670 has a somewhat complex pattern, with [O iii] /H peaking in the central [H ii] region and at the outer edge of the two large filaments. These three galaxies have excitation ratios larger than one. In Haro 1 and III Zw 102, H is stronger than [O iii], and the excitation does not trace the SF regions, but has a minimum in the central galaxy regions (where the emission peaks) and increases towards the galaxy outskirts.
-
•
All galaxies possess significant amounts of dust, with interstellar reddening values up to .
-
•
A variety of kinematical behaviors are present in the sample galaxies. II Zw 33 shows little or no rotation, while in Haro 1 gas and stars both display the same overall regular rotation pattern. The kinematics of NGC 4670 is typical of a barred galaxy, with S-shaped isovelocity contours in the gaseous component; stars co-rotate with the gas, albeit with a smaller gradient and amplitude. Mrk 314 has an irregular rotation pattern, with a drop in velocity in its southern lobe. The most complex object is III Zw 102, with two kinematically independent systems: an inner disk, where gas and stars co-rotate, and a polar ring orthogonal to it.
Acknowledgements.
L. M. Cairós acknowledges the Alexander von Humboldt Foundation. VIRUS-P has been made possible by a generous donation from the Cynthia and George Mitchell Foundation. This paper includes data taken at The McDonald Observatory of the University of Texas at Austin. We thank J. N. González-Pérez and J. Falcón Barroso for stimulating discussions and tips on the data processing and analysis. N. Caon is grateful for the hospitality of the Leibniz-Institut für Astrophysik. This research has made use of the NASA/IPAC Extragalactic Database (NED), which is operated by the Jet Propulsion Laboratory, Caltech, under contract with the National Aeronautics and Space Administration. This work has been funded by the Spanish Ministry of Science and Innovation (MCINN) under the collaboration ”Estallidos” (grants HA2006-0032, AYA2007-67965-C03-01 and AYA2010-21887-C04-04). P. Papaderos is supported by Ciencia 2008 Contract, funded by FCT/MCTES (Portugal) and POPH/FSE (EC).References
- Aller (1984) Aller, L. H., ed. 1984, Astrophysics and Space Science Library, Vol. 112, Physics of thermal gaseous nebulae
- Arp (1966) Arp, H. 1966, ApJS, 14, 1
- Bergvall (2012) Bergvall, N. 2012, Star Forming Dwarf Galaxies, ed. P. Papaderos, S. Recchi, & G. Hensler, 175
- Bergvall & Östlin (2002) Bergvall, N. & Östlin, G. 2002, A&A, 390, 891
- Bertola (1987) Bertola, F. 1987, in IAU Symposium, Vol. 127, Structure and Dynamics of Elliptical Galaxies, ed. P. T. de Zeeuw, 135–144
- Blanc et al. (2009) Blanc, G. A., Heiderman, A., Gebhardt, K., Evans, N. J., & Adams, J. 2009, ApJ, 704, 842
- Burstein & Heiles (1982) Burstein, D. & Heiles, C. 1982, AJ, 87, 1165
- Cairós et al. (2007) Cairós, L. M., Caon, N., García-Lorenzo, B., et al. 2007, ApJ, 669, 251
- Cairós et al. (2002) Cairós, L. M., Caon, N., García-Lorenzo, B., Vílchez, J. M., & Muñoz-Tuñón, C. 2002, ApJ, 577, 164
- Cairós et al. (2009a) Cairós, L. M., Caon, N., Papaderos, P., et al. 2009a, ApJ, 707, 1676
- Cairós et al. (2003) Cairós, L. M., Caon, N., Papaderos, P., et al. 2003, ApJ, 593, 312
- Cairós et al. (2001a) Cairós, L. M., Caon, N., Vílchez, J. M., González-Pérez, J. N., & Muñoz-Tuñón, C. 2001a, ApJS, 136, 393
- Cairós et al. (2010) Cairós, L. M., Caon, N., Zurita, C., et al. 2010, A&A, 520, A90
- Cairós et al. (2009b) Cairós, L. M., Caon, N., Zurita, C., et al. 2009b, A&A, 507, 1291
- Cairós et al. (2001b) Cairós, L. M., Vílchez, J. M., González Pérez, J. N., Iglesias-Páramo, J., & Caon, N. 2001b, ApJS, 133, 321
- Caon et al. (2005) Caon, N., Cairós, L. M., Aguerri, J. A. L., & Muñoz-Tuñón, C. 2005, ApJS, 157, 218
- Cappellari & Emsellem (2004) Cappellari, M. & Emsellem, E. 2004, PASP, 116, 138
- de Vaucouleurs et al. (1991) de Vaucouleurs, G., de Vaucouleurs, A., Corwin, Jr., H. G., et al. 1991, Third Reference Catalogue of Bright Galaxies, ed. de Vaucouleurs, G., de Vaucouleurs, A., Corwin, H. G., Jr., Buta, R. J., Paturel, G., & Fouque, P.
- de Vaucouleurs et al. (1976) de Vaucouleurs, G., de Vaucouleurs, A., & Corwin, J. R. 1976, in Second reference catalogue of bright galaxies, 1976, Austin: University of Texas Press.
- Deeg et al. (1997) Deeg, H., Duric, N., & Brinks, E. 1997, A&A, 323, 323
- Demoulin (1969) Demoulin, M.-H. 1969, ApJ, 157, 69
- Denicoló et al. (2002) Denicoló, G., Terlevich, R., & Terlevich, E. 2002, MNRAS, 330, 69
- Dopita & Sutherland (1995) Dopita, M. A. & Sutherland, R. S. 1995, ApJ, 455, 468
- Doublier et al. (1999) Doublier, V., Caulet, A., & Comte, G. 1999, A&AS, 138, 213
- Doublier et al. (1997) Doublier, V., Comte, G., Petrosian, A., Surace, C., & Turatto, M. 1997, A&AS, 124, 405
- Fanelli et al. (1988) Fanelli, M. N., O’Connell, R. W., & Thuan, T. X. 1988, ApJ, 334, 665
- García-Lorenzo et al. (2008) García-Lorenzo, B., Cairós, L. M., Caon, N., Monreal-Ibero, A., & Kehrig, C. 2008, ApJ, 677, 201
- Gil de Paz & Madore (2005) Gil de Paz, A. & Madore, B. F. 2005, ApJS, 156, 345
- Gil de Paz et al. (2003) Gil de Paz, A., Madore, B. F., & Pevunova, O. 2003, ApJS, 147, 29
- Gordon & Gottesman (1981) Gordon, D. & Gottesman, S. T. 1981, AJ, 86, 161
- Grimes et al. (2009) Grimes, J. P., Heckman, T., Aloisi, A., et al. 2009, ApJS, 181, 272
- Guseva et al. (2003a) Guseva, N. G., Papaderos, P., Izotov, Y. I., et al. 2003a, A&A, 407, 75
- Guseva et al. (2003b) Guseva, N. G., Papaderos, P., Izotov, Y. I., et al. 2003b, A&A, 407, 91
- Guseva et al. (2003c) Guseva, N. G., Papaderos, P., Izotov, Y. I., et al. 2003c, A&A, 407, 105
- Hawarden et al. (1981) Hawarden, T. G., Longmore, A. J., Tritton, S. B., Elson, R. A. W., & Corwin, Jr., H. G. 1981, MNRAS, 196, 747
- Hill et al. (2007) Hill, G. J., MacQueen, P. J., Adams, J., et al. 2007, in Bulletin of the American Astronomical Society, Vol. 39, American Astronomical Society Meeting Abstracts, 747
- Hill et al. (2008) Hill, G. J., MacQueen, P. J., Smith, M. P., et al. 2008, in Presented at the Society of Photo-Optical Instrumentation Engineers (SPIE) Conference, Vol. 7014, Society of Photo-Optical Instrumentation Engineers (SPIE) Conference Series
- Hill et al. (2006) Hill, G. J., MacQueen, P. J., Tufts, J. R., et al. 2006, in Presented at the Society of Photo-Optical Instrumentation Engineers (SPIE) Conference, Vol. 6269, Society of Photo-Optical Instrumentation Engineers (SPIE) Conference Series
- Hunter & Elmegreen (2004) Hunter, D. A. & Elmegreen, B. G. 2004, AJ, 128, 2170
- Hunter et al. (1994) Hunter, D. A., van Woerden, H., & Gallagher, III, J. S. 1994, ApJS, 91, 79
- Izotov et al. (2010) Izotov, Y. I., Guseva, N. G., Fricke, K. J., et al. 2010, A&A, 517, A90
- Izotov et al. (2006a) Izotov, Y. I., Schaerer, D., Blecha, A., et al. 2006a, A&A, 459, 71
- Izotov et al. (2006b) Izotov, Y. I., Stasińska, G., Meynet, G., Guseva, N. G., & Thuan, T. X. 2006b, A&A, 448, 955
- James et al. (2009) James, B. L., Tsamis, Y. G., Barlow, M. J., et al. 2009, MNRAS, 398, 2
- Klein et al. (1984) Klein, U., Wielebinski, R., & Thuan, T. X. 1984, A&A, 141, 241
- Kniazev et al. (2004) Kniazev, A. Y., Pustilnik, S. A., Grebel, E. K., Lee, H., & Pramskij, A. G. 2004, ApJS, 153, 429
- Kunth & Östlin (2000) Kunth, D. & Östlin, G. 2000, A&A Rev., 10, 1
- Li et al. (1993) Li, J. G., Seaquist, E. R., Wrobel, J. M., Wang, Z., & Sage, L. J. 1993, ApJ, 413, 150
- Loose & Thuan (1986) Loose, H.-H. & Thuan, T. X. 1986, in Star-forming Dwarf Galaxies and Related Objects, 73–88
- Lynds & Furenlid (1973) Lynds, B. T. & Furenlid, I. 1973, ApJ, 186, 445
- Marlowe et al. (1997) Marlowe, A. T., Meurer, G. R., Heckman, T. M., & Schommer, R. 1997, ApJS, 112, 285
- Mas-Hesse & Kunth (1999) Mas-Hesse, J. M. & Kunth, D. 1999, A&A, 349, 765
- Mas-Hesse et al. (2003) Mas-Hesse, J. M., Kunth, D., Tenorio-Tagle, G., et al. 2003, ApJ, 598, 858
- Mazzarella & Boroson (1993) Mazzarella, J. M. & Boroson, T. A. 1993, ApJS, 85, 27
- McCall et al. (1985) McCall, M. L., Rybski, P. M., & Shields, G. A. 1985, ApJS, 57, 1
- Méndez et al. (1999) Méndez, D. I., Cairós, L. M., Esteban, C., & Vílchez, J. M. 1999, AJ, 117, 1688
- Moiseev (2008) Moiseev, A. V. 2008, Astrophysical Bulletin, 63, 201
- Moustakas & Kennicutt (2006) Moustakas, J. & Kennicutt, Jr., R. C. 2006, ApJS, 164, 81
- Murphy et al. (2011) Murphy, J. D., Gebhardt, K., & Adams, J. J. 2011, ApJ, 729, 129
- Noeske et al. (2005) Noeske, K. G., Papaderos, P., Cairós, L. M., & Fricke, K. J. 2005, A&A, 429, 115
- Osterbrock & Ferland (2006) Osterbrock, D. E. & Ferland, G. J. 2006, Astrophysics of gaseous nebulae and active galactic nuclei (Astrophysics of gaseous nebulae and active galactic nuclei, 2nd. ed. by D.E. Osterbrock and G.J. Ferland. Sausalito, CA: University Science Books, 2006)
- Papaderos et al. (2008) Papaderos, P., Guseva, N. G., Izotov, Y. I., & Fricke, K. J. 2008, A&A, 491, 113
- Papaderos et al. (1998) Papaderos, P., Izotov, Y. I., Fricke, K. J., Thuan, T. X., & Guseva, N. G. 1998, A&A, 338, 43
- Papaderos et al. (1996) Papaderos, P., Loose, H.-H., Thuan, T. X., & Fricke, K. J. 1996, A&AS, 120, 207
- Paturel et al. (2003) Paturel, G., Petit, C., Prugniel, P., et al. 2003, A&A, 412, 45
- Peterson et al. (1978) Peterson, C. J., Thonnard, N., Rubin, V. C., & Ford, Jr., W. K. 1978, ApJ, 219, 31
- Pilyugin (2000) Pilyugin, L. S. 2000, A&A, 362, 325
- Pilyugin (2001) Pilyugin, L. S. 2001, A&A, 369, 594
- Pilyugin & Thuan (2005) Pilyugin, L. S. & Thuan, T. X. 2005, ApJ, 631, 231
- Renka & Cline (1984) Renka, L. L. & Cline, A. K. 1984, Rocky Mountain J. Math, 14, 223
- Sánchez-Blázquez et al. (2006) Sánchez-Blázquez, P., Peletier, R. F., Jiménez-Vicente, J., et al. 2006, MNRAS, 371, 703
- Schaerer et al. (1999) Schaerer, D., Contini, T., & Pindao, M. 1999, A&AS, 136, 35
- Schlafly & Finkbeiner (2011) Schlafly, E. F. & Finkbeiner, D. P. 2011, ApJ, 737, 103
- Schlegel et al. (1998) Schlegel, D. J., Finkbeiner, D. P., & Davis, M. 1998, ApJ, 500, 525
- Schneider & Salpeter (1992) Schneider, S. E. & Salpeter, E. E. 1992, ApJ, 385, 32
- Searle (1971) Searle, L. 1971, ApJ, 168, 327
- Shalyapina et al. (2004) Shalyapina, L. V., Moiseev, A. V., Yakovleva, V. A., Hagen-Thorn, V. A., & Barsunova, O. Y. 2004, Astronomy Letters, 30, 583
- Shi et al. (2005) Shi, F., Kong, X., Li, C., & Cheng, F. Z. 2005, A&A, 437, 849
- Smith (1975) Smith, H. E. 1975, ApJ, 199, 591
- Stasińska (2009) Stasińska, G. 2009, What can emission lines tell us?, ed. J. Cepa, 1
- Thuan & Martin (1981) Thuan, T. X. & Martin, G. E. 1981, ApJ, 247, 823
- Vacca & Conti (1992) Vacca, W. D. & Conti, P. S. 1992, ApJ, 401, 543
- van Driel et al. (2000) van Driel, W., Arnaboldi, M., Combes, F., & Sparke, L. S. 2000, A&AS, 141, 385
- Vanzi et al. (2008) Vanzi, L., Cresci, G., Telles, E., & Melnick, J. 2008, A&A, 486, 393
- Vorontsov-Velyaminov (1959) Vorontsov-Velyaminov, B. A. 1959, in Atlas and catalog of interacting galaxies (1959), 0
- Walter et al. (1997) Walter, F., Brinks, E., Duric, N., & Klein, U. 1997, AJ, 113, 2031
- Whitmore et al. (1990) Whitmore, B. C., Lucas, R. A., McElroy, D. B., et al. 1990, AJ, 100, 1489
- Yasuda et al. (1992) Yasuda, N., Fujisawa, K., Sofue, Y., et al. 1992, PASJ, 44, 1