113\Yearpublication—-\Yearsubmission2012\Month3\Volume—\Issue–
later
The Opacity of Spiral Galaxy Disks IX;
Abstract
Our aim is to explore the relation between gas, atomic and molecular, and dust in spiral galaxies. Gas surface densities are from atomic hydrogen and CO line emission maps. To estimate the dust content, we use the disk opacity as inferred from the number of distant galaxies identified in twelve HST/WFPC2 fields of ten nearby spiral galaxies. The observed number of distant galaxies is calibrated for source confusion and crowding with artificial galaxy counts and here we verify our results with sub-mm surface brightnesses from archival Herschel-SPIRE data. We find that the opacity of the spiral disk does not correlate well with the surface density of atomic (H i) or molecular hydrogen () alone implying that dust is not only associated with the molecular clouds but also the diffuse atomic disk in these galaxies. Our result is a typical dust-to-gas ratio of 0.04, with some evidence that this ratio declines with galactocentric radius, consistent with recent Herschel results. We discuss the possible causes of this high dust-to-gas ratio; an over-estimate of the dust surface-density, an under-estimate of the molecular hydrogen density from CO maps or a combination of both. We note that while our value of the mean dust-to-gas ratio is high, it is consistent with the metallicity at the measured radii if one assumes the Pilyugin & Thuan calibration of gas metallicity.
keywords:
Opacity, ISM: dust, extinction, ISM: structure, Galaxies: ISM, Galaxies: spiral, Galaxies: structure1 Introduction
The radio 21-cm emission of atomic hydrogen (H i) observed in the disks of spiral galaxies is a powerful tracer of the presence and dynamics of the interstellar medium (ISM), extending to well outside the typical scale of the stellar disk. Its origin is likely a mix of “primordial” (Fall & Efstathiou, 1980), or recently accreted material (Sancisi et al., 2008), recycled matter (ejecta raining back onto the disk; e.g., Oosterloo et al., 2007), and skins of photo-dissociated material surrounding molecular clouds (Allen et al., 2004). The other components of the ISM, ionised and molecular hydrogen, metals and dust, are all more difficult to trace, because their emission strengths depend on the local degree of excitation which in turn is affected by particle densities and temperatures, photon densities, and stellar and AGN illumination.
Molecular hydrogen is usually traced with CO(J=1-0 or 2-1) line emission, and from it we have derived our knowledge of the molecular clouds in nearby spirals (e.g, Rosolowsky, 2005; Leroy et al., 2008). However, it remains an open question how sensitive the CO brightness is to the local volume density and temperature of the ISM, and what is the accuracy with which observations of CO surface brightness can be converted into column densities and ultimately into molecular cloud masses. This conversion is also likely to depend on metallicity and hence galactocentric radius (Madden et al., 1997; Israel, 1997; Leroy et al., 2007; Pohlen et al., 2010; Leroy et al., 2011; Foyle et al., 2012).
Nevertheless, a successful and extensive description of the atomic and molecular ISM in spirals and their relation to the star-formation rate is currently being developed, using a multi-wavelength approach to estimate the star-formation rate, and high-resolution H i and CO observations to characterize the ISM in individual galaxies (Calzetti et al., 2005; Kennicutt et al., 2007; Thilker et al., 2007; Bendo et al., 2010b; Foyle et al., 2012), in detail in small samples of galaxies (Cortese et al., 2006; Boissier et al., 2007; Bigiel et al., 2008; Leroy et al., 2008; Schruba et al., 2011), or in a generalized way over a population of galaxies (e.g., Kennicutt, 1998; Buat et al., 2002; Bell et al., 2003; Kannappan, 2004; West et al., 2010; Catinella et al., 2010; Fabello et al., 2011). Star-formation occurs when the combined ISM exceeds a threshold surface density (although the exact threshold is still debated, see e.g., Bigiel et al., 2008; Pflamm-Altenburg & Kroupa, 2008). The ratio between molecular and neutral ISM is set by the hydrostatic pressure (Bigiel et al., 2008; Leroy et al., 2008; Obreschkow et al., 2009). Also, observational models of the role of photo-dissociation in the balance between atomic and molecular hydrogen have made steady progress (Allen et al., 1997, 2004; Smith et al., 2000; Heiner et al., 2008a, b, 2009, 2010).
As an alternative to CO, one could use interstellar dust as a tracer of the molecular component in spiral galaxies, since it is linked mechanically to the molecular phase (Allen et al., 1986; Weingartner & Draine, 2001), by mutual shielding from photo-dissociation, and the formation of molecular hydrogen on the surface of dustgrains (e.g., Cazaux & Tielens, 2004). Interstellar dust can be traced by its emission or its extinction of starlight.
Surface densities of dust in spirals have been obtained from spectral energy distribution models of multi-wavelength data (e.g., Popescu et al., 2000; Popescu & Tuffs, 2002; Draine et al., 2007; Boselli et al., 2010), from simple (modified) blackbody fits of far-infrared and sub-mm data (Bendo et al., 2008, 2010b; Gordon et al., 2008, 2010) or FUV/FIR ratios (Boissier et al., 2004, 2005, 2007; Muñoz-Mateos et al., 2011). The aim is to estimate the typical temperature, mass, composition and emissivity of the dust, and the implied gas-to-dust ratio (Boissier et al., 2004; Boselli et al., 2010; Muñoz-Mateos et al., 2009b, a; Pohlen et al., 2010; Smith et al., 2010; Roman-Duval et al., 2010; Magrini11b; Galliano et al., 2011; Foyle et al., 2012; Galametz et al., 2012).
The most recent Herschel results include a resolved temperature gradient in the disks of spirals (Bendo et al., 2010b; Smith et al., 2010; Engelbracht et al., 2010; Pohlen et al., 2010; Foyle et al., 2012), linked to increased illumination of the grains, notably in the spiral arms (Bendo et al., 2010b) and bulge (Engelbracht et al., 2010). With sufficient spatial sampling, one can extract the ISM power spectrum but this is only possible with Herschel for local group galaxies (Combes et al., 2012). Based on Herschel data of the Virgo cluster, (Smith et al., 2010), Cortese et al. (2010) and Magrini11b show the spatial coincidence and efficiency of stripping the dust together with the H i from the disks of spirals in a cluster environment.
In the comparison between the Herschel cold grain emission, and H i and CO observations, the mass-opacity coefficient of dust grains appears to be too low in M33 (the inner disk, Braine et al., 2010), and M99 and M100 (Eales et al., 2010). This is either because (1) its value is not well understood, (2) the conversion factor between CO and molecular hydrogen, , is different in M99 and M100, or (3) the emissivity () is different at sub-mm wavelengths. Roman-Duval et al. (2010) compare CO, H i and dust in the Large Magellanic Cloud (LMC), and argue that the cause of the discrepancy cannot be a different emissivity, nor a different gas-to-dust ratio, but that CO clouds have envelopes, hence changes with different density environments (an explanation also favored by Wolfire et al., 2010). Other recent results seem to back variations in ; Leroy et al. (2011) find a link between and metallicity based on SED models of a few local group galaxies and the HERACLES CO survey. A solid result from the first Herschel observations is that the gas-to-dust ratio increases with galactocentric radius (Pohlen et al., 2010; Smith et al., 2010) as do (Muñoz-Mateos et al., 2009a; Bendo et al., 2010a, based on Spitzer data alone). Magrini11b find a much lower than Galactic CO-to- conversion factor based on the relation between metallicity and gas-to-dust ratio radial profiles of several Virgo cluster spirals.
Even with the excellent wavelength coverage of Herschel, the SED fit results remain degenerate between dust mass, temperature and emissivity (see the reviews in Calzetti, 2001; Draine, 2003). It is still especially difficult to distinguish between a mass of very cold (poorly illuminated) dust from dust with much different emissivity characteristics (the emissivity efficiency depends on wavelength as in the sub-mm regime with , which may be typical for very large grains).
While large masses of extremely cold dust can be ruled out with increasing confidence, the level of illumination of the grains by the interstellar radiation field remains a fully free parameter in the SED models. The main uncertainty is complex relative geometry between the dusty filamentary structures and the illuminating stars. Both the grain emissivity and dust/star geometry can be expected to change significantly throughout the disk, i.e., with galactocentric radius or in a spiral arm.
Alternatively to models of dust emission, one can use the absorption of stellar light to trace dust densities. The advantages are higher spatial resolution of optical wavelengths and an independence of dust temperature. However, one needs a known background source of stellar light to measure the transparency of a spiral disk111We used the term “opacity” throughout our project and its publications for historical reasons.. Two observational techniques have been developed to measure the opacity of spirals and consequently their dust content. The first one uses occulting galaxy pairs (Andredakis & van der Kruit, 1992; Berlind et al., 1997; Domingue et al., 1999; White et al., 2000; Domingue et al., 2000; Keel & White, 2001a, b; Elmegreen et al., 2001; Holwerda et al., 2007b, 2009; Keel et al., 2012, submitted, Holwerda et al. submitted.), of which an increasing number are now known thanks to the Sloan Digital Sky Survey and the GalaxyZOO citizen science project (Lintott et al., 2008).
The second method uses the number of distant galaxies seen through the disk of a nearby face-on spiral, preferably in Hubble Space Telescope (HST) images. The latter technique is the focus of our “Opacity of Spiral Galaxies” series of papers (González et al., 1998, 2003; Holwerda et al., 2005a, b, c, d, e, 2007a).222Other authors have used distant galaxy counts or colours to estimate extinction in the Magellanic Clouds (Shapley, 1951; Wesselink, 1961; Hodge, 1974; Hodge & Snow, 1975; MacGillivray, 1975; Gurwell & Hodge, 1990; Dutra et al., 2001) and other galaxies (Zaritsky, 1994; Cuillandre et al., 2001). The benefit of using distant galaxies as the background light source is their ubiquity in HST images of nearby galaxies. Now that uniform H i maps are available from the THINGS project (The H i Nearby Galaxy Survey, Walter et al., 2008), as well as public Herschel data from the KINGFISH (Key Insights on Nearby Galaxies: a Far-Infrared Survey with Herschel, Skibba11; Dale et al., 2012; Kennicutt et al., 2011; Galametz et al., 2012), and CO(J=2-1) maps from the HERACLES survey (The HERA CO Line Extragalactic Survey, Leroy et al., 2009) for a sub-sample of the galaxies analysed in our “Opacity of Spiral Galaxies” project, we are taking the opportunity to compare our disk opacities to H i and surface densities to see how they relate.
Our method of determining dust surface densities is certainly not without its own uncertainties (notably cosmic variance, see §3) but these are not the ones of sub-mm emission suffers from (grain emissivity, level of stellar illumination, variance within the disk or these). Hence, our motivation for our comparison between the disk opacity and the other tracers of the cold ISM is to serve as an independent check to the new Herschel results.
In section 2, we discuss the origin of our sample and data. Section 3 explains how we derive a disk opacity from the number of distant galaxies. In section 4, we discuss the distant galaxy number as a function of H i column density and in section 5, we compare the H i and column densities, dust extinction, averaged over whole WFPC2 fields, and per H i contour, respectively. Sections 6 and 7 contain our discussion and conclusions.
2 Galaxy Sample and Data
Our present sample is the overlap between the Holwerda et al. (2005b), the THINGS (Walter et al., 2008), and the HERACLES (Leroy et al., 2009) projects. The common 10 disk galaxies are listed in Table 1. We use the public THINGS data and early science release data from HERACLES.
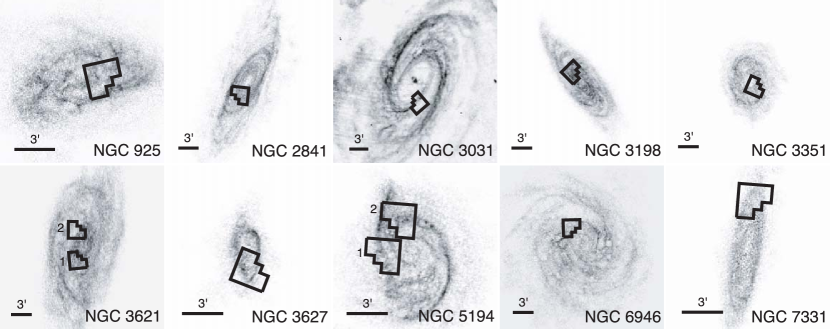
Figure 1 shows the HST/WFPC2 “footprints” overlaid on the VLA HI maps. In the case of NGC 3621 and NGC 5194, there are two HST/WFPC2 fields available for each galaxy.
2.1 VLA 21-cm Line Observations
For this study we use the THINGS (The H i Nearby Galaxy Survey, Walter et al., 2008) robustly-weighted (RO) integrated total H i intensity maps (available from http://www.mpia-hd.mpg.de/THINGS/). The maps were obtained with the VLA, and converted to H i surface density using the prescription from Walter et al. (2008), equations 1 and 5, and Table 3. Although the naturally-weighted maps are markedly more sensitive to the largest scale H i distribution, the robust maps have the highest angular resolution.
The robust maps are better suited for a direct comparison with the number of background galaxies, as we are interested in the H i column density at the position of each background galaxy and hence at scales smaller than the FOV of the HST/WFPC2 FOV (3 CCDs of ). Additionally, we use the WFPC2 footprint as an aperture on the H i maps (Figure 1).333In this case it does not matter whether the maps are robustly weighted or naturally weighted. The H i column densities averaged over the WFPC2 footprints (an angular scale of ) on the sample galaxies, and expressed in units of are listed in Table 1. These mean column densities include a correction factor (1.36) for Helium contribution to the atomic gas phase.
| Galaxy | Dist. | log(OH) | + 12 | |||||||||||||
| (H i) | (CO) | |||||||||||||||
| (Mpc) | (kpc) | ( | (kpc) | (K | ( | (kpc) | (mag.) | ( | (kpc) | KK04 | PT05 | |||||
| ) | km/s) | ) | ) | |||||||||||||
| (1) | (2) | (3) | (4) | (5) | (6) | (7) | (8) | (9) | (10) | (11) | (12) | (13) | (14) | (15) | (16) | (17) |
| NGC925 | 11.20 | 5.61 | 0.50 | 17.92 | 0.33 | 0.23 | 1.83 | 0.60 | -0.44 | 4.22 | 8.20 | 8.70 | -3.49 | -3.50 | -3.54 | |
| NGC2841 | 14.10 | 4.07 | 0.61 | 8.98 | 0.41 | 1.00 | 7.85 | 0.75 | 0.88 | 5.32 | 8.40 | 9.20 | -3.17 | -3.27 | -3.39 | |
| NGC3031 | 3.60 | 13.46 | 0.25 | 4.47 | 0.10 | … | … | 0.19 | 0.88 | 1.36 | 8.50 | 9.10 | -4.05 | -4.16 | -4.22 | |
| NGC3198 | 13.80 | 4.26 | 0.62 | 18.15 | 0.40 | 0.31 | 2.43 | 0.74 | 0.88 | 5.20 | 8.30 | 8.80 | -3.60 | -3.63 | -3.69 | |
| NGC3351 | 10.00 | 3.71 | 0.51 | 3.52 | 0.29 | 1.04 | 8.19 | 0.53 | 1.32 | 3.77 | 8.60 | 9.20 | -3.05 | -3.18 | -3.33 | |
| NGC3621-1 | 6.64 | 6.15 | 0.37 | 18.80 | 0.19 | … | … | 0.35 | 2.42 | 2.50 | 8.30 | 8.90 | -3.25 | -3.34 | -3.41 | |
| NGC3621-2 | 6.64 | 6.15 | 0.38 | 12.72 | 0.19 | … | … | 0.35 | 1.10 | 2.50 | 8.30 | 8.90 | -3.25 | -3.54 | -3.63 | |
| NGC3627 | 10.05 | 4.56 | 0.52 | 9.15 | 0.29 | 3.93 | 30.98 | 0.54 | 2.31 | 3.79 | … | … | -2.67 | -2.86 | -3.01 | |
| NGC5194-1 | 8.40 | 5.61 | 0.62 | 8.97 | 0.24 | 3.38 | 26.66 | 0.45 | -0.44 | 3.17 | 8.50 | 9.10 | -2.88 | -3.05 | -3.21 | |
| NGC5194-2 | 8.41 | 5.61 | 0.63 | 10.11 | 0.24 | 4.47 | 35.26 | 0.45 | 1.54 | 3.17 | 8.50 | 9.10 | -2.84 | -3.01 | -3.14 | |
| NGC6946 | 11.48 | 5.74 | 0.75 | 9.44 | 0.33 | 2.12 | 16.69 | 0.61 | 1.21 | 4.33 | 8.30 | 8.90 | -3.28 | -3.44 | -3.60 | |
| NGC7331 | 14.72 | 5.24 | 0.76 | 21.53 | 0.43 | 0.26 | 2.06 | 0.78 | 0.33 | 5.55 | 8.30 | 8.80 | -3.57 | -3.61 | -3.69 |
2.2 CO(J = 2 1) Line Observations
The HERACLES project (The HERA CO Line Extragalactic Survey, Leroy et al., 2009; Walter et al., 2009) is a project on the IRAM 30m telescope to map the molecular gas over the entire optical disks () of 40 nearby galaxies via the CO(J=2-1) emission line. The HERA instrument has comparable spatial (11”) and velocity (2.6 km/s) resolutions to the THINGS survey, and good sensitivity () as well. The HERACLES sample overlaps by design with the THINGS and SINGS (Spitzer Infrared Nearby Galaxy Survey, Kennicutt et al., 2003) samples and it also has 8 galaxies in common with our previous work (Table 1).
To convert the CO (J=2-1) maps to molecular hydrogen surface density maps, we need the conversion factor (alternatively denoted as ). For the CO (J=1-0) line, this is commonly assumed to be 4.4. The ratio between the CO(J=1-0) and CO(J=2-1) line is 0.7 according to the HERACLES observations. To convert the CO(J=2-1) map (in K km/s) into molecular surface density, (Leroy et al., 2008). The mean values of the CO(J=2-1) surface brightness and the molecular hydrogen surface density are listed in Table 1.
2.3 HST/WFPC2 Images
The background galaxy counts are based on HST/WFPC2 data, as presented in Holwerda (2005a) and Holwerda et al. (2005b). The footprints of the 12 HST/WFPC2 fields on the integrated H i maps of 10 THINGS galaxies are shown in Figure 1 and we only consider these areas of the disks. The HST fields are predominantly from the Distance Scale Key Project (Freedman et al., 2001), and are therefore usually aimed at spiral arms in the outer parts of the main disks, in order to facilitate the identification of Cepheids. The final drizzled WFPC2 images in and , from Holwerda (2005a), can be obtained at http://archive.stsci.edu/prepds/sgal/ and the NASA Extragalactic Database.444Similar quality products are now also available from the archives at STSCI, the High-Level Archive; www.hla.stsci.edu.
3 Disk Opacity from the Number of Background Galaxies.
The central premise of our method to measure disk opacity, is that the reduction in the number of distant galaxies seen though a foreground spiral galaxy is a reasonable indication of the transparency of the disk. The number of distant galaxies that can be identified is a function of several factors: the real number of galaxies behind the disk; the crowding by objects in the foreground disk and consequently the confusion in the identification of the distant galaxies, and, finally, absorption of the light from the background galaxies by the interstellar dust in the foreground disk. Since we are only interested in the last one –the dust extinction–, all the other factors need to be mitigated and accounted for. HST provides the superb resolution to identify many distant galaxies, even in the quite crowded fields of nearby spiral galaxies. But to fully calibrate for crowding and confusion, we developed the “Synthetic Field Method” (SFM), in essence a series of artificial galaxy counts under the same conditions as the science field (González et al., 1998; Holwerda et al., 2005a).
If we identify galaxies in a field, we need to know two quantities to convert this number into a disk opacity measurement: (1) the number () of galaxies we would have identified in this field, without any dust extinction but under the same crowding and confusion conditions, and (2) the dependence () of the number of galaxies on any increase of dust extinction. The disk’s opacity in is then expressed as:
| (1) |
If the number of identified galaxies behaved exactly as photons, the parameter would be unity. We have found it to be close to 1.2 for a typical field, and to depend the surface brightness and granularity of the foreground disk (González et al., 2003; Holwerda et al., 2005d). From our artificial distant galaxy counts in the WFPC2 fields, we can obtain both and ; the first from an artificial count of seeded, undimmed, distant galaxies, and the second from a series of artificial distant galaxy counts with progressive dimming of the seeded galaxies.
Since we cannot know the intrinsic number of distant galaxies behind the foreground disk, we treat the cosmic variance as a source of uncertainty in that can be estimated from the observed 2-point correlation function. This typically is of the same order as the Poisson error in the opacity measurement.555It depends to a degree on the depth of the data. Conservatively, for this kind of fields, the total error is about 3.5 times Poisson (González et al., 2003). Because the cosmic variance uncertainty is substantial, improvements in the identification of distant galaxies barely improve our errors (see also Holwerda, 2005b).
To test the general SFM results, we have done several checks against other techniques. The results are consistent with those obtained from occulting galaxy pairs (Holwerda et al., 2005b), both the results in White et al. (2000); Domingue et al. (2000) as well as the later opacities found in Holwerda et al. (2007b). The SFM results are also consistent with the amount of dust reddening observed for the Cepheids in these fields (the majority of which is from the Cepheid Distance Scale Key Project Freedman et al., 2001), the dust surface densities inferred from the far-infrared SED (Holwerda et al., 2007a, discussed below), and the sub-mm fluxes from KINGFISH observations (§3.2, below). Even with HST, the number of identifiable galaxies in a given WFPC2 field is relatively small, a fact that results in large uncertainties if the field is further segmented for its analysis, e.g., sub-divided into arm and inter-arm regions. To combat the large uncertainties, we combined the numbers of background galaxies found in different fields, based on certain characteristics of the foreground disks, like galactocentric radius, location in the arm or inter-arm regions (Holwerda et al., 2005b), surface brightness (Holwerda et al., 2005e), or NIR colour (Holwerda et al., 2007c). Because no uniform H i and CO maps were available until now, we compared radial H i profiles to our radial opacity profile in Holwerda et al. (2005c), but this is far from ideal. Now that the THINGS and HERACLES maps are available, we can compare the average opacity of an HST field to its mean H i and surface densities or, alternatively, rank the distant galaxies based on the foreground disk’s H i column density at their position.
3.1 Dust Surface Densities
To convert the above opacity of the spiral disk to a dust surface density, we assume a smooth surface density distribution of the dust (no clumps or fine structure). The dust surface density is then:
| (2) |
with for Johnson from Draine (2003), Table 4; cm2 g-1. The mean opacity () and implied mean dust surface densities are listed in Table 1. The value for changes with the types of grain (and hence with environment in the disk) and the Draine et al. is a value typical for large grains. Variance in is not unusual depending on the prevailing composition of the dust.
The screen approximation to estimate the surface density is common but in fact the dusty ISM is clumped and filamentary in nature with a wide range of densities and temperatures. Typically, the distant galaxies are seen in gaps between the dusty clouds (Holwerda et al., 2007c). The typical value of (Figure 5) corresponds to a surface covering factor of 60%, if the clouds were completely opaque. In reality, the disk opacity is a mix of covering factor and the mean extinction of the clouds (on average and cloud size 60 pc, Holwerda et al., 2007a). We note that our mass estimates agree with those from a fit to the Spitzer fluxes with the Li & Draine (2001) model (to within a factor of two Holwerda et al., 2007a, Figure 3). Draine et al. (2007) note that the addition of sub-mm information to such a fit may modify the dust mass estimate by a factor of 1.5 or less. Thus, while there is certainly a range of dust densities in each field, we are confident that the estimate from the above expression is a reasonable mean surface density.
3.2 Herschel-SPIRE Surface Brightness
Sub-mm data for all our galaxies are available at the Herschel Science Archive666http://herschel.esac.esa.int/Science_Archive.shtml, the majority taken for the KINGFISH project777Key Insights on Nearby Galaxies: a Far-Infrared Survey with Herschel, PI. R. Kennicutt, (see also Skibba et al., 2011; Dale et al., 2012; Kennicutt et al., 2011; Galametz et al., 2012). We therefore check the reliability of the SFM as a tracer of the dust surface density by directly comparing the surface brightness measured by the Spectral and Photometric Imaging REceiver (SPIRE, Griffin et al., 2010), onboard Herschel to the opacity as measured by the SFM.
We used the WFPC2 field-of-view as the aperture to measure the fluxes at 250, 350, and 500 m (listed in Table 1), similar to our measurements of the surface density in the H i and CO data (§4 and 2.2). These were not aperture corrected because of the unique shape of the aperture. Figure 2 shows the Herschel surface brightnesses versus the SFM opacities for all three wavebands (the 250 and 500 m. values are the end points of the horizontal bars). To convert the flux in a Herschel-SPIRE waveband into a dust surface density, one would need both a typical dust temperature or a temperature distribution and the dust’s emissivity. The horizontal bars indicate there is a range of mean temperatures in these disks.
There is a linear relation between the Herschel-SPIRE surface brightnesses and the SFM opacities. The scatter is much less for this relation than between the SFM dust surface density values and those inferred from far-infrared SED models (Holwerda et al., 2007a, Figure 3). Hence, we conclude that the SFM opacities are a reasonable indicator for mean dust surface density.
As a qualitative check, we compare the dust surface densities derived for a subset of the KINGFISH sample by Galametz et al. (2012), their Figure A1, to those derived above. Typical values mid-disk for the overlap (NGC 3351, NGC 3521 and NGC 3627), where the WFPC2 images are located, are , which appear to be typical (i.e., similar to those in Foyle et al., 2012). These values lie a factor two below the ones implied by the SFM (Table 1), regardless of the dust emissivity used in the Galametz et al. (2012) fits but the difference is greater for fits where the emissivity is a free parameter. We found similar dust surface densities from the SED model in Holwerda et al. (2007a), based on the Spitzer fluxes alone (Figure 3). Because all these models are based on the Draine et al. (2007) model, we made a second check using the magphys SED model (magphys). These dust surface density are to a factor ten below the SFM or Draine et al. estimates. These fits illustrate the importance of the choice of model compared to the inclusion of sub-mm data.


4 H i Column Density and the Number of Distant Galaxies
To improve statistics, one our tactics has been to stack the numbers of galaxies in our fields according to a local characteristic (surface brightness, galactocentric radius etc.). Here we combine the number of background galaxies, both real and artificial, based on the H i column density at their respective positions. If there is a relation between disk opacity and H i column density resolved in the THINGS RO maps, it should show as a preference of the real distant galaxies for a specific H i column density, for example for lower values of . The artificial galaxies would not prefer any H i column density value in particular.

The top panel in Figure 4 shows the distribution histogram of real (hatched) and artificial (solid) galaxies observed, as a function of foreground galaxy H i column density. The bottom panel converts the ratio of real and artificial galaxies found at an H i column density into an opacity, using equation 1 with C equal to 1.2. The real distant galaxies identified in the HST images do not show a clear preference for a certain H i column density. Their distribution is very similar to that of the artificial distant background galaxies. As a result, the inferred opacity is constant with H i column density. In our opinion, this lack of a relation can either be: (1) real, pointing to a break-down in the spatial relation between H i and dust on scales of 6′′ (corresponding to kpc in our galaxies); or (2) an artifact of stacking results from different fields at various galactocentric radii in different foreground galaxies at diverse distances. We note, however, that the deviation from the Bohlin et al. (1978) relation between column density and extinction (dashed line in bottom panel) is strongest for the lowest H i column densities, where our statistics are the most robust. In our opinion, this points to that one needs to compare to the total hydrogen column density, including the molecular component888Our fields are usually centered on a spiral arm (to observe Cepheids) and this increases the contribution from molecular phase..


5 Average Column Densities and Opacity per WFPC2 field
Our second approach is to compare H i and column densities to disk opacity averaged over each WFPC2 field. Table 1 lists the average opacity value for each HST/WFPC2 field, and the H i and column densities averaged over the WFPC2 field-of-view (the footprints in Figure 1). The beams of the H i and observations are much smaller than the WFPC2 apertures and we expect any aperture correction to the surface densities to be small (Table 1)999We chose not to correct the surface densities because of the odd shape of the aperture. Depending on how one treats the edges of the aperture, the average surface density varies with 10%.. Figure 5, left, plots the opacity versus H i surface density; there is no clear relation between the two, when averaged over the size of a WFPC2 field. There are two negative values in our present sample [and the entire Holwerda (2005a) sample], that are probably due to cosmic variance in the number of background galaxies (a background cluster). The opacity values and H i surface densities span a reasonable range for spiral galaxies. Cuillandre et al. (2001) similarly find little relation between reddening and number of distant galaxies, on one side, and H i column density, on the other. Figure 5, middle panel, shows the relation between disk opacity and mean surface density of , inferred from the CO observations. There are fewer useful points, as there are no CO data for three of our WFPC2 fields, and two of the WFPC2 fields show the aforementioned negative opacity. There could be a relation between CO inferred molecular surface density and opacity. Figure 5, right panel, shows the relation between disk opacity and mean surface density of total gas (H i+). For those galaxies where no CO information as available, we use the H i mean surface density (open diamonds). For comparison, we show the canonical Galactic relation from Bohlin et al. Opacity appears mostly independent from total gas surface density but with the majority of our points lie above the Bohlin et al. relation. There is surprisingly little of a relation between the gas, total, molecular or atomic, and disk opacity. In part this may be due in part to the different dust clumpiness in each disk, which is observed at a different distance. Alternatively, the metallicity and implicitly the average galactocentric radius of each field is the missing factor in the gas-dust relation in these fields.

One explanation for the lack of a relation in Figure 5 is that the measurements were taken at various galactocentric radii (and hence metallicity) in each disk. Figure 6 plots the ratio between the dust surface density (to facilitate direct comparison) and the two phases of the hydrogen,atomic and molecular in , as a function of radius, scaled to the 25 mag/arcsec2 B-band isophotal radius () from de Vaucouleurs et al. (1991). The relation with atomic phase is consistent with a constant fraction of with two exceptions at ; NGC 3351 and NGC 3627. Both of these are small H i disks, of which the WFPC2 field covers a large fraction (see Figure 1), both with prominent spiral arms. NGC 3627 is a member of the Leo triplet and as such may also be a victim of atomic gas stripping or a tidally induced strong spiral pattern. The top panel in 6 shows the ratio between dust and molecular surface density, consistent with a constant fraction of with one exception; NGC 3198, which is a very flocculant spiral, which a much lower H i surface density. There is little relation between the dust-to-atomic or dust-to-molecular ratio and radius. Exceptions seem to be either strong spiral arm structure, in the case of H i, or very flocculant, in the case of .

By combining the surface densities of H i and into a single hydrogen surface density (), we can now directly compare the total dust-to-gas surface density ratio. In the cases, where no CO observations are available (NGC 3031 and NGC 3621), we use the ratio with H i only. Figure 7 shows the dust-to-total-gas ratio as a function of radius. The anomalous ratios of NGC 3351, NGC 3627 and NGC 3198 in Figure 6 now fall into line.
If we take the points without CO information (open diamond symbols) at face value (assume no molecular gas), Figure 7 suggests an exponential decline of dust-to-total gas; . A decline of the dust-to-total-gas ratio would be consistent with the relation with metallicity shown in Leroy et al. (2011); Sandstrom et al. (2011), and with the trends with radius in the recent Spitzer (e.g., Muñoz-Mateos et al., 2009a; Bendo et al., 2010a) and Herschel results (Pohlen et al., 2010; Smith et al., 2010).
However, if we exclude those points without CO information (open diamond symbols) and those with negative SFM measurements (open circles), Figure 7 is in agreement with a constant gas-to-dust ratio of (weighted mean). One can reasonably expect a much more substantial contribution by the molecular component in the inner disk, which would bring the three points without CO information into line with this constant fraction. This dust-to-total-gas fraction is approximately a factor two above the typical value in the literature (0.01-0.03, Smith et al., 2010; Leroy et al., 2011) or the one from Bohlin et al. (1978). The fact that the ratio between dust and total gas surface density is nearly constant points to dust in both the diffuse H i disk as well as in the denser molecular clouds.
6 Discussion
When compared to either phase of hydrogen in these disks, atomic or molecular, the dust density implied by the disk opacity mostly point to a constant ratio. Exceptions seem to point to a change in gas phase due to the strength of spiral arms in the WFPC2 field-of-view; a strong spiral density wave moves gas into the molecular phase and a flocculant structure into the atomic one. A scenario consistent with the density wave origin of spiral structure. In our opinion it illustrates the need for a constraint on both gas phases for a comparison with dust surface density.
Our dust-to-total-gas ratio of 0.043 (Figure 7) is higher than the values found, for example, in the Local Group spiral galaxies (the Milky Way, M31, and M33 in the case of Leroy et al., 2011), or in a single Virgo spiral galaxy with Herschel (NGC 4501, Smith et al., 2010) or the values found by Magrini11b. These studies find the values closest to ours in the outskirts of the respective galaxy disks.
There are several explanations for the high dust-to-gas ratio in our measurements:
(1) we overestimated the dust surface density,
(2) a substantial aperture correction of the CO and H i surface densities is needed,
(3) for large portions of the disk, a different CO-to- conversion factor () is appropriate, and
(4) a different absorption factor () for a disk average is appropriate.
First, we are confident that our dust surface densities are unbiased and reasonably accurate because we checked them agains several other observational techniques (Cepheid reddening, occulting galaxy results, Spitzer FIR SED fits).
Our main assumption is that the dust is in a screen, which is a very rough approximation, especially
when the probe used is the number of distant objects (i.e, the opacity is also a function of cloud cover Holwerda et al., 2007c).
However, our comparison between dust surface densities from an SED fit and the number count of distant galaxies showed good agreement (Holwerda et al., 2007a) (Figure 3) to within a factor two.
We note that these SED fits were done without sub-mm information but Draine et al. (2007) point out that dust masses can vary with a factor less than 1.5 if the SED of the large grains is done with or without sub-mm information (their Figure 12). The dust surface densities are therefore not likely to be overestimated by more than a factor two. Our comparison with sub-mm fluxes (Figure 2, §3.2) seems to confirm this.
The SFM estimate of the dust surface density may well be the upper limit of dust in these disks.
Secondly, no aperture correction was applied to the CO and H i surface densities. Because the aperture we use to measure the CO and H i fluxes is the odd shape of the WFPC2 camera’s field-of-view (Figure 1), an aperture correction is not straightforward. Yet, we estimate that the aperture correction cannot change the reported average surface brightnesses sufficiently, as the resolution of the observations is substantially smaller than the WFPC2 aperture (Table 1).
Thirdly, when averaged over a large portion of the disk, which spans a range in density environments, the CO conversion factor () may well underestimate the total molecular hydrogen surface density, since some molecular clouds the observed CO may be from the “skin” of the GMC and there is not straightforward conversion from CO to volume (Wolfire et al., 2010; Glover & Mac Low, 2011; Planck Collaboration et al., 2011; Shetty et al., 2011; Madden et al., 2011; Feldmann et al., 2011a; Feldmann12b; Mac Low & Glover, 2012).
A fourth option is that the dust absorption factor () is different when averaged over different environments and therefore dust grain properties (e.g., Narayanan et al., 2011, 2012), although this is likely a secondary effect.
If all our dust surface densities would are all over-estimated by a factor 2, or the aperture correction increased the gas surface densities substantially, one may not need to change the factor to bring our dust-to-gas ratio in line with recent results from Herschel. We suspect, however, that the explanation includes a different , when averaged of a large section of the spiral disk and at different galactocentric radii, extending the range in values found in Local Group spiral galaxies by Leroy et al. (2011).

6.1 Comparison to Metallicities
The present consensus is that the dust-to-total-gas ratio depends linearly on the metallicity (see for instance Leroy et al., 2011). Fortunately, uniformly determined metallicity gradients for the SINGS101010Spitzer Infrared Nearby Galaxy Survey (Kennicutt et al., 2003)., and hence THINGS and HERACLES, galaxies are presented in Moustakas et al. (2010). Only NGC 3627 does not have metallicity information. Starting from their linear relation for the radial dependence of metallicity in each galaxy (their Figure 7), we can obtain an estimate of the metallicity for each of our WFPC2 fields. They present two different estimates of metallicity (), with either the theoretical calibration from Kobulnicky & Kewley (2004) or the empirical one from Pilyugin & Thuan (2005) (see Table 1). Moustakas et al. (2010) note that, until the calibration issues are resolved, one should either average the metallicity estimates based on either calibration or use both separately. We will use both calibrations separately for comparison and the total-gas-to-dust ratio to facilitate a direct comparison to Figure 6 in Leroy et al. (2011). We note that since our WFPC2 fields were placed with crowding issues in mind, our coverage of galactocentric radii (and hence metallicities) is not very large.
Figure 8 shows the logarithm of the total-gas-to-dust ratio as a function of metallicity, using either of the two calibrations. Our points lie lower than the linear relation from Leroy et al. (2011) for the gas-to-dust ratio with metallicity, not unexpectedly as we already established that our dust-to-gas values are higher than those previously reported.
7 Conclusions
To conclude our “Opacity of spiral disks” project, we have compared the opacity of spiral galaxies, and the hence dust surface density to the surface densities of hydrogen, both atomic and molecular, the original goal of our project. We conclude from this comparison:
-
1.
The disk opacity scales with the Herschel-SPIRE 250 m surface brightness (Figure 2), confirming our assertion that opacity scales with dust surface density to first order.
-
2.
There is little relation between the H i column density and where a distant galaxy was identified in these fields (Figure 4).
-
3.
Averaged over a WFPC2 field, there is only a weak link between disk opacity (or dust surface density) and gas surface density, either atomic, molecular or total (Figure 5), pointing to third factor; radius or metallicity.
-
4.
The dust-to-H i or dust-to- relations with galactocentric radius are both relatively constant (Figure 6), but the exceptions point to the role of spiral structure in the dominant gas phase of the ISM.
-
5.
The dust-to-total-gas ratio is close to constant for all our fields (Figure 7). This higher value can, in our opinion, be attributed to a different conversion to dust surface density or the CO-to- conversion factor () for such large sections of disks.
- 6.
Future use of the number of distant galaxies identified through a foreground spiral disk as a probe of dust is critically limited by cosmic variance (González et al., 2003; Holwerda et al., 2005d) but its optimal application will be on a single large HST mosaic of a nearby face-on spiral (e.g., M81 or M101), which will most likely the last contribution of this unique approach to the issue of the dust content of spiral disks.
Acknowledgements
We acknowledge the THINGS collaboration for the publication of their H i surface density maps, based on their Very Large Array radio observations and would like to thank the HERACLES collaboration for making their surface density maps available early. The authors would like to thank F. Walther and S-L. Blyth for useful discussions and feedback. We thank the anonymous referee for his or her excellent report and extraordinary effort.
We acknowledge support from HST Archive grants AR-10662 and AR-10663 and from the National Research Foundation of South Africa. The work of W.J.G. de Blok is based upon research supported by the South African Research Chairs Initiative of the Department of Science and Technology and the National Research Foundation. Antoine Bouchard acknowledges the financial support from the South African Square Kilometre Array Project. R. A. González-Lópezlira acknowledges support from DGAPA (UNAM) grant IN118110.
The National Radio Astronomy Observatory is a facility of the National Science Foundation operated under cooperative agreement by Associated Universities, Inc. Based on observations made with the NASA/ESA Hubble Space Telescope, which is a collaboration between the Space Telescope Science Institute (STScI/ NASA), the Space Telescope European Coordinating Facility (ST-ECF/ ESA), and the Canadian Astronomy Data Centre (CADC/NRC/CSA). The Hubble data presented in this paper were obtained from the Multimission Archive at the Space Telescope Science Institute (MAST). STScI is operated by the Association of Universities for Research in Astronomy, Inc., under NASA contract NAS5-26555. Support for MAST for non-HST data is provided by the NASA Office of Space Science via grant NAG5-7584, and by other grants and contracts.
This research has made use of the NASA/IPAC Extragalactic Database (NED) which is operated by the Jet Propulsion Laboratory, California Institute of Technology, under contract with the National Aeronautics and Space Administration. This research has made use of NASA’s Astrophysics Data System.
References
- Allen et al. (1986) Allen, R. J., Atherton, P. D., & Tilanus, R. P. J. 1986, Nature, 319, 296
- Allen et al. (2004) Allen, R. J., Heaton, H. I., & Kaufman, M. J. 2004, ApJ, 608, 314
- Allen et al. (1997) Allen, R. J., Knapen, J. H., Bohlin, R., & Stecher, T. P. 1997, ApJ, 487, 171
- Andredakis & van der Kruit (1992) Andredakis, Y. C. & van der Kruit, P. C. 1992, A&A, 265, 396
- Bell et al. (2003) Bell, E. F., Baugh, C. M., Cole, S., Frenk, C. S., & Lacey, C. G. 2003, MNRAS, 343, 367
- Bendo et al. (2008) Bendo, G. J., Draine, B. T., Engelbracht, C. W., et al. 2008, MNRAS, 389, 629
- Bendo et al. (2010a) Bendo, G. J., Wilson, C. D., Pohlen, M., et al. 2010a, A&A, 518, L65+
- Bendo et al. (2010b) Bendo, G. J., Wilson, C. D., Warren, B. E., et al. 2010b, MNRAS, 402, 1409
- Berlind et al. (1997) Berlind, A. A., Quillen, A. C., Pogge, R. W., & Sellgren, K. 1997, AJ, 114, 107
- Bigiel et al. (2008) Bigiel, F., Leroy, A., Walter, F., et al. 2008, AJ, 136, 2846
- Bohlin et al. (1978) Bohlin, R. C., Savage, B. D., & Drake, J. F. 1978, ApJ, 224, 132
- Boissier et al. (2004) Boissier, S., Boselli, A., Buat, V., Donas, J., & Milliard, B. 2004, A&A, 424, 465
- Boissier et al. (2007) Boissier, S., Gil de Paz, A., Boselli, A., et al. 2007, ApJS, 173, 524
- Boissier et al. (2005) Boissier, S., Gil de Paz, A., Madore, B. F., et al. 2005, ApJ, 619, L83
- Boselli et al. (2010) Boselli, A., Eales, S., Cortese, L., et al. 2010, PASP, 122, 261
- Braine et al. (2010) Braine, J., Gratier, P., Kramer, C., et al. 2010, A&A, 518, L69+
- Buat et al. (2002) Buat, V., Boselli, A., Gavazzi, G., & Bonfanti, C. 2002, A&A, 383, 801
- Calzetti (2001) Calzetti, D. 2001, PASP, 113, 1449
- Calzetti et al. (2005) Calzetti, D., Kennicutt, R. C., Bianchi, L., et al. 2005, ApJ, 633, 871
- Catinella et al. (2010) Catinella, B., Schiminovich, D., Kauffmann, G., et al. 2010, MNRAS, 403, 683
- Cazaux & Tielens (2004) Cazaux, S. & Tielens, A. G. G. M. 2004, ApJ, 604, 222
- Combes et al. (2012) Combes, F., Boquien, M., Kramer, C., et al. 2012, A&A, 539, A67
- Cortese et al. (2006) Cortese, L., Boselli, A., Buat, V., et al. 2006, ApJ, 637, 242
- Cortese et al. (2010) Cortese, L., Davies, J. I., Pohlen, M., et al. 2010, A&A, 518, L49+
- Cuillandre et al. (2001) Cuillandre, J., Lequeux, J., Allen, R. J., Mellier, Y., & Bertin, E. 2001, ApJ, 554, 190
- da Cunha et al. (2008) da Cunha, E., Charlot, S., & Elbaz, D. 2008, MNRAS, 388, 1595
- Dale et al. (2012) Dale, D. A., Aniano, G., Engelbracht, C. W., et al. 2012, ApJ, 745, 95
- de Vaucouleurs et al. (1991) de Vaucouleurs, G., de Vaucouleurs, A., Corwin, H. G., et al. 1991, Third Reference Catalogue of Bright Galaxies (Volume 1-3, XII, 2069 pp. 7 figs.. Springer-Verlag Berlin Heidelberg New York)
- Domingue et al. (1999) Domingue, D. L., Keel, W. C., Ryder, S. D., & White, III, R. E. 1999, AJ, 118, 1542
- Domingue et al. (2000) Domingue, D. L., Keel, W. C., & White, III, R. E. 2000, ApJ, 545, 171
- Draine (2003) Draine, B. T. 2003, ARA&A, 41, 241
- Draine et al. (2007) Draine, B. T., Dale, D. A., Bendo, G., et al. 2007, ApJ, 663, 866
- Dutra et al. (2001) Dutra, C. M., Bica, E., Clariá, J. J., Piatti, A. E., & Ahumada, A. V. 2001, A&A, 371, 895
- Eales et al. (2010) Eales, S. A., Smith, M. W. L., Wilson, C. D., et al. 2010, A&A, 518, L62+
- Elmegreen et al. (2001) Elmegreen, D. M., Kaufman, M., Elmegreen, B. G., et al. 2001, AJ, 121, 182
- Engelbracht et al. (2010) Engelbracht, C. W., Hunt, L. K., Skibba, R. A., et al. 2010, A&A, 518, L56+
- Fabello et al. (2011) Fabello, S., Catinella, B., Giovanelli, R., et al. 2011, MNRAS, 411, 993
- Fall & Efstathiou (1980) Fall, S. M. & Efstathiou, G. 1980, MNRAS, 193, 189
- Feldmann et al. (2011a) Feldmann, R., Gnedin, N. Y., & Kravtsov, A. V. 2011a, ApJ, 732, 115
- Feldmann et al. (2011b) Feldmann, R., Gnedin, N. Y., & Kravtsov, A. V. 2011b, ArXiv e-prints
- Foyle et al. (2012) Foyle, K., Wilson, C. D., Mentuch, E., et al. 2012, ArXiv e-prints
- Freedman et al. (2001) Freedman, W. L., Madore, B. F., Gibson, B. K., et al. 2001, ApJ, 553, 47
- Galametz et al. (2012) Galametz, M., Kennicutt, R. C., Albrecht, M., et al. 2012, ArXiv e-prints
- Galliano et al. (2011) Galliano, F., Hony, S., Bernard, J. ., et al. 2011, ArXiv e-prints
- Glover & Mac Low (2011) Glover, S. C. O. & Mac Low, M. 2011, MNRAS, 412, 337
- González et al. (1998) González, R. A., Allen, R. J., Dirsch, B., et al. 1998, ApJ, 506, 152
- González et al. (2003) González, R. A., Loinard, L., Allen, R. J., & Muller, S. 2003, AJ, 125, 1182
- Gordon et al. (2008) Gordon, K. D., Engelbracht, C. W., Rieke, G. H., et al. 2008, ApJ, 682, 336
- Gordon et al. (2010) Gordon, K. D., Galliano, F., Hony, S., et al. 2010, A&A, 518, L89+
- Griffin et al. (2010) Griffin, M. J., Abergel, A., Abreu, A., et al. 2010, A&A, 518, L3+
- Gurwell & Hodge (1990) Gurwell, M. & Hodge, P. 1990, PASP, 102, 849
- Heiner et al. (2008a) Heiner, J. S., Allen, R. J., Emonts, B. H. C., & van der Kruit, P. C. 2008a, ApJ, 673, 798
- Heiner et al. (2009) Heiner, J. S., Allen, R. J., & van der Kruit, P. C. 2009, in The Evolving ISM in the Milky Way and Nearby Galaxies
- Heiner et al. (2010) Heiner, J. S., Allen, R. J., & van der Kruit, P. C. 2010, ApJ, 719, 1244
- Heiner et al. (2008b) Heiner, J. S., Allen, R. J., Wong, O. I., & van der Kruit, P. C. 2008b, A&A, 489, 533
- Hodge (1974) Hodge, P. W. 1974, ApJ, 192, 21
- Hodge & Snow (1975) Hodge, P. W. & Snow, T. P. 1975, AJ, 80, 9
- Holwerda (2005a) Holwerda, B. W. 2005a, PhD thesis, Proefschrift, Rijksuniversiteit Groningen, 2005
- Holwerda (2005b) Holwerda, B. W. 2005b, PhD thesis, Proefschrift, Rijksuniversiteit Groningen, 2005
- Holwerda et al. (2007a) Holwerda, B. W., Draine, B., Gordon, K. D., et al. 2007a, AJ, 134, 2226
- Holwerda et al. (2005a) Holwerda, B. W., González, R. A., Allen, R. J., & van der Kruit, P. C. 2005a, AJ, 129, 1381
- Holwerda et al. (2005b) Holwerda, B. W., González, R. A., Allen, R. J., & van der Kruit, P. C. 2005b, AJ, 129, 1396
- Holwerda et al. (2005c) Holwerda, B. W., González, R. A., Allen, R. J., & van der Kruit, P. C. 2005c, A&A, 444, 101
- Holwerda et al. (2005d) Holwerda, B. W., González, R. A., Allen, R. J., & van der Kruit, P. C. 2005d, A&A, 444, 319
- Holwerda et al. (2005e) Holwerda, B. W., González, R. A., van der Kruit, P. C., & Allen, R. J. 2005e, A&A, 444, 109
- Holwerda et al. (2007b) Holwerda, B. W., Keel, W. C., & Bolton, A. 2007b, AJ, 134, 2385
- Holwerda et al. (2009) Holwerda, B. W., Keel, W. C., Williams, B., Dalcanton, J. J., & de Jong, R. S. 2009, AJ, 137, 3000
- Holwerda et al. (2007c) Holwerda, B. W., Meyer, M., Regan, M., et al. 2007c, AJ, 134, 1655
- Israel (1997) Israel, F. P. 1997, A&A, 328, 471
- Kannappan (2004) Kannappan, S. J. 2004, ApJ, 611, L89
- Keel et al. (2012, submitted) Keel, W. C., Manning, A. M., Holwerda, B. W., et al. 2012, submitted, MNRAS
- Keel & White (2001a) Keel, W. C. & White, III, R. E. 2001a, AJ, 121, 1442
- Keel & White (2001b) Keel, W. C. & White, III, R. E. 2001b, AJ, 122, 1369
- Kennicutt et al. (2003) Kennicutt, R. C., Armus, L., Bendo, G., et al. 2003, PASP, 115, 928
- Kennicutt et al. (2011) Kennicutt, R. C., Calzetti, D., Aniano, G., et al. 2011, PASP, 123, 1347
- Kennicutt (1998) Kennicutt, Jr., R. C. 1998, ApJ, 498, 541
- Kennicutt et al. (2007) Kennicutt, Jr., R. C., Calzetti, D., Walter, F., et al. 2007, ApJ, 671, 333
- Kobulnicky & Kewley (2004) Kobulnicky, H. A. & Kewley, L. J. 2004, ApJ, 617, 240
- Leroy et al. (2007) Leroy, A., Bolatto, A., Stanimirovic, S., et al. 2007, ApJ, 658, 1027
- Leroy et al. (2011) Leroy, A. K., Bolatto, A., Gordon, K., et al. 2011, ArXiv e-prints/1102.4618
- Leroy et al. (2009) Leroy, A. K., Walter, F., Bigiel, F., et al. 2009, AJ, 137, 4670
- Leroy et al. (2008) Leroy, A. K., Walter, F., Brinks, E., et al. 2008, AJ, 136, 2782
- Li & Draine (2001) Li, A. & Draine, B. T. 2001, ApJ, 554, 778
- Lintott et al. (2008) Lintott, C. J., Schawinski, K., Slosar, A., et al. 2008, MNRAS, 389, 1179
- Mac Low & Glover (2012) Mac Low, M.-M. & Glover, S. C. O. 2012, ApJ, 746, 135
- MacGillivray (1975) MacGillivray, H. T. 1975, MNRAS, 170, 241
- Madden et al. (2011) Madden, S. C., Galametz, M., Cormier, D., et al. 2011, ArXiv e-prints
- Madden et al. (1997) Madden, S. C., Poglitsch, A., Geis, N., Stacey, G. J., & Townes, C. H. 1997, ApJ, 483, 200
- Magrini et al. (2011) Magrini, L., Bianchi, S., Corbelli, E., et al. 2011, ArXiv e-prints/1106.0618
- Moustakas et al. (2010) Moustakas, J., Kennicutt, Jr., R. C., Tremonti, C. A., et al. 2010, ApJS, 190, 233
- Muñoz-Mateos et al. (2011) Muñoz-Mateos, J. C., Boissier, S., Gil de Paz, A., et al. 2011, ApJ, 731, 10
- Muñoz-Mateos et al. (2009a) Muñoz-Mateos, J. C., Gil de Paz, A., Boissier, S., et al. 2009a, ApJ, 701, 1965
- Muñoz-Mateos et al. (2009b) Muñoz-Mateos, J. C., Gil de Paz, A., Zamorano, J., et al. 2009b, ApJ, 703, 1569
- Narayanan (2011) Narayanan, D. 2011, ArXiv e-prints
- Narayanan et al. (2011) Narayanan, D., Krumholz, M., Ostriker, E. C., & Hernquist, L. 2011, MNRAS, 418, 664
- Narayanan et al. (2012) Narayanan, D., Krumholz, M. R., Ostriker, E. C., & Hernquist, L. 2012, MNRAS, 2537
- Obreschkow et al. (2009) Obreschkow, D., Croton, D., DeLucia, G., Khochfar, S., & Rawlings, S. 2009, ApJ, 698, 1467
- Oosterloo et al. (2007) Oosterloo, T., Fraternali, F., & Sancisi, R. 2007, AJ, 134, 1019
- Pflamm-Altenburg & Kroupa (2008) Pflamm-Altenburg, J. & Kroupa, P. 2008, Nature, 455, 641
- Pilyugin & Thuan (2005) Pilyugin, L. S. & Thuan, T. X. 2005, ApJ, 631, 231
- Planck Collaboration et al. (2011) Planck Collaboration, Ade, P. A. R., Aghanim, N., et al. 2011, A&A, 536, A19
- Pohlen et al. (2010) Pohlen, M., Cortese, L., Smith, M. W. L., et al. 2010, ArXiv e-prints
- Popescu et al. (2000) Popescu, C. C., Misiriotis, A., Kylafis, N. D., Tuffs, R. J., & Fischera, J. 2000, A&A, 362, 138
- Popescu & Tuffs (2002) Popescu, C. C. & Tuffs, R. J. 2002, Reviews of Modern Astronomy, 15, 239
- Roman-Duval et al. (2010) Roman-Duval, J., Israel, F. P., Bolatto, A., et al. 2010, A&A, 518, L74+
- Rosolowsky (2005) Rosolowsky, E. 2005, PASP, 117, 1403
- Sancisi et al. (2008) Sancisi, R., Fraternali, F., Oosterloo, T., & van der Hulst, T. 2008, A&A Rev., 15, 189
- Sandstrom et al. (2011) Sandstrom, K. M., Leroy, A. K., Walter, F., et al. 2011, in Bulletin of the American Astronomical Society, Vol. 43, American Astronomical Society Meeting Abstracts #217, #202.07–+
- Schruba et al. (2011) Schruba, A., Leroy, A. K., Walter, F., et al. 2011, ArXiv e-prints
- Shapley (1951) Shapley, H. 1951, Proceedings of the National Academy of Science, 37, 133
- Shetty et al. (2011) Shetty, R., Glover, S. C., Dullemond, C. P., et al. 2011, ArXiv e-prints
- Skibba et al. (2011) Skibba, R. A., Engelbracht, C. W., Dale, D., et al. 2011, ArXiv e-prints
- Smith et al. (2000) Smith, D. A., Allen, R. J., Bohlin, R. C., Nicholson, N., & Stecher, T. P. 2000, ApJ, 538, 608
- Smith et al. (2010) Smith, M. W. L., Vlahakis, C., Baes, M., et al. 2010, A&A, 518, L51+
- Thilker et al. (2007) Thilker, D. A., Boissier, S., Bianchi, L., et al. 2007, ApJS, 173, 572
- Walter et al. (2008) Walter, F., Brinks, E., de Blok, W. J. G., et al. 2008, AJ, 136, 2563
- Walter et al. (2009) Walter, F., Leroy, A., Bigiel, F., et al. 2009, in American Astronomical Society Meeting Abstracts, Vol. 214, American Astronomical Society Meeting Abstracts, #419.08–+
- Weingartner & Draine (2001) Weingartner, J. C. & Draine, B. T. 2001, ApJ, 553, 581
- Wesselink (1961) Wesselink, A. J. 1961, MNRAS, 122, 509
- West et al. (2010) West, A. A., Garcia-Appadoo, D. A., Dalcanton, J. J., et al. 2010, AJ, 139, 315
- White et al. (2000) White, III, R. E., Keel, W. C., & Conselice, C. J. 2000, ApJ, 542, 761
- Wolfire et al. (2010) Wolfire, M. G., Hollenbach, D., & McKee, C. F. 2010, ApJ, 716, 1191
- Zaritsky (1994) Zaritsky, D. 1994, AJ, 108, 1619
Appendix A MAGPHYS SED Model
As an alternative check of the inferred dust masses, we ran the Multi-wavelength Analysis of Galaxy Physical Properties (magphys) package on the Spitzer and Herschel/SPIRE surface brightnesses. This is a self-contained, user-friendly model package to interpret observed spectral energy distributions of galaxies in terms of galaxy-wide physical parameters pertaining to the stars and the interstellar medium, following the approach described in da Cunha et al. (2008). Figure 9 summarizes the result: dust surface density derived from the magphys fit compared to those inferred from the number of distant galaxies. In Holwerda et al. (2007a), we found that the Draine et al. (2007) model inferred similar dust optical depths for these disks as the SFM as well as similar (to within a factor two) dust masses. The discrepancy with magphys illustrates, in our view, the importance of modeling sections of spiral disks in resolved observations with more physical models that include a range of stellar heating parameters (e.g. the models by Draine et al., 2007; Galliano et al., 2011).

SED of each WFPC2 field with the magphys fit.
![[Uncaptioned image]](/html/1209.0306/assets/x12.png)
![[Uncaptioned image]](/html/1209.0306/assets/x13.png)
![[Uncaptioned image]](/html/1209.0306/assets/x14.png)
![[Uncaptioned image]](/html/1209.0306/assets/x15.png)
![[Uncaptioned image]](/html/1209.0306/assets/x16.png)
![[Uncaptioned image]](/html/1209.0306/assets/x17.png)
![[Uncaptioned image]](/html/1209.0306/assets/x18.png)
![[Uncaptioned image]](/html/1209.0306/assets/x19.png)
![[Uncaptioned image]](/html/1209.0306/assets/x20.png)
![[Uncaptioned image]](/html/1209.0306/assets/x21.png)
![[Uncaptioned image]](/html/1209.0306/assets/x22.png)
![[Uncaptioned image]](/html/1209.0306/assets/x23.png)