A History of Cluster Analysis Using the Classification Society’s Bibliography Over Four Decades
Abstract
The Classification Literature Automated Search Service, an annual bibliography based on citation of one or more of a set of around 80 book or journal publications, ran from 1972 to 2012. We analyze here the years 1994 to 2011. The Classification Society’s Service, as it was termed, has been produced by the Classification Society. In earlier decades it was distributed as a diskette or CD with the Journal of Classification. Among our findings are the following: an enormous increase in scholarly production post approximately 2000; a very major increase in quantity, coupled with work in different disciplines, from approximately 2004; and a major shift also from cluster analysis in earlier times having mathematics and psychology as disciplines of the journals published in, and affiliations of authors, contrasted with, in more recent times, a “centre of gravity” in management and engineering.
1 Introduction
Clustering as a problem and as a practice in many different domains has proven to be quite perennial. Testifying to this is the presence of “clustering” or “cluster analysis” as a term in an important classification system. The premier professional organisation in computing research, the ACM (Association for Computing Machinery), has a standard classification labelling system for publications. Released in 1998, a major update was released in Sepember 2012, and another release is expected in 2014. In the 2012 ACM Computing Classification System (CCS, 2012), part of the category tree, at increasing level of detail, is as follows: “Mathematics of Computing”, “Probability and Statistics”, “Statistical Paradigms”, “Cluster Analysis”. The 1998 Computing Classification System (CCS, 1998) had clustering included in category H.3.3, and I.5.3 was another category “Clustering”.
Figures 1 and 2, using the Google Scholar content-searchable holdings, present a view of this perennial and mostly ever growing use of clustering. The term “cluster analysis” was used. Documents retrieved, that use that term in the title or body, increased to 404,000 in the decade 2000-2009. Of course lots of other closely related terms, or more specific terms, could additionally be availed of. These figures present no more than an expression of the growth of the field of cluster analysis. The tremendous growth in activity post-2000 is looked at in more detail in Figure 2. Time will tell if there is a decrease in use of the term “cluster analysis”. Again we note that this is just one term and many other related terms are relevant too.


A sampling of historical overviews of clustering follow. Kurtz (1983) presents an overview for the astronomer and space scientist. The orientation towards computer science is strong in Murtagh (2008), which takes in linkages to the Benzécri school of data analysis, and also current developments that have led Google’s Peter Norvig to claim (with some justification, albeit very debatable) that similarity-based clustering has led to a correlation basis coming to the fore in science, potentially replacing entirely the causation principle. A general history is also presented in Murtagh (2013).
2 40 Years of Service, the Classification Literature Automated Search Service
The Classification Literature Automated Search Service started with Volume 1 in 1972 (using the previous calendar year’s data). It was published as a printed booklet from the start and bore the ISSN 0731-4043. It was necessary in the editorial and printing team to plan carefully the total number of printed pages, to liaise with Springer’s headquarters and distribution center (these were in New York City and in Secaucus, New Jersey) and the printing company used (Sheridan Press, Pennsylvania) and then to have copies of the bibliography shipped with the Journal of Classification to subscribers and also to libraries.
From June 1984 through May 1993, the Editor of Service, or sometimes CSNA Service as it was referred to, was William H.E. Day. During that time the Technical Editors were Elaine Boone (1984–1988) and Eva Whitmore (1989–1993). Bill Day also had the assistance of Todd Wareham, a computer science student then, in the preparation of camera-ready copy for volumes 14–16 (1985–1987). Technical Support included use of C programs and Unix scripts for reformatting the data. Bill Day was based in the Department of Computer Science, Memorial University of Newfoundland, St. John’s, Newfoundland.
The data was obtained from ISI, the Institute for Scientific Information, which is now a subsidiary of Thomson-Reuters (and publishes the World of Science, the Science Citation Index, the Social Science Citation Index, and other products). Processing of the bibliographic data was always required. In the early years, a range of nroff and troff text processing utilities were used to re-format the data. Due to limitations on the output and distributed format (book, later diskette, then CD), various algorithms were applied to restrict the quantity of data. This included filtering by listing journal titles, and keywords to be excluded in titles of published articles. Thus, in the latter case, medical terms, or “galaxy cluster”, betokened non-algorithmic matters and hence were to be excluded.
Before Bill Day, Roger K. Blashfield (University of Florida) was Editor. Fionn Murtagh was Editor from 1993 to 2008. Michael Kurtz was Editor thereafter. Eva Whitmore remained as Technical Editor, having started as noted above in 1988.
In the 1990s the bibliography went to diskette format and there too we rapidly went to the storage capacity of the media at that time – 5.25 inch “floppies” that were to be replaced by 3.5 inch diskettes. It made sense then, as announced by us in the production team in October 1999, to transit to CDs, which additionally allowed us, due to the storage available, to have previous years’ bibliographies, and then to have scanned copies of “profile” books available on the CD. Below it is explained just how the profile of books and articles was used to drive the retrieval process and thereby to define the domain of interest.
In 1994, on-line content search to the bibliographies was supported by the WAIS, Wide-Area Information System, distributed search and retrieval standard. This was an early forerunner of the search engines to come a few years later.
As either book or as CD, the bibliography, that was termed Service, was distributed as a supplement to the Journal of Classification, published by Springer on behalf of what is now called the Classification Society111http://www.classification-society.org/clsoc. The Classification Society was set up in April 1964. In December 1968, European and North American branches were set up, and were largely autonomous. These branches became the Classification Society of North America (CSNA), and the British Classification Society. In 2008, CSNA reverted to its former name of the Classification Society. (Various historical documents can be found on the web sites of the Classification Society, and of the British Classification Society222Currently http://thames.cs.rhul.ac.uk/bcs.) The Journal of Classification saw its Volume 1, Number 1, in 1984, and its first Editor-in-Chief was Phipps Arabie (born 13 March 1948, died 23 June 2011). Phipps Arabie was a very strong supporter always of the Service bibliographies. From 2002 to date (2012), Willem Heiser is Editor-in-Chief of the Journal of Classification.
In 2008, the last CD was produced, due to the plan be be web-based only. In 2012, ISI discontinued the provision of data completely. For online access now to Service, see https://www.cfa.harvard.edu/kurtz
The following333Currently available as file service23.profile.txt at address ftp://ftp.pitt.edu/group/csna. is from the introduction to Volume 23, 1994. It explains the mechanism used to carry out the searches and to assemble the bibliographies.
“This volume of the Classification Literature Automated Search Service contains a bibliography of 2497 classification-related journal papers which appeared in 1994. In order to use the Service knowledgeably for reference, readers should know about the databases from which the journal papers were selected, the criteria employed to identify classification-related papers, and the mechanisms provided to access bibliographic information about classification-related papers.
The first step in constructing the bibliography is to collect data about journal papers. The Service obtains these data from Research Alert, a bibliographic service of the Institute for Scientific Information (ISI, Philadelphia). Research Alert enables the Service to access papers in over 8000 science, technical, and social sciences journals including those from the Science Citation Index, Social Sciences Citation Index, and Arts Humanities Citation Index databases. To use Research Alert, the Service’s Editorial Board compiles a list, or profile, of books or papers, called profile items, that are indicative contributions to the theory and practice of classification. A journal paper is considered to be classification-related if it cites one or more profile items. Using the profile, Research Alert provides the Service with bibliographic information about classification-related papers in recent issues of the 8000 journals it processes.
Research Alert’s selection procedure depends completely on the profile. The Editorial Board reviews the profile regularly in order to ensure that the papers selected by Research Alert are relevant to classification and related areas of data analysis. The profile for this volume of the Service contained 82 items and appears in the file ‘profile.txt’. The Editor welcomes your suggestions for improving the composition of future profiles.”
3 The Data: The Bibliographies of Clustering from 1994 to 2011
The bibliography was always collected for the previous year. Hence volume 23, corresponding to 1994 data, was published in 1995. The volumes continue up to volume 40, with 2011 data, consolidated in 2012. In volumes 23 to 40, there are 85,020 bibliographic records.
3.1 The Profile Publications Used to Drive the Search and Retrieval
The “profile” publications used in the past few years are listed in the Appendix. Citing any one of these publications was therefore the criterion used for assembling the annual bibliography.
The number of citations per year is shown in Table 1. This relates to the bibliographies for the years 1994 to 2011.
It is to be noted how some of the profile publications were introduced in a given year. (Consider, for example, Blashfield76, introduced from 2004.)
In the case of, for example, Bishop95, in pre-1995 years, the search term used here (“BISHOP CM”) picked him up as an author of another publication and not the profile publication, his 1995 book.
Note too that the (different) works of some authors are combined by us. Such is the case for example for two publications by Doug Carroll, published in 1970 and in 1980. (J. Douglas Carroll, 1939–2011, worked most recently at Rutgers Business School. He was an early developer of, and founder of the field of, multidimensional scaling and other methods and their applications in psychometrics.)
                   94  95  96  97  98  99  00  01  02  03  04   05   06   07   08   09   10   11
Adams72             8  12   7   7   5   4   2   5   5   5   5    2    5    6    3    5    3    3
Anderberg73        73  54  67  60  64  78  72  58  65  56  39   56   48   64   53   77   52   67
Arabie87            8   7  11   8  10  10   5   4   6   4   0    0    0    0    0    0    0    0
Avise74            11  12  15   9   9  10   5   7   1   3   1    6    2    1    3    0    4    3
Benzecri73         41  50  50  40  51  43  51  30  29  39  24   30   32   25   32   34   38   35
Bezdek81           45  45 107  87 114 131  97 118 126 151 337  432  496  495  558  701  588  551
Bishop95            2   0   1   0   1   1   0  10 262 335   0    0    0    0    0    0    0    0
Blashfield76        0   0   0   0   0   0   0   0   0   0   3    6    8    4    3    8    5    5
Breiman84         106 130 181 165 199 228 224 224 275 358 266  294  345  393  441  620  528  647
Carroll70,80       34  24  25  31  24  40  27  40  33  28   0    0    0    0    0    0    0    0
Cormack71           2   6   7   2   4   7   5   4   8   2   7    8    3    5    8    9    6    9
Cover67            24  21  21  24  28  30  28  31  25  54   0    0    0    0    0    0    0    0
Devijver82         32  28  42  59  54  37  32  43  31  47  64   63   72   50   64   62   43   49
Diggle83           33  35  41  36  38  49  57  51  56  56  77   87   68   78   84  107   97   73
Duda73            241 252 304 283 337 309 289 324 379 600 825 1033 1175 1309 1416 1554 1164 1316
Efron83            14  24  21  21  20  30  32  26  16  25  20   43   60   61   56   66   56   53
Eldredge80         25  21  24  24  25  19  15  16  17  23  38   30   19   32   43   31   37   38
Everitt79,80       33  52  47  35  38  39  37  41  26  18 132  146  139  133  148  181  186  166
Farris72           22  23  39  26  21  25  12  21  18   9   5   10    4   12    9   10    3    7
Felsenstein82      35  38  23  16  16  13   6  16   7  10   3   10    3    5    9   10    4    3
Fisher36           42  49  50  70  64  68  60  67  86  96  96  207  187  223  249  255  267  284
Fitch67           102 104 113 111  90  79 110  75  85  65  63   84   64   51   62   47   44   36
Friedman77         10   8  13  13  18  18  18  12  17  17  26   28   23   30   40   38   38   34
Fu74,82            33  26  27  20  29  32  22  23  10  23  58   58   58   52   57   58   46   58
Fukunaga72         28  38  43  38  37  34  29  31  36  34 374  447  396  478  528  549  424  455
Gauch82            73  80  80 104  76 104  77  91  90  88   0    0    0    0    0    0    0    0
Gnanadesikan77     15  26  13  15   8  17  19  12  14  11   0    0    0    0    0    0    0    0
Gordon81           21  23  18  16  20  12  20  16  16   8  65   73   66   70   61   87   56   60
Gower66            40  14  33  37  27  34  34  33  33  47  29   52   66   60   60   87   61   95
Greenacre84        46  56  69  50  69  71  51  52  49  61  25   41   34   28   33   36   40   39
Guttman68          25  16  11  14  18  13  14  15  12  16  14   14   20   16   20   20    9    7
Hand81             33  26  30  28  30  33  20  18  28  25  65   89   96   83   95  119  102  119
Hartigan75         68  64  76  62  62  72  79  87  86  94 143  150  145  160  195  244  178  203
Hennig66           86  79  87  93  80  76  81  72  72  79 102  100  105  103  115  110   97  130
Hill74             14  15  19  14  13  10  11  11   4  12   0    5    9    3   18   14   11    2
Huber85            22  24  29  18  19  37  18  27  20  24   0    0    0    0    0    0    0    0
Hubert7685         15  12  14  16  13  19   8  23  18  37  36   48   72   78  104  135  137  134
Jain88             52  44  54  58  59  81  74  81  81 115 716  860  910  939 1014 1190  882  969
Jardine71           6   6   6   9   7   4   5   8   6   6  14   21   13   18   25   32   24   26
Johnson67          24  27  20  18  10  13   7   7   9   7  11   29   28   37   55   48   40   48
Kluge69            58  42  55  56  66  63  79  96  58  85  59   78   81   85   99  115  105  112
Kohonen95           0   0   2   0  13  52  88  80  91  97 374  444  415  450  534  693  438  462
Kruskal64,78       72  78  90 102  99  98 112 119 123 141 152  186  204  207  255  255  223  278
Lance67            11  13  14  15  10  22   8  18  13  16  18   24   17   13   21   17   15   25
Legendre83         20  24  33  31  32  25  36  24  22  21  26   44   33   42   45   24   35   37
Lorr83             11  19  13   6  10   8   5   7   9  11  11   19   12   19   12   13   10   17
Maddison84         55  48  41  38  48  50  46  34  35  23   0    0    0    0    0    0    0    0
Mantel67           61  77  99 117 112 138 145 185 182 207 163  296  308  360  362  453  392  452
Mayr69             26  22  19  31  22  25  26  21  19  15 132  140  124  152  142  149  128  179
McLachlan88,92,97  28  33  37  33  33  28  34  50 130 136 154  137  168  188  173  213  234  235
Michalski83        53  45  52  38  43  38  31  21   9  15  48   30   28   22   31   45   33   26
Milligan80,81,85   39  35  35  40  34  36  29  39  66  63  56   58   84   79   91  105   88  106
Murtagh83           2   2   0   0   4   4   0   2   1   0   6    8    8    8    9   10   15   15
Nei72             139 140 170 179 156 169 185 172 169 166 131  188  185  193  198  198  191  220
Nelson81           45  32  46  27  38  33  34  39  49  30  46   61   60   50   60   77   52   62
Nosofsky84         14  15  14  16  25  10  15  11  21  20   8   16   17   14   17   10   23   27
Orloci78           14   7  15  15  12  10  14  10   6   9   8   10   18   17   11   22   25   26
Pavlidis77         14  15  18   9  12  21   7   8  10   6  90  103   82   59   90   91   52   60
Punj83             11  13  14  11  13  12   9   8  15  20  17   23   21   18   24   51   30   45
Rammal86           13   9   9   7  16  11  12  14  14   5   0    0    0    0    0    0    0    0
Rand71              4   8   4   6   2   3   2  11   9  11  17   33   39   51   78  118  104   85
Reyment84          13  15  10  17  12  12  10   4  10  10  12   18   14   21   15   17   10   18
Ripley81           50  46  52  63  59  64  60  63  60  57 173  192  193  175  179  244  178  215
Rohlf82            10   6   7  10   3   3   6   4   4   6   2    2    2    7    2    4    2    3
Sammon69           22  27  29  36  32  47  45  47  43  63   0    0    0    0    0    0    0    0
Sankoff83          31  24  31  27  38  28  36  27  28  26  55   68   76   72   64   58   71   59
Sattath77           8  10  15   9  12   8  12  16   9  11   7    9    8    9   11   11    5    9
Schiffman81        22  32  34  33  25  21  20  28  19  24  20   17   14   12   18   18   14   17
Silverman86       117 131 183 140 161 192 172 158 191 206 264  306  287  350  384  462  410  383
Sneath73          385 374 422 435 406 386 367 360 355 357  94   99  111  139  122  133   92  128
Sokal63            53  52  45  53  42  35  44  43  40  36 225  272  251  252  287  282  225  282
Spaeth80            9  13  10  17  10   6  10  12   9  16  17   32   26   24   29   43   35   32
Spitzer74          12   5   5   2   4   2   2   4   3   8   6    3    3    7    4    9    5    4
Swofford81        116 127 171 151 135 127 125 115 102  84  55   67   46   36   32   20    9   24
Tversky77          46  68  65  82  69  81  74  70  63  97  62   97  109  101  126  142  134  136
VanLaarhoven87     46  56  65  45  45  42  48  44  33  32  54   65   58   64   53   64   38   61
VanRijsbergen79     0   0   2   0   0   0  46  54  38  88   2    2    8    7    9   19   12   18
Ward63             65  74  75  81  81  95 109 115 100 130 109  191  182  223  231  303  274  318
Wiley81            79  66  52  66  61  54  59  53  43  60  47   71   53   69   75   66   56   68
Wishart87          29  16  12  18  10   8  17   7  14  14   7    9   15   17   16   19   23   12
Wolfe70             6   9   8   8   8  11   8   8   9   4   7    7    8    7    5   13    8   16
Zahn71              8  11  14  13  11   5  10   8   9  21  20   24   14   22   24   29   30   25
3.2 Changed Data Provision After 2003
What is particularly noticeable about Table 1 is the increase in citations over time. See Figure 4. While it is the case that (i) there was some net increase each year, but (ii) nonetheless the lack of constraint related to distribution medium from 2004, (iii) that can be coupled with the massively growing volume of research production worldwide, and finally (iv) the high point of 2009, maybe given a lag to be expected in publishing following the economic downturn in the Western countries that started in 2008. Among other changes from 2004, see how Sneath73 is replaced largely (cf. Table 1) by the earlier jointly authored volume, Sokal63. (P.H.A. Sneath, University of Leicester, UK, 17 November 1923 – 9 September 2011, and R.R. Sokal, State University of New York, 13 January 1926 – 9 April 2012, were key names in the development of numerical taxonomy.)

Table 2 is an alternative view of the 18 years we are dealing with. This table shows a range of discipline names that are picked up in the data by their appearance in a journal title, or a publication title, or an area title. The terms used are: Medicine, Biology, Physics, Chemistry, Astronomy, Mathematics, Statistics, Engineering, Psychology, Psychiatry, Literature, Humanities, Economics and Sociology.
       94  95  96  97  98  99  00  01  02  03  04  05  06  07  08  09  10  11
Med     1   0   1   2   2   1   3   3   5   5  82 111 120 136 147 205 146 156
Bio   334 345 372 369 389 364 387 346 397 392 274 354 360 393 463 559 508 545
Phys    5   5   1   2   4   1   4   5   9   5  73  60 104  94 129 113 132 131
Chem   76  55  64  59  88  63  88  87 100 117  57  83  86  71  93 138 125 115
Astr    1   0   1   0   1   0   0   2   3   1   4   4   9   4  14   5   3  19
Math   70  63  84  63  82  89  77  79  86  79  23  42  27  39  41  55  48  62
Stat   98 105 117  94  92 128 111 104 125 101 207 255 266 287 312 340 345 310
Eng   108 118 121 137 135 132 134 161 216 217 355 424 468 470 753 517 472 689
Psych 128 155 164 141 128 132 147 118 124 151  77  72  85  94  97 103  93  99
Psy     2   0   0   1   0   0   0   2   1   0  15  12   6  12  10  13  10   9
Lit     2   1   1   1   3   1   3   2   1   5   9   9   8   4   3   7   9  10
Hum     9  19  15  15  18  14  23  17  19  36   1   0   1   1   4   4   7   4
Eco     0   0   0   0   2   0   0   2   1   1  26  29  33  30  40  53  45  42
Soc    21  24  27  16  25  17  17  24  24  20   7   2   5  16   2  13  11  12
From the editorial report of Service to the Board of the Classification Society of North America in June 2003, there is the following explanation of the sea-change in the bibliographic source data from 2004 onwards.
“The CD containing Service data, cumulative over a number of years, with a Java graphical user interface, and copies of Hartigan’s (scanned) and van Rijsbergen’s classical books, was distributed as usual with issue 1 of the Journal of Classification. Number of copies produced 525. …
Up to now, Eva got the data quarterly and initially processed it at Memorial University. (A long time ago Bill Day there was the link with Memorial). Probably the scripts in use there are 15 years old, or more. Then I did some processing, with a number of Unix scripts. For the CD, a Java application based search GUI was written 2 or 3 years ago, and of course assumed the particular format discussed above. Now ISI, from whom we purchase the data (about USD 70 per profile item) are changing the dissemination mechanism and the format. …
… our new format for receiving data from ISI. [ISI] emailed me about a week ago and informed me that “Research Alert” data will no longer be available – they are switching totally to “Personal Alert”, as below. We get the same data, in a weekly email, but as you can see, the format is different.
[…]
I notice this data has keywords associated.”
T       Learning to Set-Up Numerical Optimizations of
T       Engineering Designs
A       SCHWABAC.M
A       ELLMAN T
A       HIRSH H
K       MATHEMATICAL SCIENCES - Computer Science
U       AI EDAM      12(2): 173-192,APR 1998
W         M Schwabacher, Natl Inst Stand &
W         Technol, Gaithersburg, MD 20899
W.      BREIMAN L    84
TITLE:          Multiscale spatial variation of the bark beetle Ips
                sexdentatus damage in a pine plantation forest (Landes de Gascogne,
                Southwestern France) (Article, English)
AUTHOR:         Rossi, JP; Samalens, JC; Guyon, D; van Halder, I;
                Jactel, H; Menassieu, P; Piou, D
SOURCE:         FOREST ECOLOGY AND MANAGEMENT 257 (7). MAR 22 2009.
                p.1551-1557 ELSEVIER SCIENCE BV, AMSTERDAM

SEARCH TERM(S):  RIPLEY BD  rauth; DENSITY ESTIM*  rwork; MULTI*  rwork

KEYWORDS:       Bark beetle; Ips sexdentatus; Pinus pinaster; Spatial
                statistics; Ripley’s statistic; Aggregation; Landscape;
                Plantation forest
KEYWORDS+:       POINT PATTERN-ANALYSIS; TYPOGRAPHUS L.; FELLED TREES;
                SPRUCE; SCOLYTIDAE; COLEOPTERA; MANAGEMENT; WINDTHROW;
                RISK; COLONIZATION

AUTHOR ADDRESS: JP Rossi, INRA, UMR BIOGECO, Domaine Hermitage 69 Route
                Arcachon, F-33612 Cestas, France
4 Semantic Analysis of Profile Publications and of Disciplines, over 18 Years
4.1 Semantic Analysis
Take the observables, e.g. profile publications, or disciplines, as indexed by . Take the attributes, e.g. the years, as indexed by . Call the mass of observable to be , and analogously the mass of attribute , . These masses are components of marginal distributions. Alternatively expressed, the and terms, for all and , are respectively the empirical probability distribution defined on the set of all observables, , and on the set of all attributes, . The domains of the function are thus, respectively, the observables set and the attributes set.
The frequency of occurrence data used for observable and attribute is . Correspondence Analysis is firstly and foremostly the study of discrepancy of from a sort of null hypothesis expressed by .
A successively best fit Euclidean representation is found, to embed the observable set, and the attribute set. Let the observable have embedding, firstly, and then, secondly, projection relative to factor , and similarly for attribute relative to factor . The associated eigenvalue of the pair of factors and is .
We require the semantic relationship tying together observables and attributes vis-à-vis each successive factor:
These are termed transition formulas.
Supplementary elements, rows or columns, are when we use values that are, through these relationships, projected post hoc into the analysis.
The semantic analysis framework is now used to provide (1) visualization, seeking particular salient interrelationships in the data, and (2) summarization of the data through clusters, where we use years, disciplines and publications to achieve a good understanding of the data. Here (1) is a planar, and hence low-dimensional, expression of the data, whereas in (2) the clustering is carried out in the data’s full dimensionality.
4.2 Major Change: Pre-2004 and From 2004 Onwards
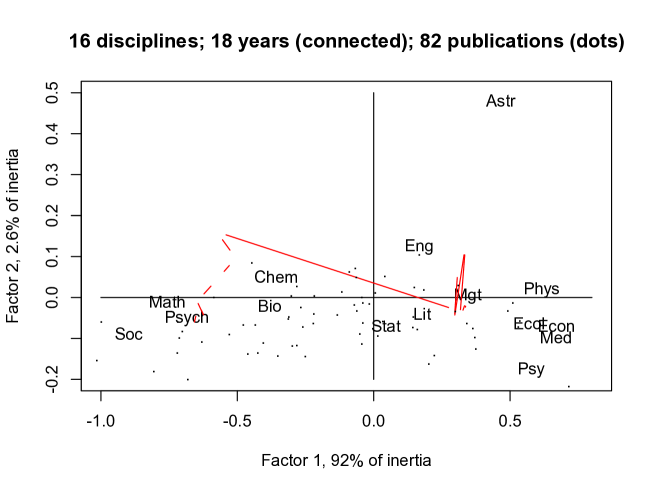
The profile publications, as seen in Table 1, contain inclusions and withdrawals, and also data source issues over which there was no control. So a more suitable analysis, because it was based on free text search and no more than that, is based on the discipline labels. Therefore our first analysis is of the frequency of occurrence data for 16 disciplines crossed by 18 years. Figure 5 shows the principal factor plane. Humanities (denoted Hum), is off to the left (on the positive side of the ordinate).
The major issue of note in Figure 5 is how one-dimensional the data is. In information content expressed by percentage of inertia explained by these principal axes, the first axis dominates.
The (red in the original) lines connect the successive years, that are projected onto this principal factor plane. The clump of years around Math (mathematics) and Psych (psychology) are all the years 1994 to 2000; and then just north east of them is 2001, followed by 2002, and north west of it, 2003. They are all on the negative side of the first factor, in terms of projections on that factor. Over to the positive side of the first factor are the years 2004 through to 2011. The years that lie out a little to the north of the clump are 2011 and (the further away year) 2008.
Can we say that Math and Psych, and Soc (sociology) are more typical of the earlier years in regard to cluster analysis research; and that if anything Mgt (management) is most typical of the later years here, in regard to computer science research? In order to address this, we ought to look at the full dimensionality of the data rather than just a 2-dimensional projection. This will be done below.
Profile publications are shown as dots in Figure 5 (so as not to crowd the figure). Some are projected well off this figure. Because these are cited publications rather than coming from a given discipline, let us look at them through the cluster analyses to follow now.
4.3 Semantics Analyzed through Clustering of Years, Disciplines and Publications
In the following we use the Euclidean space, with equiweighted points, as provided by the Correspondence Analysis. The points in this space are equiweighted. Furthermore we use the full dimensionality Euclidean space. Since the active analysis was on the 16 disciplines crossed by 18 years data, the full dimensionality of the Euclidean factor space is min , i.e. 15. In this 15-dimensional space (illustrated by the planar projection in Figure 5 we thus have disciplines and years projected, and then as passive (or post hoc) elements we have publications projected. Because the projection takes full account of interrelationships as discussed in subsection 4.1 we have that years, disciplines and publications are all projected into the same space.
Ward’s minimum variance hierarchical clustering using Euclidean distances is an appropriate method to use. It is appropriate in the sense that it uses aggregation based on inertia (masses all identical) which dovetails with the inertia-based decomposition of the Correspondence Analysis. (This hierarchical clustering criterion was initially described by Joe H. Ward Jr., who died on 23 June 2011, aged 84.)
Figure 6 relates to disciplines and years. The very clear year-based division of the data is displayed by the two big branches in the dendrogram. We also have further support of the quite key role of Psych (psychology) and Math (mathematics), and others, in the early years; and the key role of Mgt (management), Stat (statistics) less pronounced but present, and others, in the later years.

In Figure 7, the 82 documents are also included. For discussion of clusters, we will use the labels shown in Figure 8. This allows us more easily to discuss the publications, and their associations with years and disciplines, in order to home in on major trends and patterns in this data.


-
Cluster 1
(cf. Figure 8):
-
Disciplines:
Med Phys Astr Eng Ecol Psy Lit Econ Mgt
-
Years:
04 05 06 07 08 09 10 11
-
Publications:
Bezdek81 Blashfield76 Duda73 Everitt79,80 Fisher36 Fukunaga72 Gordon81 Hand81 Hubert7685 Jain88 Kohonen95 Mayr69 McLachlan88,92,97 Murtagh83 Pavlidis77 Rand71 Ripley81 Sokal63
-
Disciplines:
-
Cluster 2:
-
Disciplines:
Bio Chem Stat
-
Publications:
Breiman84 Cormack71 Devijver82 Diggle83 Efron83 Eldredge80 Friedman77 Fu74,82 Gower66 Hartigan75 Hennig66 Jardine71 Johnson67 Kluge69 Kruskal64,78 Lance67 Legendre83 Lorr83 Mantel67 Milligan80,81,85 Nei72 Nelson81 Orloci78 Punj83 Reyment84 Sankoff83 Silverman86 Spaeth80 Tversky77 VanLaarhoven87 Ward63 Wiley81 Wolfe70 Zahn71
-
Disciplines:
-
Cluster 3:
-
Disciplines:
Math Psych Soc
-
Years:
94 95 96 97 98 99 00 01 02 03
-
Publications:
Adams72 Anderberg73 Avise74 Benzecri73 Farris72 Felsenstein82 Fitch67 Greenacre84 Guttman68 Hill74 Michalski83 Nosofsky84 Rohlf82 Sattath77 Schiffman81 Sneath73 Spitzer74 Swofford81 Wishart87
-
Disciplines:
-
Cluster 4:
-
Discipline:
Hum
-
Publications:
Arabie87 Carroll70,80 Cover67 Gauch82 Gnanadesikan77 Huber85 Maddison84 Rammal86 Sammon69
-
Discipline:
-
Cluster 5:
-
Publications:
Bishop95 VanRijsbergen79
-
Publications:
From these clusters it can be seen how the “classical” period characterized by cluster 3 is counterposed to the “modern” period of cluster 1.
The dominant disciplines of the “classical” period were Math, Psych and Soc (mathematics, psychology and sociology). Certainly some of the profile publications cited in the “classical” period come from ecology, phylogeny and even machine learning, but this is not a matter of their disciplines but rather cross-discipline influence.
For the “modern” period, cluster 1, it is seen in the planar projection of Figure 5 how Mgt, management, is very central. Other disciplines that characterize especially this cluster are noted above. The more influential profile publications can be read off too.
Clusters 4 and 5 are broadly associated with the “classical” period. The pattern recognition and information retrieval profile publications of cluster 5 are in tune with this (given the major ongoing role certainly from the 1960s of these sub-disciplines).
Cluster 2, closest to the “modern” period, is characterized most of all by the disciplines of Bio, Chem, Stat, viz. biology, chemistry and statistics. See how in Figure 5, we would not have found that outcome from the planar projection alone.
5 A Search User Interface
The open source Apache Solr indexing, querying and search system (Solr, 2013a) was used. Version 4.0 was used in our work.
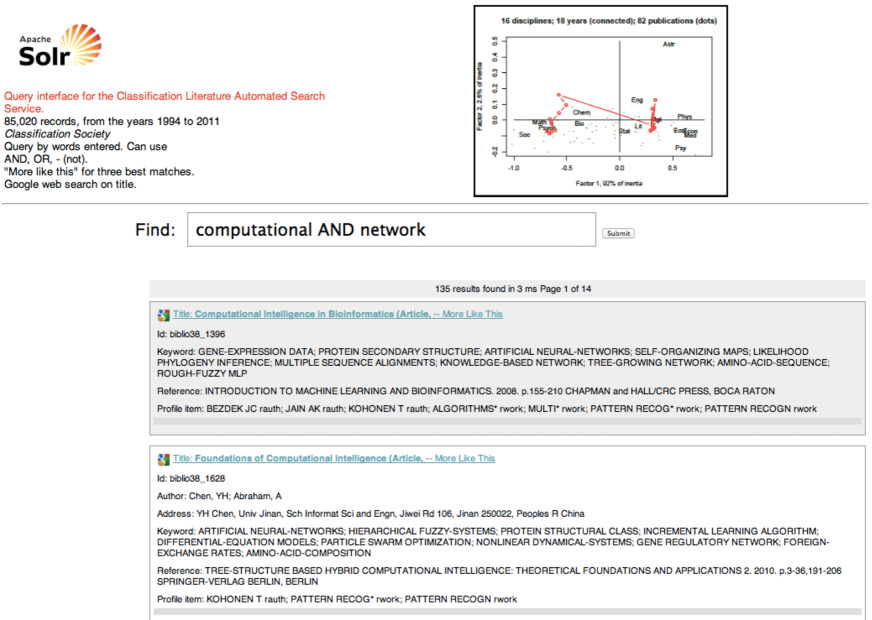
Figure 9 shows a screen in a sample session. All of the following are supported: querying repeatedly; constraining the query by field (e.g. “author:Arabie”); having a web-wide Google search carried out in another browser screen for the set of words appearing in a title; and finding three “More Like This” results for a given bibliographic record, based on a weighted (for the fields) set of common words. There is practically no latency in having query results returned and displayed. As set up, 10 results are shown per page, and successive records are displayed with grey and with white background.
Solr is an enterprise search and display facility, implying that its secure use needs to be within an enterprise (i.e. firewall or access) setting. See Solr (2013b).
6 Conclusions
The 135,088 citations to one or more of the 82 profile publications have led us to find a major thematic shift in clustering research over the 18 years considered here. At its most basic, this thematic shift is from the central role of mathematical psychology in the years 1994 to 2003, and then the central role subsequently of management. A trend of massive proportions has also been the annual increase in Service contents. Other less pronounced trends can be noted also.
Cluster analysis has shown, and continues to show, great vitality in terms of responding to the challenges raised in many different disciplines. Vitality is both methodological and practical.
Acknowledgement
Eva Whitmore’s role as Technical Editor from the academic year 1988–1989 to date (mid-2012) has been greatly appreciated.
References
CCS (1998). Computing Classification System, Association for Computing Machinery, ACM, 1998. http://www.acm.org/about/class/ccs98-html (Viewed: 2013-03-03.)
CCS (2012). Computing Classification System, Association for Computing Machinery, ACM, 2012. http://dl.acm.org/ccs.cfm (Viewed: 2013-03-03.)
KURTZ, M.J. (1983). “Classification methods: an introductory survey”, in Statistical Methods in Astronomy, European Space Agency Special Publication 201, pp. 47–58.
MURTAGH, F. (2008). “Origins of modern data analysis linked to the beginnings and early development of computer science and information engineering”, Electronic Journal for History of Probability and Statistics, 4 (2), pp. 26.
MURTAGH, F. (2013). “History of cluster analysis”, in J. Blasius and M. Greenacre, Eds., The Visualization and Verbalization of Data, Chapman and Hall, forthcoming.
SOLR (2013a). Apache Solr, Open source enterprise search platform, version 4.1. http://lucene.apache.org/solr (Viewed: 2013-03-03.)
SOLR (2013b). Solr Wiki, Solr security, http://wiki.apache.org/solr/SolrSecurity (Viewed: 2013-03-03.)
Appendix: The Profile Publications Used
AUTHOR            JOURNAL/BOOK TITLE    VOL P. YR.

ADAMS EN          SYST ZOOL             21  390 72
ANDERBERG MR      CLUSTER ANAL APPLICA          73
ARABIE P          3 WAY SCALING CLUSTE          87
AVISE JC          SYST ZOOL             23  465 74
BENZECRI JP       ANAL DONNEES                  73
BEZDEK JC         PATTERN RECOGNITION           81
BISHOP CM         NEURAL NETWORKS PATT          95
BLASHFIELD RK     PSYCHOL B             83  377 76
BREIMAN L         CLASSIFICATION REGRE          84
CARROLL JD        ANN R PSYCH           31  607 80
CARROLL JD        PSYCHOMETRI           35  283 70
CORMACK RM        J ROYAL STA A        134  321 71
COVER TM          IEEE INFO T           13   21 67
DEVIJVER PA       PATTERN RECOGNITION           82
DIGGLE PJ         STATISTICAL ANAL SPA          83
DUDA RO           PATTERN CLASSIFICATI          73
EFRON B           J AM STAT A           78  316 83
ELDREDGE N        PHYLOGENETIC PATTERN          80
EVERITT BS        BIOMETRICS            35  169 79
EVERITT BS        CLUSTER ANAL                  80
FARRIS JS         AM NATURAL           106  646 72
FELSENSTEIN J     Q REV BIOL            57  379 82
FISHER RA         ANN EUGENICS 2         7  179 36
FITCH WM          SCIENCE              155  279 67
FRIEDMAN JH       ACM T MATH             3  209 77
FU KS             SYNTACTIC METHODS PA          74
FU KS             SYNTACTIC PATTERN RE          82
FUKUNAGA K        INTRO STATISTICAL PA          72
GAUCH HG          MULTIVARIATE ANAL CO          82
GNANADESIKAN      METHODS STATISTICAL           77
GORDON AD         CLASSIFICATION                81
GOWER JC          BIOMETRIKA            53  325 66
GREENACRE MJ      THEORY APPLICATION C          84
GUTTMAN L         PSYCHOMETRI           33  469 68
HAND DJ           DISCRIMINATION CLASS          81
HARTIGAN JA       CLUSTERING ALGORITHM          75
HENNIG W          PHYLOGENETIC SYSTEMA          66
HILL MO           APPL STAT             23  340 74
HUBER PJ          ANN STATIST           13  435 85
HUBERT L          BR J MATH S           29  190 76
HUBERT LJ         J CLASSIF              2  193 85
JAIN AK           ALGORITHMS CLUSTERIN          88
JARDINE N         MATH TAXONOMY                 71
JOHNSON SC        PSYCHOMETRI           32  241 67
KLUGE AG          SYST ZOOL             18    1 69
KOHONEN T         SELF ORG MAPS                 95
KRUSKAL JB        MULTIDIMENSIONAL SCA          78
KRUSKAL JB        PSYCHOMETRI           29    1 64
LANCE GN          COMPUTER J             9  373 67
LEGENDRE L        NUMERICAL ECOLOGY             83
LORR M            CLUSTER ANAL SOCIAL           83
MADDISON WP       SYST ZOOL             33   83 84
MANTEL N          CANCER RES            27  209 67
MAYR E            PRINCIPLES SYSTEMATI          69
MCLACHLAN GJ      DISCRIMINANT ANAL ST          92
MCLACHLAN GJ      EM ALGORITHM EXTENSI          97
MCLACHLAN GJ      MIXTURE MODELS INFER          88
MICHALSKI RS      MACHINE LEARNING              83
MILLIGAN GW       MULTIV B R            16  379 81
MILLIGAN GW       PSYCHOMETRI           45  325 80
MILLIGAN GW       PSYCHOMETRI           50  159 85
MURTAGH F         COMPUT J              26  354 83
NEI M             AM NATURAL           106  283 72
NELSON G          SYSTEMATICS BIOGEOGR          81
NOSOFSKY RM       J EXP PSY L           10  104 84
ORLOCI L          MULTIVARIATE ANAL VE          78
PAVLIDIS T        STRUCTURAL PATTERN R          77
PUNJ G            J MARKET RES          20  134 83
RAMMAL R          REV M PHYS            58  765 86
RAND WM           J AM STAT A           66  846 71
REYMENT RA        MULTIVARIATE MORPHOM          84
RIPLEY BD         SPATIAL STATISTICS            81
ROHLF FJ          MATH BIOSCI           59  131 82
SAMMON JW         IEEE COMPUT           18  401 69
SANKOFF D         TIME WARPS STRING ED          83
SATTATH S         PSYCHOMETRI           42  319 77
SCHIFFMAN SS      INTRO MULTIDIMENSION          81
SILVERMAN BW      DENSITY ESTIMATION S          86
SNEATH PHA        NUMERICAL TAXONOMY P          73
SOKAL RR          PRINCIPLES NUMERICAL          63
SPATH H           CLUSTER ANAL ALGORIT          80
SPITZER RL        BRIT J PSYCHI        125  341 74
SWOFFORD DL       J HEREDITY            72  281 81
TVERSKY A         PSYCHOL REV           84  327 77
VANLAARHOVEN      SIMULATED ANNEALING           87
VANRIJSBERGEN     INFORMATION RETRIEVA          79
WARD JH           J AM STAT A           58  236 63
WILEY EO          PHYLOGENETICS                 81
WISHART D         CLUSTAN USER MANUAL           87
WOLFE JH          MULTIV B R             5  329 70
ZAHN CT           IEEE COMPUT           20   68 71