Measurement of Mixing and Violation at BABAR
Giulia Casarosa
Università di Pisa and INFN - Sezione di Pisa
giulia.casarosa@pi.infn.it
(on behalf of the BABAR Collaboration)
We report on a measurement of mixing and a search for violation in the channels. We use ’s coming from decays, so that the flavour of the at production is tagged by the charge of the pion that is also emitted. We also use an independent set of ’s coming directly from the hadronization of the charm quark, but in this case the flavour of the charmed meson is not known. We analyze events collected by the BABAR experiment at the PEP-II asymmetric-energy collider, corresponding to an integrated luminosity of 468. We measure the mixing parameter value to be , and exclude the no-mixing hypothesis at significance. We find no evidence of violation, observing which is consistent with zero.
PRESENTED AT
The International Workshop on Charm Physics
Honolulu, Hawai’i, May 14–17, 2012
1 Introduction
Mixing in the charm sector is a well-established phenomenon [1, 2, 3, 4, 5, 6] although there is no single measurement that exceeds significance. Recently the LHCb [7] and CDF [8] Collaborations have reported evidence of violation () in the difference of the integrated asymmetries in the and channels. This result was unexpected at the current experimental precision, and it may be a manifestation of New Physics (NP), although a Standard Model (SM) explanation cannot be ruled out. These measurements have renewed the interest of the community in charm physics as a sector in which to search for NP manifestations.
Under the hypothesis of conservation the two mass eigenstates ( and ) can be written in terms of the flavor eigenstates ( and ) as:
| (1) |
If , then in the case of no , is the -even state and the -odd state. The parameters that describe oscillations are proportional to the difference of masses () and widths () of the mass eigenstates:
| (2) |
where is the average width. Mixing will occur if the mass eigenstates differ from the flavour eigenstates, that is, if either or is non-zero. SM predictions for the mixing parameter values are at the order of a percent or less and, at present, experimental measurements are in agreement with these predictions. Unfortunately the theoretical predictions are affected by large computational uncertainties on the dominant long-range-diagram contributions, preventing these measurements from being strong tests of the SM.
In the following we present a measurement of the mixing parameter [9] and the -violating parameter , defined as:
| (3) |
where () is the average width of the () when reconstructed in -even eigenstates.
The measured values of and constrain the parameters that govern mixing and in the charm sector. Neglecting the effect of direct violation, estimated to be at least one order of magnitude below our current sensitivity, we relate and to the mixing and -violating parameters as follows:
| (4) |
The asymmetry measures violation in mixing, while is sensitive to in the interference between decays with and without mixing, being the weak phase of the quantity with the amplitude for the decay . In principle, can depend also on the final state, but with our current level of precision we are not sensitive to this [10]. In the absence of violation and .
2 Data Sample and Backgrounds
We reconstruct the in the () and final states and measure three lifetimes:
-
•
for the decays,
-
•
for the decays,
-
•
for the (and ) decays (the Cabibbo favored and the doubly Cabibbo suppressed decays are collected in the same sample).
Due to the small mixing rate () we can neglect the effect of mixing and assume that all signal proper time distributions are exponential. The untagged sample [11] is assumed to contain 50% of and 50% of decays. The three values of inverse lifetime are used to compute and : is used to access the average width while, () is used to obtain ().
We use tagged decays of the coming from decays, through , as well as untagged decays coming directly from the hadronization of the charm quark. The tagged and untagged samples are independent, i.e. an event containing a tagged candidate and at least one untagged candidate is excluded from the untagged sample. In the tagged sample the flavour of the is determined by the charge of the pion that is also emitted. Due to the significantly higher level of background in the final state, we do not use the related untagged sample.
We analyze of data recorded by the BABAR detector [12] at, and slightly below, the resonance at the asymmetric-energy PEP-II -Factory . To avoid potential bias, we finalize our data selection criteria, as well as the procedures for fitting, extracting statistical limits, and determining systematic uncertainties, prior to examining the results.
An oppositely charged pair of or candidates satisfying particle identification criteria is fit to a common vertex to form a candidate. We require each to have momentum in the center-of-mass (CM) frame in order to remove almost completely ’s coming from -meson decays. For the tagged modes, we form the candidate by fitting a candidate and a charged pion track to a common vertex, which is required to lie within the interaction region. The momentum is required to be greater than 0.1 in the laboratory frame and less than 0.45 in the CM frame. We veto any candidate that may have originated from a reconstructed photon conversion or Dalitz decay and reject a positron that fakes a candidate by using energy loss information. We also select tagged candidates in a window, , where is the difference between the reconstructed and masses. This requirement strongly suppresses backgrounds.
The proper time and proper time error of each candidate are determined from a combined fit to the production and decay vertices. The probability of the vertex fit must satisfy . We retain only candidates with and . For tagged decays, this fit does not incorporate any information in order to ensure that the lifetime resolution models for tagged and untagged signal decays are very similar. The most probable value of for signal events is of the nominal lifetime [14].
For cases where multiple candidates in an event share one or more tracks and the decays to the same final state ( and are considered to be the same final state in this context), we retain only the candidate with the highest . If an event contains a tagged decay, all untagged candidates from that event are excluded from the final sample. In an event with no candidate and multiple candidates decaying to the same final state, we retain only the candidate with the highest . The fraction of events with multiple candidates with overlapping daughter tracks is for all final states.
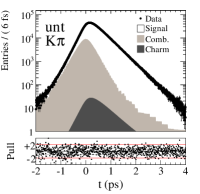
In Fig. 1 we show the reconstructed invariant mass distributions for the selected candidates in both tagged and untagged modes. We fit the mass distributions in order to extract the total number of background candidates. In Fig. 1 we also report the fit results and, below each plot, show the normalized Poisson pulls [13]. For the tagged CP-even modes, the and samples are fit simultaneously, sharing all parameters except for the expected signal and background candidate yields.
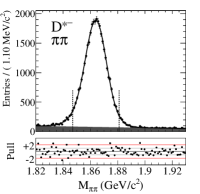
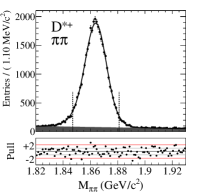

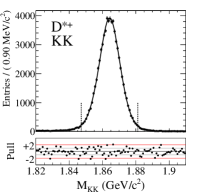
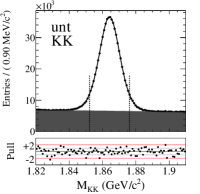
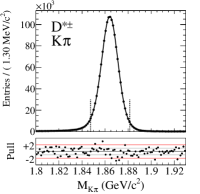
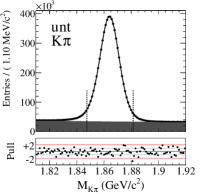
We perform a mode-dependent, data-driven optimization of the invariant mass window position and width, in order to reduce significantly the effects of the linear correlation between the reconstructed mass and the reconstructed proper time. The signal regions obtained for each mode are shown in Fig. 1 with dashed lines. These are wide for all modes except untagged . In this mode the signal region width is reduced to due to the higher level of background, as observed in the corresponding plot. We define a lower- and a higher-mass sideband each of width ; these are used to study and characterize the combinatorial background. The mass sidebands for the untagged modes are from the signal region center. In case of the tagged modes, the distance of the sidebands from the signal region center is , and the window is shifted to higher values, . In the sidebands the tagged and untagged samples are not independent.
After the selection we divide the backgrounds into two categories. Candidates for which the common ancestor of the products is a long-living charmed meson are collected in the misreconstructed-charm background category. In Table 1 we report the composition of this background in the signal region, obtained by studying simulated events. The other background candidates, consisting mainly of random tracks, fall into the combinatorial background category. In Table 2 we report the number of signal and background candidates after selection, for the signal region.
| Mode | Tagged Modes | Untagged Modes | |||
| 15.4 | 10.3 | 29.9 | 7.2 | ||
| 80.8 | 14.9 | 57.1 | 8.8 | 35.8 | |
| 1.1 | 70.3 | 1.7 | 63.3 | 6.9 | |
| 2.9 | 11.8 | ||||
| 1.3 | 3.5 | ||||
| 1.8 | 2.2 | 3.1 | |||
| 7.0 | 17.3 | ||||
| decays | 4.9 | 2.6 | |||
| Signal | Combinatorial Bkgd. | Charm Bkgd. | |
|---|---|---|---|
| Tagged | 97 | ||
| Tagged | 309 | ||
| Tagged | 642 | ||
| Untagged | |||
| Untagged |
3 Lifetime Fit
In order to extract the three lifetime values we perform an extended unbinned-maximum-likelihood fit to the 2-dimensional distribution of proper time and proper time error. All modes are fit simultaneously: the signal resolution function parameters are shared among the modes, while the background Probability Density Function (PDF) parameters are not.
The single-mode PDF for the signal events consists of an exponential convolved with a resolution function. The latter is the sum of three Gaussian functions with a common mean (offset) and widths proportional to the per-event proper time error, scaled with three different factors (one for each Gaussian). In order to take into account differences in the reconstruction due to the different final states, we multiply each Gaussian scale factor by another scale factor that depends on the final state (the factor is fixed to 1). In the same way we introduce a third scale factor that depends whether the mode is tagged or untagged, fixing to unity the one for the untagged modes. For the tagged -even modes we also take into account the wrongly-tagged signal candidates, fixing the fraction of these events to the value 0.2%, obtained from the simulated events. Since the proper time PDF depends on the proper time error, we multiply each signal PDF by the 1-dimensional binned distribution of to avoid biases. The normalization of the proper time PDF is computed for each . The histogram for the signal events is obtained from the distribution of the events in the signal region after subtraction of the misreconstructed-charm and combinatorial-background contributions.
The 2-dimensional PDF for the misreconstructed-charm background is a signal-like PDF, fitted to the simulated events and then fixed in the final fit. Since this is a physical background, its lifetime, composition and number of events change with the mass window. Therefore we have decided not to use the sidebands to characterize it.
The combinatorial PDF is determined as a weighted average of the PDFs in the two mass sidebands, which consist of 2-dimensional histograms. For the untagged mode the sideband PDFs for this category are signal-like. Contributions of signal and misreconstructed-charm in the sidebands are parameterized using the simulated events, and then fixed. The weighting parameter is determined from simulated events and then is varied as part of the systematic studies.
The expected total-background candidate yields are evaluated from the mass fit and then corrected using the simulated-event information. The misreconstructed-charm contribution is estimated from the simulated events, and the combinatorial one is obtained by subtraction. In the final fit the background yields of the two categories are fixed for all modes except for the combinatorial untagged mode, where it is allowed to float. This became necessary since the prediction of the mass fit was not accurate enough for this mode, where the combinatorial background represents almost 25% of the events in the signal region.
4 Analysis Validation and Systematics
The validation of the procedure has been performed on four independent samples of simulated events, each equivalent to data integrated luminosity, and also on a large ensemble of pure Toy MC samples. We have also performed a qualitative validation on data by running the fit in different configurations. For example, we have fitted the tagged and untagged samples separately, finding the and tagged and untagged extracted lifetimes compatible within the statistical uncertainties. We let the and samples have different lifetimes, allowing for physical effects depending on the final states (direct and the dependence of on the final state), and found and to be compatible for the two modes.
In addition to these tests, we have also identified sources of systematic error and have evaluated their contributions, as reported in Table 3. We have evaluated the systematic effects due to the choice of the signal region by varying its position and width. We have varied the fraction of mistagged events in the tagged modes, and the fraction of ’s in the untagged mode. The proper time error PDF is obtained by subtraction of the background distributions. However, in the untagged mode, the combinatorial yields are extracted from the lifetime fit and not known a priori. In the nominal fit we first estimate the number of combinatorial events as for the other modes, and use this to perform a first simultaneous fit. We then repeat the fit using the yields just extracted, and this fit yields the nominal results. In order to evaluate the systematic error associated with this procedure we repeat the fit a third time, and take as a systematic error estimate the difference from the nominal value. We have varied the misreconstructed-charm lifetimes and yields, estimated using the simulated events, by .
The combinatorial PDF is extracted from the sidebands after fixing the signal and misreconstructed-charm contributions. We have applied the variations described above for the misreconstructed-charm events in the signal region also in the sidebands, for both the signal and the charm-background contributions, and re-extracted the combinatorial PDF. We have also varied the number of combinatorial-background events in the signal region for the modes in which it was fixed, and the weighting parameter for each mode.
We have varied the selection criteria, in particular that on by . We have also estimated the systematic impact of the best candidate selection by removing or keeping all the overlapping candidates. We have estimated the effects of SVT misalignment and have found these to be negligible.
| Fit Variation | (%) | (%) |
|---|---|---|
| mass window width | 0.057 | 0.022 |
| mass window position | 0.005 | 0.001 |
| untagged signal PDF | 0.022 | 0.000 |
| mistag fraction | 0.000 | 0.000 |
| untagged fraction | 0.001 | 0.000 |
| charm bkgd. yields | 0.016 | 0.000 |
| charm bkgd. lifetimes | 0.042 | 0.001 |
| comb. yields | 0.043 | 0.002 |
| comb. sideband weights | 0.004 | 0.001 |
| comb. PDF shape | 0.066 | 0.000 |
| selection | 0.052 | 0.053 |
| candidate selection | 0.028 | 0.011 |
| Total | 0.124 | 0.058 |
5 Results and Conclusions
The seven projections of the lifetime fit are reported in Fig. 2.
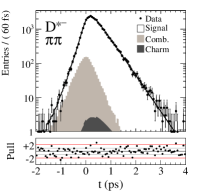
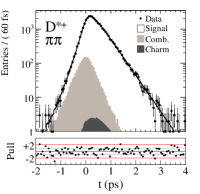
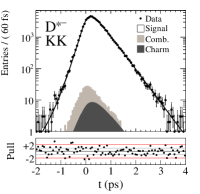
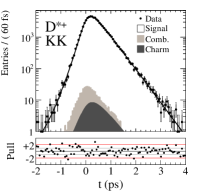
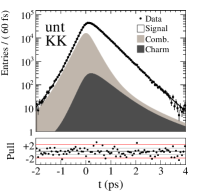
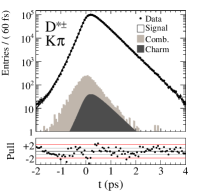
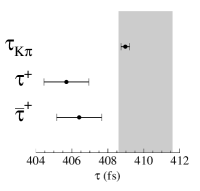
The following lifetime values are extracted:
| (5) |
The lifetimes are reported with the statistical error only. The lifetime is compatible within one standard deviation with the PDG lifetime [14] and the CP-even lifetimes are significantly lower, as shown in the bottom-right plot of Fig. 2. Combining the values of inverse lifetime following Eq. (3), we obtain:
| (6) |
The first error is statistical, obtained from the covariance matrix resulting from the fit, and the second error is systematic. This measurement represents the most precise measurement of , and excludes the no-mixing hypothesis at significance. The value of presented here is compatible with all previous measurements. In particular it is compatible with the previous BABAR measurement [3] with a probability of , taking into account that of the events in the current sample are also present in the samples used in the previous measurements [2, 3], and that the systematic errors are fully correlated. This result favors a lower value for , and approaches the value of the mixing parameter when measured directly [15], as expected if is conserved. We find no evidence of .
In conclusion, we report evidence of mixing with significance, obtaining the mixing parameter value . We find no evidence of violation, and measure the -violating parameter value .
ACKNOWLEDGEMENTS
We are grateful for the excellent luminosity and machine conditions provided by our PEP-II colleagues, and for the substantial dedicated effort from the computing organizations that support BABAR. The collaborating institutions wish to thank SLAC for its support and kind hospitality. This work is supported by DOE and NSF (USA), NSERC (Canada), CEA and CNRS-IN2P3 (France), BMBF and DFG (Germany), INFN (Italy), FOM (The Netherlands), NFR (Norway), MES (Russia), MICIIN (Spain), STFC (United Kingdom). Individuals have received support from the Marie Curie EIF (European Union) and the A. P. Sloan Foundation (USA).
References
- [1] B. Aubert et al. (BABAR Collaboration), Phys. Rev. Lett. 98, 211802 (2007).
- [2] B. Aubert et al. (BABAR Collaboration), Phys. Rev. D 78, 011105 (2008).
- [3] B. Aubert et al. (BABAR Collaboration), Phys. Rev. D 80, 071103 (2009).
- [4] M. Staric et al. (Belle Collaboration), Phys. Rev. Lett. 98, 211803 (2007).
- [5] K. Abe et al. (Belle Collaboration), Phys. Rev. Lett. 99, 131803 (2007).
- [6] T. Aaltonen et al. (CDF Collaboration), Phys. Rev. Lett. 100, 121802 (2008).
- [7] R. Aaij et al. (LHCb Collaboration), Phys. Rev. Lett. 108, 111602 (2012).
- [8] T. Aaltonen et al. [CDF Collaboration], arXiv:1207.2158 [hep-ex].
- [9] T. -h. (T. )Liu, In *Batavia 1994, The future of high-sensitivity charm experiments* 375-394 [hep-ph/9408330].
- [10] A. L. Kagan and M. D. Sokoloff, Phys. Rev. D 80, 076008 (2009)
- [11] Charge conjugation is implied throughout.
- [12] B. Aubert et al. (BABAR Collaboration), Nucl. Instrum. Meth. A 479, 1 (2002).
- [13] S. Baker and R. D. Cousins, Nucl. Instrum. Meth. 221, 437 (1984).
- [14] K. Nakamura et al. (Particle Data Group), J. Phys. G 37, 075021 (2010).
- [15] D. Asner et al. (HFAG Collaboration), arXiv:1010.1589 [hep-ex].