AGE AND MASS STUDIES FOR YOUNG STAR CLUSTERS IN M31 FROM SEDS-FIT
Abstract
In this paper, we present photometry for young star clusters in M31, which are selected from Caldwell et al. These star clusters have been observed as part of the Beijing–Arizona–Taiwan–Connecticut (BATC) Multicolor Sky Survey from 1995 February to 2008 March. The BATC images including these star clusters are taken with 15 intermediate-band filters covering 3000–10000 Å. Combined with photometry in the GALEX far- and near-ultraviolet, broad-band , SDSS , and infrared of Two Micron All Sky Survey, we obtain their accurate spectral energy distributions (SEDs) from Å. We derive these star clusters’ ages and masses by comparing their SEDs with stellar population synthesis models. Our results are in good agreement with previous determinations. The mean value of age and mass of young clusters ( Gyr) is about 385 Myr and , respectively. There are two distinct peaks in the age distribution, a highest peak at age 60 Myr and a secondary peak around 250 Myr, while the mass distribution shows a single peak around . A few young star clusters have two-body relaxation times greater than their ages, indicating that those clusters have not been well dynamically relaxed and therefore have not established the thermal equilibrium. There are several regions showing aggregations of young star clusters around the 10 kpc ring and the outer ring, indicating that the distribution of the young star clusters is well correlated with M31’s star-forming regions. The young massive star clusters (age Myr and mass ) show apparent concentration around the ring splitting region, suggesting a recent passage of a satellite galaxy (M32) through M31 disk.
Subject headings:
galaxies: individual (M31) – galaxies: young star clusters – galaxies: stellar content1. INTRODUCTION
Star clusters are considered as important tracers for understanding the formation and evolution of their host galaxies (San et al., 2010). Star cluster systems have been traditionally separated into two populations–globular clusters and open clusters (GCs and OCs)–on their ages, masses, metallicities, and positions. However, more recent studies have discovered that the distinction between GCs and OCs becomes increasingly blurred (see Perina et al., 2010, for details).
Gascoigne & Kron (1952) listed photometric colors and magnitudes for star clusters in Magellanic Clouds (MCs) and the Fornax dwarf system and divided them into two groups. They found that star clusters in blue group have central condensation properties similar to those of the red group, which were considered as GCs, however they could not be identified with the Galactic OCs. Hodge (1961) termed 23 clusters in the Large Magellanic Cloud (LMC)–differing from GCs in their relative youth and OCs in their richness and shape–as “young populous clusters”, which were called “young massive clusters” (YMCs) or “blue luminous compact clusters” (BLCCs) by Fusi Pecci et al. (2005). Actually, the blue integrated colors for a cluster may be influenced by several factors , such as poor metallicity (the luminosity of the horizontal branch), young age (the position of the main-sequence turnoff stars), and some exotic stellar populations (e.g., blue stragglers, Wolf-Rayet stars). However, several studies (e.g., Williams & Hodge, 2001; Beasley et al., 2004) have reached similar conclusions that the exceedingly blue colors of BLCCs are a direct consequence of their young ages (see Fusi Pecci et al., 2005, for details).
M31 is the largest galaxy in the Local Group, and has a large number of star clusters, including young clusters having been studied by many authors. Bohlin et al. (1988, 1993) listed 11 objects in M31 classified as blue clusters using the UV colors, most of which have been proved to be young clusters (Fusi Pecci et al., 2005; Caldwell et al., 2009; Perina et al., 2009, 2010), except for B133 and B145, which were stated as a star and an old GC (Caldwell et al., 2009), respectively. Caldwell et al. (2009, 2011) derived ages and masses for a large sample of young clusters, and found that these star clusters are less than 2 Gyr old, and most of them have ages between and yr and masses ranging from to . These authors also stated that the young star clusters in M31 show a range of structures, most of which have low concentrations typical of OCs in the Milky Way (MW), however, there are a few with high concentrations similar to the MW GCs. Vansevičius et al. (2009) carried out a survey of compact star clusters in the southwest part of M31, and suggested a rich intermediate-mass star cluster population in M31, with a typical age range of 30 Myr 3 Gyr, peaking at 70 Myr. In order to ascertain the properties of the BLCCs, Perina et al. (2009, 2010) performed an image survey for 20 BLCCs lying in the disk of M31 using the Wide Field and Planetary Camera-2 (WFPC2) on the Hubble Space Telescope (HST). In addition, another key aim of this HST survey was to determine the fraction of contamination of BLCCs by asterisms, since Cohen et al. (2005) suggested that a large fraction of the putative BLCCs may in fact be just asterisms. Cohen et al. (2005) presented the resulting images of six very young or young star clusters in M31 observed with the Keck laser guide star adaptive optics system, and indicated that the four youngest out of these six objects are asterisms. However, Caldwell et al. (2009) presented a conclusion that these four objects are true clusters based on spectra. The HST images (Perina et al., 2009, 2010) showed that nineteen of the twenty surveyed candidates are real star clusters, and one (NB67) is a bright star. Barmby et al. (2009) measured surface brightness profiles for 23 bright young star clusters using images from the WFPC2, including the sample clusters of Perina et al. (2009, 2010), and derived the structural properties by fitting the surface brightness profiles to several structural models. The authors stated that the sample young clusters are expected to dissolve within a few Gyr and will not survive to become old GCs, and that young star clusters in M31 and MCs follow the same fundamental plane relations as old GCs of M31, MCs, the MW and NGC 5128, regardless of their host galaxy environments. Johnson et al. (2012) presented a M31 stellar cluster catalog utilizing the Panchromatic Hubble Andromeda Treasury survey data, which will cover of M31 disk with multiple filters and allow the identification of thousands of star clusters.
The large population of young star clusters reflect a high efficiency of cluster formation, possibly triggered by a current interaction event between M31 and its satellite galaxy (Gordon et al., 2006; Block et al., 2006), suggesting that young star clusters should be associated with the star-forming (SF) regions of M31. Fan et al. (2010) found that young clusters ( 2 Gyr) are spatially coincident with M31’s disk, including the 10 kpc ring and the outer ring (Gordon et al., 2006). Although these authors also found the young star clusters in the halo of M31, all of the clusters outside of the optical disk of M31 are old, globular clusters (see Perina et al., 2011, for details). Kang et al. (2012) stated that most of young star clusters’ kinematics have the thin, rotating disk component (see also Rey et al., 2007). The young star clusters’ distribution has a distinct peak around kpc from the center in M31 disk, and some young star clusters show concentration around the 10 kpc ring splitting regions near M32 and most of them have systematically younger ages ( Myr). Kang et al. (2012) also stated that the young star clusters show a spatial distribution similar to OB stars, UV SF regions, and dust, all of which are important tracers of disk structures.
Several criteria were developed for selecting young clusters from the integrated spectrum and colors. Fusi Pecci et al. (2005) comprehensively studied the properties of 67 very blue and likely YMCs in M31 selected according to their color and/or the strength of spectral index ( Å). Peacock et al. (2010) presented a catalog of M31 GCs based on images from the SDSS and the Wide Field CAMera on the United Kingdom Infrared Telescope and selected a population of young clusters with a definition of . Kang et al. (2012) published a catalog of M31 young clusters ( Gyr) and supported the selection criteria and (Bohlin et al., 1993; Rey et al., 2007). These criterions may play important roles in distinguishing young from old clusters for those whose ages cannot be derived accurately.
The formation and disruption of young star clusters represent a latter-day example of the hierarchical formation of galaxies (Fall, 2004). Motivated by that, we decided to describe some basic properties of young star clusters in M31, such as positions, distributions of ages and masses, correlations of the ages and masses with structure parameters, which may provide important information about the processes involved in their formation and disruption.
In this paper, we will provide photometry of a set of young star clusters in M31 using images obtained with the Beijing–Arizona–Taiwan–Connecticut (BATC) Multicolor Sky Survey Telescope. By comparing the observed SEDs with the galev simple stellar population (SSP) models, we derive their ages and masses. This paper is organized as follows. In Section 2 we present the BATC observations of the sample clusters, the relevant data-processing steps, and the GALEX (FUV and NUV), optical broad-band, SDSS and 2MASS NIR data that are subsequently used in our analysis. In Section 3 we derive ages and masses of the sample clusters. A discussion on the sample young clusters ( 2 Gyr) will be given in Section 4. Finally, we will summarize our results in Section 5.
2. SAMPLE OF STAR CLUSTERS, OBSERVATIONS, AND DATA REDUCTION
2.1. Sample of Star Clusters
The sample of star clusters in this paper is selected from Caldwell et al. (2009, 2011), who presented a series of studies of M31 young and old clusters, respectively. We selected 178 young clusters given in Caldwell et al. (2009, 2011), and fortunately, all the young clusters have been observed with 15 intermediate-band filters of the BATC photometric system. However, there are 42 clusters for which we cannot obtain accurate photometric measurements with different reasons as following, a) some clusters have one or more nearby very bright objects; b) some clusters are very close to other objects; c) some clusters are very faint and the signal-to-noise ratio (SNR) is low; d) some clusters are superimposed onto a bright background; e) some clusters are superimposed onto a strongly variable background. In addition, There are several remarkable clusters with “adhered” (Vansevičius et al., 2009) objects in our images, such as M088 and its neighbor M089, and G099 and C037-G099x (see also Narbutis et al., 2008). In a previous paper, Ma et al. (2011) presented the SEDs in 15 intermediate-band filters of the BATC photometric system for one YMC VDB0-B195D and determined its age and mass by comparing its SEDs with the theoretical evolutionary population synthesis models. Thus, here we will analyze the multicolor photometric properties of the remaining 135 clusters.
2.2. Archival Images of the BATC Sky Survey for M31 Field
The M31 field is part of a galaxy calibration program of BATC Multicolor Sky Survey. The BATC program uses the 60/90 cm Schmidt Telescope at the Xinglong Station of the National Astronomical Observatories, Chinese Academy of Sciences (NAOC). This system includes 15 intermediate-band filters, covering a range of wavelength from 3000 to 10000 Å (see Fan et al., 1996, for details). Before February 2006, a Ford Aerospace thick CCD camera was applied, which has a pixel size of 15 and a field of view of , resulting in a resolution of . After February 2006, a new CCD with a pixel size of 12 m was used, with a resolution of pixel-1 (Fan et al., 2009). We obtained 143.9 hours of imaging of the M31 field covering about 6 square degrees, consisting of 447 images, through the set of 15 filters in five observing runs from 1995 to 2008, spanning 13 years (see Fan et al., 2009; Wang et al., 2010, for details).
Figure 1 shows the spatial distribution of the sample clusters and the M31 fields observed with the BATC multicolor system, in which a box only indicates a field view of of the thick CCD camera. All the sample star clusters are indicated with black dots, with high-accuracy coordinates from Caldwell et al. (2009, 2011), which are based on the images from the Local Group Galaxies Survey (Massey, 2006) and the Digitized Sky Survey.

2.3. Integrated Photometry of the Sample Star Clusters
We processed all the CCD images to apply standard procedures including bias subtraction and flat-fielding using an automatic data reduction software named PIPELINE I, developed for the BATC Multicolor Sky Survey of the CCD images. BATC magnitudes are defined and obtained in a similar way as for the spectrophotometric AB magnitude system (Ma et al., 2009b). In order to improve the image quality, multiple images of the same filter were combined to one, on which the magnitudes of the sample star clusters were determined. The absolute flux of the combined images in the central field of M31 (M31-1 in Figure 1) was calibrated using observations of standard stars, while the absolute flux of the combined images of the M31-2 to M31-7 fields was calibrated based on secondary standard transformations using the M31-1 field (see Fan et al., 2009, for details).
We performed standard aperture photometry of our sample objects using the PHOT routine in DAOPHOT (Stetson, 1987). To ensure that we adopted the most appropriate photometric radius that included all light from the objects, we used 9 different aperture sizes (with radii of pixels for the old CCD, while for the new CCD, the radii were given with pixels corresponding to the same arcsecs on the old CCD) to determine the magnitude. We also checked the aperture radii carefully on the images by visual examination in order not to include the light from extraneous objects. The local sky background was measured in an annulus with an inner radius of pixel and a width of 4.0 pixels for the old CCD, and with an inner radius of pixel and a width of 5.0 pixels for the new CCD, respectively.
There are 40 clusters in this paper which are in common with our series of previous papers (Jiang et al., 2003; Ma et al., 2006, 2009b; Fan et al., 2009; Wang et al., 2010), and the photometric data of these 40 clusters were also derived by these studies. We found that most photometric data obtained here are in good agreement with those obtained by previous studies. We checked the images of those clusters with photometric discrepancy, and found most of them were loaded near the bulge (B091) or in some disk regions with bright or variable background (e.g., B210, M020, M023). The different choice of the aperture for photometry and the annulus for background caused the discrepancy.
The SEDs for the sample clusters in M31 are listed in Table 1. Columns (1) gives the cluster names. Columns (2) to (16) present the magnitudes in the 15 BATC passbands. The magnitude uncertainties from DAOPHOT are listed for each object on the second line for the corresponding passbands. For some objects, the magnitudes in some filters could not be obtained because of low SNR. We should remind that magnitudes with an uncertainty larger than 0.3 will not be used in the following analysis, although they are listed in Table 1. Columns (17) is the photometric aperture adopted in this paper.
2.4. GALEX UV, Optical Broad-band, SDSS, and 2MASS NIR Photometry
As our series of papers has pointed out, accurate and numerous photometric points can derive accurate ages of star clusters (de Grijs et al., 2003; Anders et al., 2004). Kaviraj et al. (2007) stated that the UV photometry is powerful for age estimation of young stellar populations, and the combination of UV photometry with optical observations enables one to break the age-metallicity degeneracy. de Jong (1996) and Anders et al. (2004) showed that the age-metallicity degeneracy can be partially broken by adding NIR photometry to optical colors (see Ma et al., 2009b, and references therein). Several previous studies (Barmby et al., 2000; Galleti et al., 2004; Rey et al., 2007; Peacock et al., 2010; Kang et al., 2012) have provided magnitudes for star clusters in different passbands, which will be used to estimate ages of sample star clusters in this paper.
The latest Revised Bologna Catalogue of M31 GCs and candidates (hereafter RBC v.4) (Galleti et al., 2004, 2006, 2007, 2009) includes GALEX (FUV and NUV) fluxes from Rey et al. (2007), optical broad-band, 2MASS NIR magnitudes for 2045 objects. For magnitudes given in RBC v.4, the relevant photometric uncertainties are not listed. Therefore, we adopted the original measurements of Barmby et al. (2000) as our preferred reference, including their published photometric errors. For the remaining objects, the magnitudes from RBC v.4 were adopted, with the photometric uncertainties set following Galleti et al. (2004), i.e., mag in and mag in (Ma et al., 2009b).
In RBC v.4, the 2MASS magnitudes were transformed to CIT photometric system (Galleti et al., 2004). However, we needed the original 2MASS data to compare the observed SEDs with the SSP models, so we reversed the transformation using the equations given by Carpenter (2001). There were no magnitude errors for bands in RBC v.4, and we obtained them by comparing the photometric data with Figure 2 of Carpenter (2001), in which the photometric error was shown as a function of magnitude for stars brighter than their observational completeness limits (Ma et al., 2009b; Wang et al., 2010). In addition, since RBC v.4 provided magnitudes only for a small number of sample star clusters, we adopted magnitudes from the 2MASS-6X-PSC catalog, with 6 times the normal exposure of 7.2 s on most fields of M31 (Nantais et al., 2006). There are 3 kinds of magnitudes given by 2MASS-6X-PSC catalog, the “default” magnitude, the aperture and aperture magnitudes. We found that the aperture magnitudes agree well with the magnitudes in RBC v.4, while the other 2 kinds of magnitudes have large discrepancy with magnitudes in RBC v.4. However, for the aperture magnitudes, when magnitudes are fainter than mag, the dispersions are considerable. In this paper, we preferentially adopted 2MASS magnitudes in RBC v.4. For the remaining star clusters, we adopted the aperture magnitudes in the 2MASS-6X-PSC catalog when the magnitudes brighter than mag.
Peacock et al. (2010) performed SDSS photometry for 1595 M31 clusters and cluster candidates using the program SExtractor on drift scan images of M31 obtained by the SDSS 2.5-m telescope, which are on the AB photometric system (see Bertin & Arnouts, 1996, for details). We found that there was a magnitude offset () between SDSS and for 35 objects by transforming between the and bands following the transformations from Jester et al. (2005). Because the SDSS magnitudes provided a more homogeneous set of photometric measurements, we adopted the SDSS magnitudes and abandoned magnitudes for these objects in the following analysis. These 35 objects are flagged with small “a” in Column 1 of Table 2.
Kang et al. (2012) presented a catalog of 700 confirmed star clusters in M31, providing the most extensive and updated UV integrated photometry on the AB photometric system based on GALEX imaging, superseding the UV photometry published by Rey et al. (2007), which were included by RBC v.4. Therefore, we used the magnitudes of the FUV and NUV from Kang et al. (2012) as the UV photometry in our following SED fitting process.
We listed the GALEX, optical broad-band, SDSS , and 2MASS NIR photometry of the sample clusters in Table 2 (Columns 2 to 16), where the photometric errors are listed for each object on the second line for the corresponding passbands. As we discussed above, the magnitudes with an uncertainty larger than 0.3 will not be used in the following analysis.
2.5. Comparison with Previously Published Photometry
To check our photometry, we transformed the BATC intermediate-band system to the broad-band system using the relationships between these two systems derived by Zhou et al. (2003):
| (1) |
| (2) |
-band photometry can be derived from the BATC , and bands, while -band magnitude can be obtained from the BATC , and bands. Figure 2 shows a comparison of the and photometry of our M31 sample objects with previous measurements from Barmby et al. (2000) (circles) and Galleti et al. (2004) (triangles).
There are several objects with larger offsets (), shown with black solid marks in Figure 2 (M045 in the top panel; B200D, SK036A, and SK068A in the bottom panel). The SNRs of M045, B200D, and SK036A are low, and SK068A is superimposed onto a bright background, thus we cannot derive accurate photometries for these four star clusters.
The mean and magnitude differences–in the sense of this paper minus others–are mag and , i.e., there is no system offset between our magnitudes and previous determinations.

2.6. Reddening Values
We required independently determined reddening values to estimate ages of the sample clusters robustly and accurately. Here we used Kang et al. (2012) and Caldwell et al. (2009) as our reference. Kang et al. (2012) derived reddening values from three ways: 1) mean reddening values from available literature (Barmby et al., 2000; Fan et al., 2008; Caldwell et al., 2009, 2011); 2) median reddening values of star clusters located within an annulus at each 2 kpc radius from the center of M31, for these star clusters there were no available reddening values in the literature; 3) for star clusters at distances larger than 22 kpc from the center of M31, the foreground reddening value of was adopted. Because all of our sample clusters have a projected galactocentric radius smaller than 22 kpc, the reddening values for them were derived from the first two methods. The reddening value of cluster LGS04131.1_404612 was not given by Kang et al. (2012), so we adopted the value from Caldwell et al. (2009). Its reddening uncertainty was simply adopted half of the reddening value, i.e., . We noticed that, for star cluster B449, the reddening value determined by Kang et al. (2012) is very different with the value determined by Caldwell et al. (2011) (). We treated both age and reddening value as free parameters, and determined the reddening value to be which was in good agreement with Caldwell et al. (2011). So, in this paper ,we adopted in Caldwell et al. (2011). The reddening uncertainty for B449 was adopted to be 0.07. Column 4 of Table 4 lists the reddening values adopted for the sample clusters, while Column 5 lists the methods for deriving the reddening values ( and indicate that the reddening values were obtained by the first and second method in Kang et al. 2012, respectively; indicates that the reddening values were from Caldwell et al. 2009, 2011, only for LGS04131.1_404612 and B449).
3. AGE AND MASS DETERMINATION
3.1. Stellar Populations and Synthetic Photometry
In order to determine the ages and masses of the sample star clusters, we compared their SEDs with theoretical stellar population synthesis (SPS) models. The SSP models of galev (e.g., Kurth et al., 1999; Schulz et al., 2002; Anders & Fritze-v. Alvensleben, 2003) were adopted (Ma et al., 2009b; Wang et al., 2010) in this paper, which are based on the Padova isochrones (with the most recent versions using the updated Bertelli 1994 isochrones, including the thermally-pulsing asymptotic giant-branch [TP-AGB] phase), and a Salpeter (1955) stellar initial mass function (IMF) with a lower-mass limit of and the upper-mass limit between 50 and 70 depending on metallicity. The full set of models span the wavelength range from 91 Å to 160 m. These models cover ages from to yr, with an age resolution of 4 Myr for ages up to 2.35 Gyr, and 20 Myr for greater ages. The galev SSP models include five initial metallicities, (solar metallicity), and 0.05.
Since our observational data were integrated luminosities through our set of filters, we convolved the galev SSP SEDs with the GALEX FUV and NUV, broad-band , SDSS , BATC, and 2MASS filter response curves to obtain synthetic ultraviolet, optical, and NIR photometry for comparison. The synthetic filter magnitude in the AB magnitude system can be computed as
| (3) |
where is the theoretical SED and is the response curve of the filter of the corresponding photometric systems. Here, varies with age and metallicity.
3.2. Fits
We used a minimization test to determine which galev SSP models are most compatible with the observed SEDs, following
| (4) |
where is the integrated magnitude in the filter of a theoretical SSP at metallicity and age , is the number of the filters used for fitting, represents the intrinsic integrated magnitude in the same filter and
| (5) |
Here, is the observational uncertainty, and is the uncertainty associated with the model itself, for the filter. Charlot et al. (1996) estimated the uncertainty associated with the term by comparing the colors obtained from different stellar evolutionary tracks and spectral libraries. Following Ma et al. (2007, 2009a, 2009b, 2011, 2012) and Wang et al. (2010), we adopted mag in this paper. is the uncertainty in the reddening value, and , where is taken from Cardelli et al. (1989), , and is the uncertainty of the distance modulus, which is always 0.07 from mag (McConnachie et al., 2005).
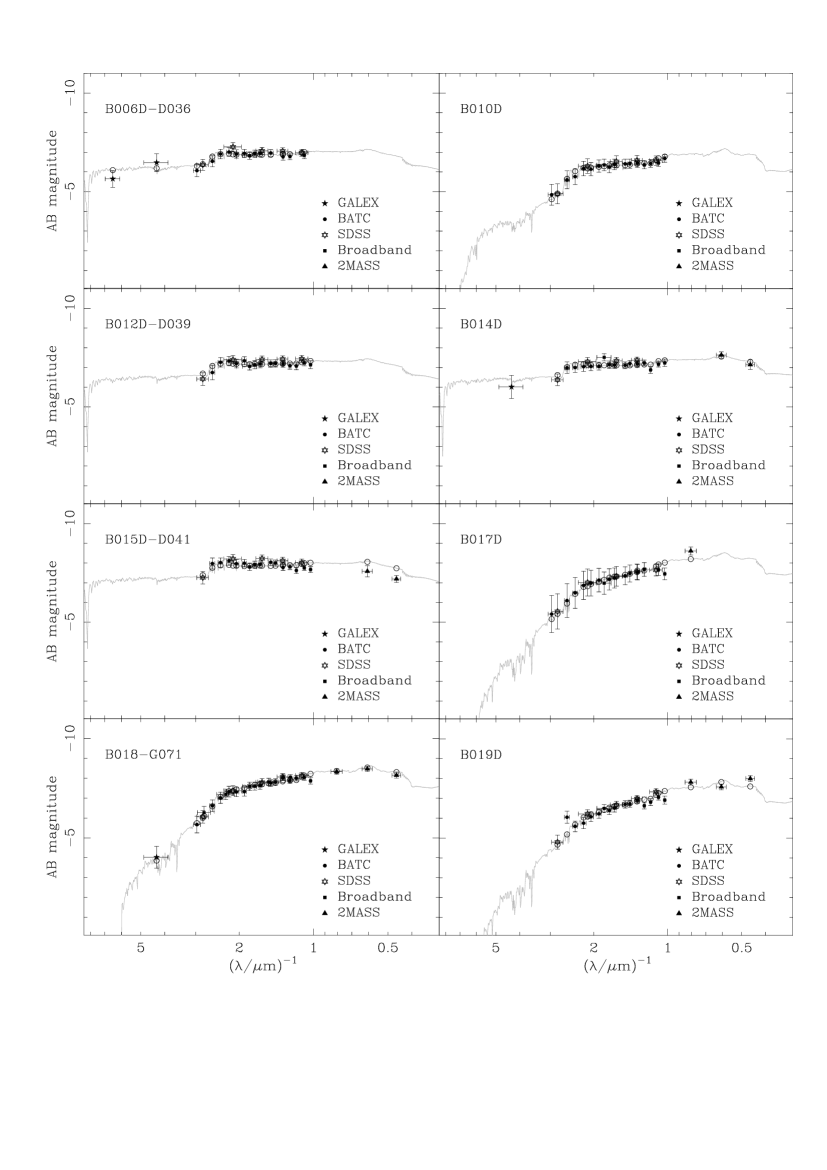
Perina et al. (2009, 2010) determined ages for 20 possible YMCs in M31 with metallicity as a free parameter of their fit. Their results showed that most YMCs in M31 were best fitted with solar metallicity model. Caldwell et al. (2009) claimed that it seemed likely the young star clusters have supersolar abundances. In this paper, the galev models of solar metallicity () were used to fit the intrinsic SEDs for all the sample clusters here. As an example, we presented the fitting for some sample clusters in Figure 3. During the fitting, we found that, for a small number of clusters, some photometric data cannot be fitted with any SSP models. We therefore did not use these deviating photometric data points to obtain the best fits. These deviating photometric data points are the magnitude of M070, magnitude of M040, magnitude of V133, magnitude of M082 and M101, and magnitudes of B195, magnitude of B118D, and and magnitudes of M091. We also noticed that, for some star clusters (B091, B305, B319, B392, B458, B480, B484, and DAO69), the photometries in bands show obvious offsets from GALEX FUV and NUV bands (see also Kang et al., 2012). Considering that the UV photometry is powerful for age estimation of young stellar populations (Kaviraj et al., 2007), we would adopt the GALEX FUV and NUV photometries in the SED fitting, and abandon the magnitudes for these clusters.
The masses of the sample star clusters were determined sequentially. The galev models provide absolute magnitudes in 77 filters for SSPs of , including 66 filters of the HST, Johnson (Landolt, 1983), Cousins (Landolt, 1983), and (Bessell & Brett, 1988) systems. The difference between the intrinsic and model absolute magnitudes provides a direct measurement of the cluster mass, in units of (see Ma et al., 2011, for details). We transformed the 2MASS magnitudes to the photometric system of Bessell & Brett (1988) using the equations given by Carpenter (2001), and estimated masses of the clusters using magnitudes in all of the and bands. The masses of clusters obtained based on the magnitudes in different filters were different, therefore, we averaged them as the final cluster mass.
The masses of 22 clusters were not derived, because the magnitudes cannot be used: (1) there are no magnitudes (LGS04131.1_404612); (2) there are no magnitudes and the magnitudes were abandoned because of the discrepancy with the SDSS magnitudes (e.g., B195); (3) the magnitudes were abandoned because of the discrepancy with the SDSS magnitudes and the magnitudes were abandoned because of the discrepancy with the GALEX UV magnitudes (e.g., B319). The ages and masses of the sample clusters obtained in this paper are listed in Table 4.
3.3. Comparison with Previous Determinations
In this paper, we determined ages and masses for 135 star clusters by comparing their multicolor photometries with theoretical SPS models. These star clusters were from Caldwell et al. (2009, 2011), who presented a series of studies of M31 young and old clusters, respectively.
As discussed in Section 2.3, there are 40 clusters in this paper which are in common with our series of previous papers, and the ages of 27 clusters were also derived by our series of studies (Jiang et al., 2003; Fan et al., 2006; Ma et al., 2006, 2009b; Wang et al., 2010). In the study of Jiang et al. (2003), the SSP models of Bruzual & Charlot (G. Bruzual & Charlot 1996, unpublished) were used; in the studies of Fan et al. (2006) and Ma et al. (2006), the SSP models of Bruzual & Charlot (2003) were used. In addition, in these three studies, we used only the BATC photometries in 13 passbands, and did not include UV data, which is powerful tool for age estimation of young stellar populations (see Kang et al., 2012, and reference therein). So, we re-estimated the ages for these young star clusters with more photometric date including UV data, and with the same SSP models as Ma et al. (2009b) and Wang et al. (2010) used. In the studies of Ma et al. (2009b) and Wang et al. (2010), we used the metallicities obtained by Barmby et al. (2000) and Perrett et al. (2002) when estimating the ages of star clusters. The metallicities in Barmby et al. (2000) and Perrett et al. (2002) were determined from the Lick indices which were calibrated from the Galactic old GCs. However, Fusi Pecci et al. (2005) claimed that young star clusters are probably not so metal-poor as deduced from the metallicities obtained by Perrett et al. (2002), and concluded that band line strength tends to underestimate [Fe/H] values in Perrett et al. (2002) by more than 1 dex (see also Kang et al., 2012). As a result, most of ages obtained in Ma et al. (2009b) and Wang et al. (2010) are older than those obtained in this paper. So, we re-estimated the ages for the young star clusters in Ma et al. (2009b) and Wang et al. (2010) with the solar metallicity SSP models.
In addition, nine clusters (B476, BH11, M026, M040, M045, M053, M057, M058, and M070) were estimated to be older than 2 Gyr in this paper, which are considered to be old star clusters (e.g., Caldwell et al., 2009). Since this paper focused on young clusters, we would not consider these nine old clusters in the following analysis. However, we pointed out that the ages of six of these nine star clusters were estimated to be younger than 2 Gyr by previous studies: the age of B476 was estimated to be 1.2 Gyr by Caldwell et al. (2009) (however, 7.1 Gyr by Fan 2010); the age of BH11 was estimated to be 1.6 Gyr by Vansevičius et al. (2009); the age of M040 was estimated to be Myr by Fan et al. (2010) and Myr by Kang et al. (2012); the age of M053 was estimated to be 1 Gyr by Caldwell et al. (2009) and Myr by Fan et al. (2010); the age of M058 was estimated to be Myr by Fan et al. (2010); the age of M070 was estimated to be 1.2 Gyr by Caldwell et al. (2009) and Myr by Fan et al. (2010). The ages of these nine clusters derived by previous papers and here are listed in Table 3. There are three clusters with ages of 4 Myr, which is the lowest age limit of galev models. Clusters KHM31-37 and V133 were estimated slightly older by other authors (Caldwell et al., 2009; Kang et al., 2012), while B196D was estimated slightly younger ( Myr) by Caldwell et al. (2009).
In Figure 4, the estimated ages for the young ( Gyr) star clusters in this paper were compared with those from previous studies (e.g., Beasley et al., 2004; Vansevičius et al., 2009; Fan et al., 2010; Perina et al., 2010; Caldwell et al., 2009, 2011; Kang et al., 2012). The star clusters with ages of 4 Myr obtained in this paper are drawn with open squares in Figure 4. There are five clusters in common between Beasley et al. (2004) and this paper. We can see that the ages of Beasley et al. (2004) are in good agreement with ours. Vansevičius et al. (2009) estimated ages of star clusters located in the southern disk of M31 with SED-fitting. There is an obvious offset between their estimated ages and ours, which is caused by some large scatters. If the three clusters with ages greater than 3 Gyr given by Vansevičius et al. (2009), which are drawn with arrows in Figure 4, are not included, the systematic offset can be reduced to be Gyr. Fan et al. (2010) estimated ages of star clusters in M31 with multi-band () SED-fitting, and their results agree well with ours, with a small offset ( Gyr). Perina et al. (2009, 2010) determined ages of 20 possible YMCs in M31 by comparing the observed color magnitude diagrams and the isochrones of different metallicities and ages of Girardi et al. (2002), and estimated masses of these clusters based on the Maraston’s SSP models of solar metallicity and Salpeter (1955) and Kroupa (2001) IMFs and the IR magnitudes in the 2MASS-6X-PSC catalog. In general, the ages obtained in this paper are in good agreement with the determinations by Perina et al. (2010), with a small deviation ( Gyr). There is a small systematic offset ( Gyr) between Caldwell et al. (2009, 2011) and this paper, i.e. the ages obtained by Caldwell et al. (2009, 2011) are larger than the ages obtained here. Perina et al. (2010) also found the systematic offset as the ages obtained by Caldwell et al. (2009) are larger than the ages obtained by Perina et al. (2010). Perina et al. (2010) suggested that this offset is caused by the super-solar metallicity models () adopted by Caldwell et al. (2009) when they determined the ages of star clusters. Kang et al. (2012) derived ages for young clusters by fitting the multi-band photometry with model SEDs, and their results are in good agreement with ours.

In Figure 5, we compared the masses of clusters obtained in this paper with those from previous studies (e.g., Beasley et al., 2004; Vansevičius et al., 2009; Fan et al., 2010; Perina et al., 2010; Caldwell et al., 2009, 2011; Kang et al., 2012). The masses of two (KHM31-37 and V133) of the three clusters with ages of 4 Myr, which are drawn with open squares in Figure 5, were derived to be lower than . The masses estimated in this paper are in good agreement with those estimated by Beasley et al. (2004), Perina et al. (2010), Caldwell et al. (2009, 2011), and Kang et al. (2012). There is an obvious offset between Vansevičius et al. (2009) and this paper, which is mainly caused by some scatters. The cluster with the largest discrepancy is B335, with a mass estimate of by Vansevičius et al. (2009), and in this paper. When B335 is excluded, the offset can be reduced to be (). The masses estimated by Fan et al. (2010) are slightly less than those estimated here, with an offset of .

4. DISCUSSION OF YOUNG STAR CLUSTERS
4.1. Position
Figure 6 shows the number, ages and masses of young star clusters ( Gyr) as a function of projected radius from the center of M31, adopted at and (J2000.0) following Huchra et al. (1991) and Perrett et al. (2002). In the top panel, the histogram for the radial distribution of young star clusters shows clearly two peaks at kpc and kpc, while in the middle panel and bottom panel, wide age and mass distributions can be seen in these two peak regions.

Kang et al. (2012) presented the radial distribution of clusters against the distance from the center of M31, and found that the young clusters show two peaks around kpc and kpc. They also found that the UV SF regions show two distinct peaks: a main peak at kpc and a secondary peak around 11 kpc. In addition, a small peak at kpc in the distribution of ages of UV SF regions against the projected radius (see Figure 19 of Kang et al., 2012) can be clearly found. We argued that the peak at kpc obtained in this paper should be associated with the peak at kpc for the UV SF regions, while the peak at kpc obtained in this paper correlate with the well-known 10 kpc ring (Gordon et al., 2006).
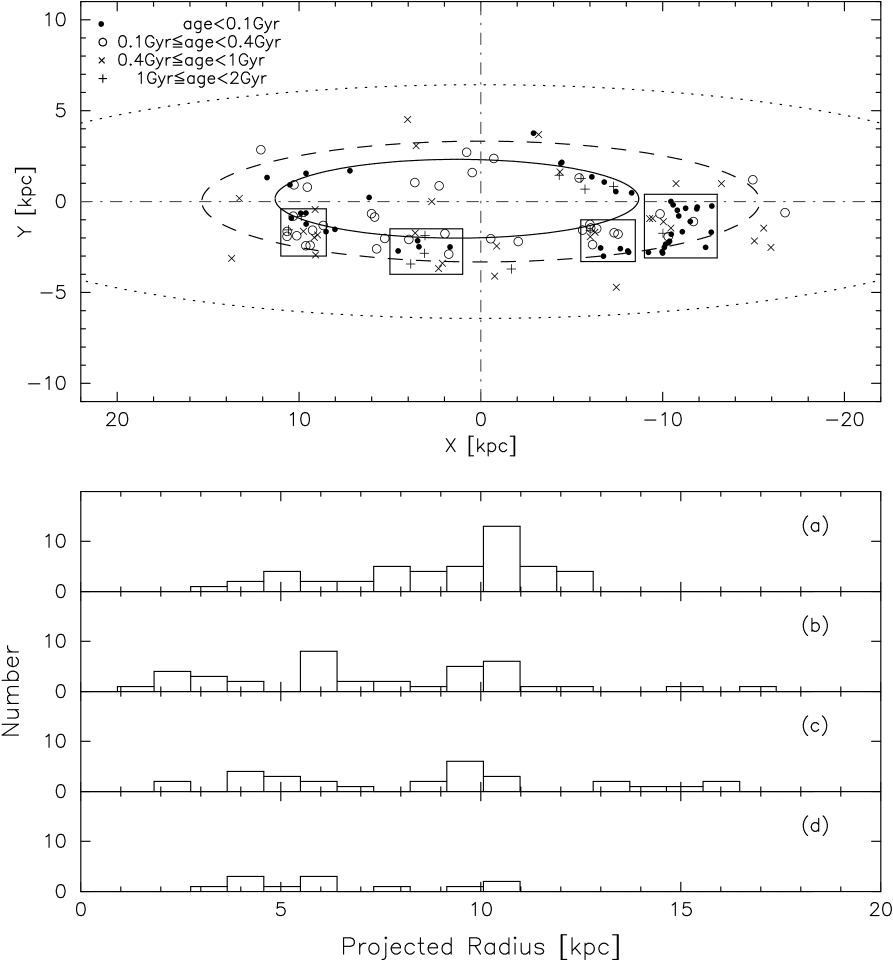
Figure 7 displays the spatial distribution and radial distribution of the M31 young clusters with different age bins: (a) Gyr; (b) 0.1 Gyr 0.4 Gyr; (c) 0.4 Gyr 1 Gyr; (d) 1 Gyr 2 Gyr. In the top panel, young star clusters in different age ranges are drawn with different marks. The inner, solid ellipse and the dashed contour represent the 10 kpc ring and the outer ring from Gordon et al. (2006) based on infrared observations with the Multiband Imaging Photometer for Spitzer (MIPS) instrument on the Spitzer Space Telescope, respectively. The 10 kpc ring was drawn with a center offset from the M31 nucleus by [, ] (Gordon et al., 2006) with a radius of 44 arcmin (10 kpc). There are several regions drawn with open rectangles which show aggregations of young star clusters to different extents. However, we should point out that these aggregations of young star clusters may be caused by the projection effect because of the inclination of M31 disk. Vansevičius et al. (2009) noted two clumps of young clusters, both of which are located in one rectangle ( kpc kpc and kpc 0 kpc). The star clusters in this study are spatially coincident with the disk and the rings, indicating that the distribution of the young star clusters correlates with the galaxy’s SF regions, which is consistent with previous studies (Fan et al., 2010; Kang et al., 2012). In the bottom panel, the number of young star clusters in different age bins as a function of projected radial distance from the M31 center was shown. We can see that clusters younger than Gyr show most obvious aggregation around the 10 kpc ring.
Gordon et al. (2006) ran a number of numerical simulations of the M31–M32 and M31-NGC 205 interactions, and assumed a passage of M32 through the disk of M31 occurring 20 Myr ago, resulting in a burst of star formation that propagates outward through the disk. Block et al. (2006) suggested that M32 and M31 had an almost head-on collision about 210 Myr ago, and M32 passed through M31 disk again about 110 Myr ago (see Figure 2 of Block et al., 2006), which induced two off-center rings–an inner ring with projected dimensions of 1.5 kpc and the 10 kpc ring. Both of the simulations recurred the 10 kpc ring and the observed split.
We divided our sample star clusters younger than 300 Myr into six groups, and showed the spatial distribution for each group in Figure 8. We can see that only star clusters with ages 50 Myr 100 Myr appear around the 10 kpc ring and the ring splitting region ( kpc kpc and kpc kpc) (Kang et al., 2012), indicating that 1) the 10 kpc ring may begin to form about 100 Myr ago; 2) M32 passed through the southern part of M31 disk around 100 Myr and in turn resulted in the split in the form of a hole. This appears to be consistent with the prediction by Block et al. (2006) of a second passage of M32 about 110 Myr ago. After the second passage, star clusters formed around the split for a long period, since there are a number of star clusters around the split with ages younger than 50 Myr. Davidge et al. (2012) reported that the star formation rate (SFR) of the M31 disk would be elevated greatly and quickly after an encounter event, and it would finally drop when the interstellar medium is depleted and disrupted. However, from Figure 8, we cannot find evidence of radial trend of star cluster ages (see also Kang et al., 2012; Caldwell et al., 2009).
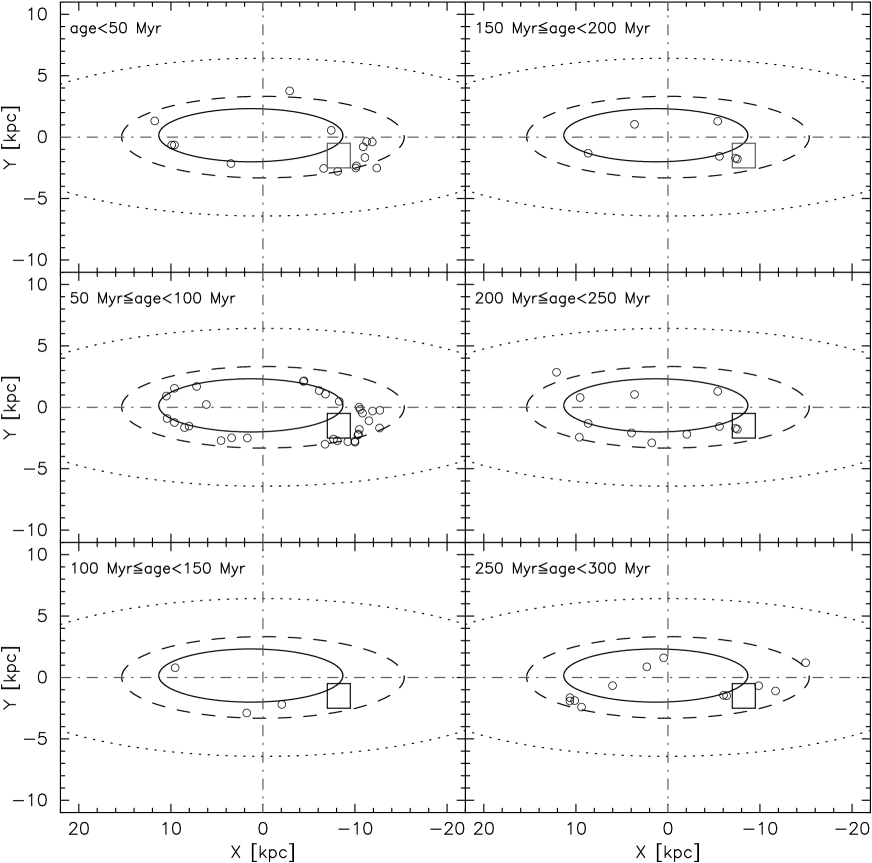
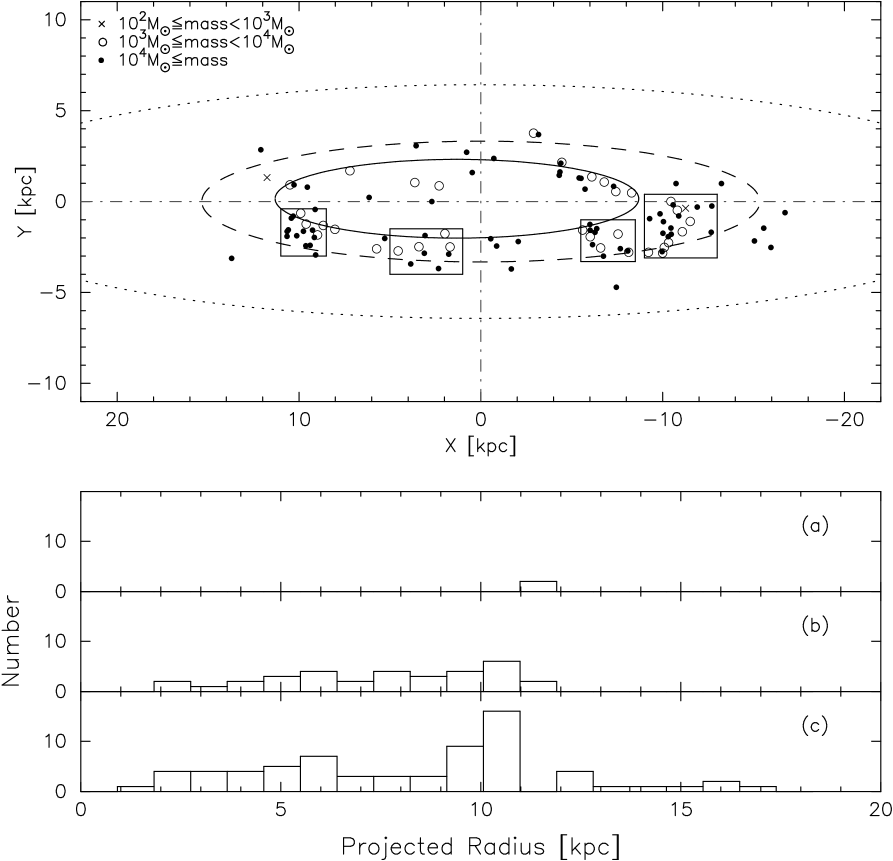
Figure 9 shows the spatial and radial distribution of the M31 young star clusters with different mass bins: (a) ; (b) ; (c) . In the top panel, clusters of these three groups are drawn with different marks. The bottom panel presents the number of young clusters in different mass bins as a function of projected radial distance from M31 center, and it shows that young clusters more massive than are most concentrated nearby the 10 kpc ring.
4.2. Age and Mass Distribution
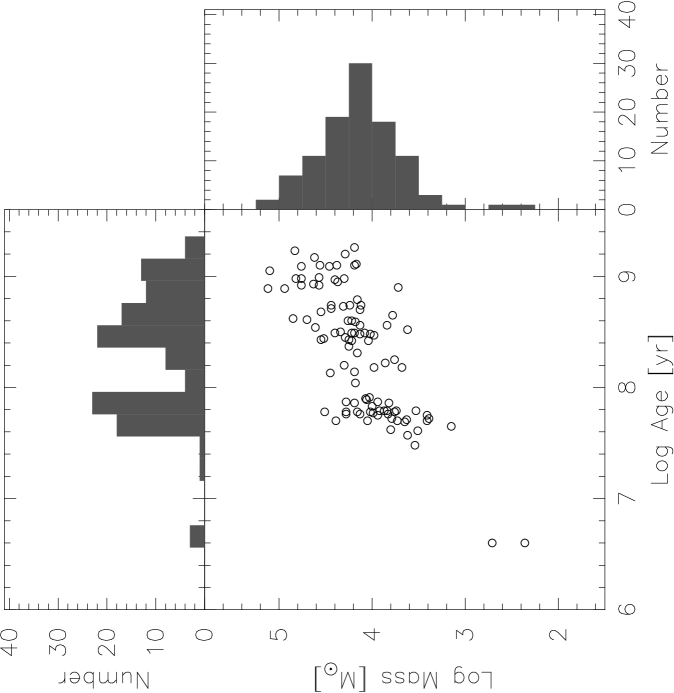
Figure 10 plots the distribution of estimated ages and masses for the young star clusters. A prominent correlation can be seen that mass increases with age. There are two distinct peaks in the age histogram: a highest peak at age 60 Myr () and a secondary peak around 250 Myr (). The mass distribution of the young star clusters show a single peak around . The mean values of age and mass of young clusters are about 385 Myr and , slightly higher than the values presented by Kang et al. (2012), which are 300 Myr and , respectively. Most of our young clusters have masses ranging from to , which are more massive than OCs in the solar neighborhood (Piskunov et al., 2008), but less massive than typical GCs in the MW (Mclaughlin & van der Marel, 2005). The lack of young clusters more massive than is also noted by Vansevičius et al. (2009) and Caldwell et al. (2009), possibly caused by a low-average SFR of M31 (Barmby et al., 2006) or hidden by dust clouds in the disk due to the inclination angle of M31 (Vansevičius et al., 2009).
Portegies et al. (2010) have listed three phases for the evolution of a young star cluster: 1) the first few Myr, during which the star formation activity is still proceeding and the star cluster is rich in gas; 2) a subsequent period after the first supernovae (some 3 Myr after formation), in which a young cluster is experiencing a serious loss of gas and dust, and stellar mass loss plays an important role in the cluster evolution; 3) a later stage that stellar dynamical processes dominate the cluster evolution. The dividing line between phase 2 and phase 3 may be anywhere between 100 Myr and 1 Gyr, and most of our young clusters are experiencing the phase 2 or phase 3.
Chernoff & Shapiro (1987) presented that after 5 Gyr, both mass and galactic location are important evolutionary parameters for GCs. Spitzer (1958) discussed the destructive effects of encounters of clusters with giant molecular clouds (GMCs), and presented that the disruption time for a star cluster varies directly with the cluster density and is about 200 Myr for a mean density of 1 . Spitzer & Harm (1958) also reported that two-body relaxation is effective at destroying low-mass clusters and this may account for the scarcity of low-mass older clusters. Actually, the two-body relaxation and the encounters with GMCs are also important processes that lead to young cluster disruption (see Caldwell et al., 2009, and references therein), while Portegies et al. (2010) presented that mass loss due to stellar evolution is the most important process in the young cluster dissolution. It is evident that star cluster mass is one key parameter in the star cluster evolution. Boutloukos et al. (2003) derived an empirical relation between the disruption time and the initial mass of star clusters in the solar neighborhood, Small Magellanic Cloud (SMC), M51, and M33. Lamers et al. (2005) determined a disruption time of 1.3 Gyr for a cluster in the solar neighborhood, while Caldwell et al. (2009) reported that most of M31 young clusters would be destroyed in the next Gyr or so, and only some massive and dense ones may survive for a longer time.
Several features are shown in Figure 10: 1) there is an obvious gap in the age distribution around 100 Myr. 2) there are few clusters older than 400 Myr () with mass lower than . Although many low-mass clusters can be easy to disrupt, this gap may be caused by a selection effect. In fact, Johnson et al. (2012) found that the completeness of M31 ground-based sample drops precipitously at (), which is about . 3) there are few clusters more massive than , which may be caused by a low-average SFR of M31 or the hidden by dust clouds in the M31 disk as discussed above. 4) there is a gap of clusters with very low masses () and younger than 30 Myr (). These clusters may be too faint to be sample objects of Caldwell et al. (2009, 2011), indicating that our sample is not complete in these age and mass ranges (see also Caldwell et al., 2009).
Figure 11 shows the age distribution in different mass intervals (top panel) and mass function in different age intervals (bottom panel). The histograms are derived using a 0.4-dex bin width with different starting values. These distributions contain information about the formation and disruption history of star clusters (Fall & Chandar, 2012), however, the interpretation of the empirical distributions of clusters depends strongly on how incompleteness affects the sample (Gieles et al., 2007). In the top panel, we can see an obvious gap before 40 Myr (), which is caused by a selection effect. The age distribution of the clusters does not declines monotonically, with an apparent bend around 200 Myr (). We argued that this bend near 200 Myr may be explained as a burst of cluster formation, possibly caused by a current interaction event between M31 and its satellite galaxy, such as the collision between M31 and M32 about 210 Myr ago suggested by Block et al. (2006). The two decline trends starting from 40 Myr and 200 Myr reflect a rapid disruption of clusters. Vansevičius et al. (2009) noted a peak of the cluster age distribution at 70 Myr, and suggested an enhanced cluster formation episode at that epoch. In the bottom panel, the gap in the number of clusters in the low-mass regions () is apparently due to a sample incompleteness, but not physical (Vansevičius et al., 2009). The initial mass function for star clusters should be slightly steeper (Fall & Chandar, 2012) than what is shown here because of the short lifetimes of low-mass clusters. Recently, Fall & Chandar (2012) compared the observed age distributions and mass functions of star clusters in the MW, MCs, M83, M51, and Antennae, and found that these distributions of clusters are similar in different galaxies. However, due to the incompleteness of our cluster sample, partly due to the exclusion of clusters that cannot derive accurate photometry, we would not give any empirical formulas of the distributions for age and mass.

4.3. Correlations with Structure Parameters
In this section, we will discuss the correlations of ages and masses with structure parameters, which are derived by King-model (King, 1966) fits for clusters in M31 (Barmby et al., 2002, 2007, 2009). Because the sample clusters are younger than 2 Gyr, the structure parameters obtained from the bluer filters are preferred (see Barmby et al., 2009, in detail). There are four clusters (B315, B319, B368, and B374) which have been studied twice by Barmby et al. (2002, 2007) and Barmby et al. (2009), and we would use the new results in Barmby et al. (2009).
Figure 12 shows structure parameters as a function of age for young clusters in this paper. Some correlations can be seen, the concentration , defined as , decreases with age. The trend is largely driven by clusters B342 and B368, both of which have large values (3.98 for B342 and 3.87 for B368). Both the scale radius and projected core radius increase with age. Clusters B342 and B368 have very small and values and are drawn with arrows in Figure 12 (The values of and are 0.014 pc for B342, while are 0.011 pc for B368). Elson et al. (1989) and Elson (1991) discussed the trend for core radius against age, and argued that this trend may represent real evolution in the structure of clusters as they grow old, partially explained by the effect of mass segregation (Mackey & Gilmore, 2003), or dynamical effects such as heating by black hole (BH) binaries (Mackey et al., 2007). Wilkinson et al. (2003) also demonstrated that neither large differences in primordial binary fraction nor a tidal heating due to differences in the cluster orbits could account for the observed trend. The best-fit central surface brightness shows a decreasing trend with age, and Barmby et al. (2009) argued that this trend may be likely due to the fading of stellar population and the increase of core radius with age. We also see that the central mass density decreases with age, although the scatters are great. Barmby et al. (2009) presented that the central mass density shows very little trend with age for both the M31 young clusters and young clusters in the MCs. There is no obvious correlation between , the two-body relaxation time at the model-projected half-mass radius, and age. The dashed line represents the region that equal to age. It can be seen that most clusters (except for DAO38 and M091) have ages less than , indicating that these young clusters have not been well dynamically relaxed. Because two-body encounters can transfer energy between individual stars and then impel the system to establish thermal equilibrium (Portegies et al., 2010), we argue that these young clusters have not established thermal equilibrium.

Figure 13 shows structure parameters as a function of mass for the sample young clusters. The concentration increases with mass, although the trend is much weak. Fall & Chandar (2012) presented plotted against mass for clusters in MCs, and found that there was no correlation between and mass. Actually, we found that all the clusters in Fall & Chandar (2012) have less than 2.5, much smaller than the largest value in our sample (). If we do not include the two clusters B342 and B368, the correlation for with mass nearly disappear. Both and increase with mass, however, the trend is largely weaken by cluster B327, which has very small values of and , but larger than those of B342 and B368 which are drawn with arrows in Figure 13. Both the central surface brightness and central mass density decrease weakly with mass, while no obvious correlation between and mass can be seen.

We checked the surface brightness profiles of B327, B342, and B368 displayed in Barmby et al. (2009), which have very small and and very large and , and found that these core profiles are cuspy. Barmby et al. (2009) concluded that the cores of these clusters did not appear to be resolved in the HST/WFPC2 images and the structural parameters for these clusters would be uncertain if the central cluster luminosity is dominated by only a few bright stars. However, if these cuspy core profiles are true integrated properties, which may be better fitted by a power-law structure model (e.g., Sérsic, 1968), the three clusters may have been post core-collapse (see Tanvir et al., 2012, in detail).
4.4. Young Massive Clusters
YMCs are often related to the violent SF episodes triggered by galaxy collisions, mergers, and close encounters (de Grijs & Parmentier, 2007). However, based on a sample of 21 nearby spirals, Larsen & Richtler (1999) found that YMCs can exist in a wide variety of host galaxy environments, including quiescent galaxies, and that there is no correlation between the morphological type of the galaxies and their contents of YMCs. YMCs are dense aggregates of young stars, which are also expected to be the nurseries for many unusual objects, including exotic stars, binaries, and BHs (Portegies et al., 2010). Many studies (Barmby et al., 2009; Caldwell et al., 2009; Vansevičius et al., 2009; Peacock et al., 2010; Perina et al., 2010; Portegies et al., 2010; Ma et al., 2011) that focused on M31 YMCs have derived remarkable achievements in understanding their stellar populations, structure parameters, and dynamical properties.
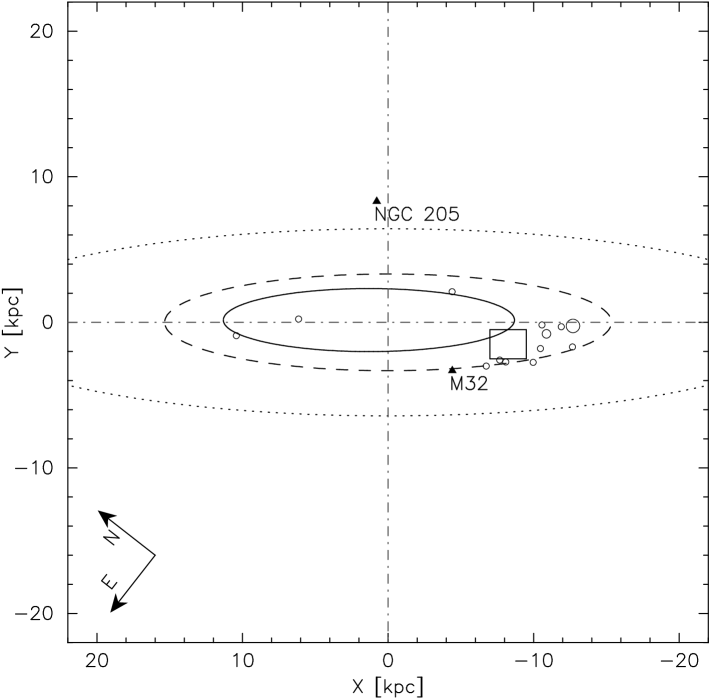
There are 13 YMCs in our cluster sample with a definition of age Myr and mass (Portegies et al., 2010). Figure 14 shows the spatial distribution of the 13 YMCs, while different sizes of the open circles indicate YMCs in different mass ranges. The rectangle between the 10 kpc ring and the outer ring represents the split in the southern part of the M31 disk, and the two black filled triangles represent M32 and NGC 205. It is not surprising to see that most of the YMCs gather around the split, indicating that there has been a high-level star formation activity, which is consistent with previous studies (Gordon et al., 2006; Kang et al., 2012).
5. SUMMARY
In this paper, we determined the ages and masses for a sample of M31 star clusters by comparing the multicolor photometry with theoretical SPS models. Multicolor photometric data are from the GALEX FUV and NUV, broadband , SDSS , 15 intermediate-band filters of BATC, and 2MASS , which constitute the SEDs covering Å.
We made a discussion on the spatial distribution, distribution of ages and masses, correlations of ages and masses with structure parameters for the sample young clusters ( Gyr). The mean value of age and mass of young clusters is about 385 Myr and , respectively. There are two distinct peaks in the age distribution, a highest peak at age 60 Myr and a secondary peak around 250 Myr, while the mass distribution shows a single peak around . There are several regions showing aggregations of young clusters around the 10 kpc ring and the outer ring, indicating that the distribution of the young clusters correlates well with M31’s SF regions. The ages and masses show apparent correlations with some structure parameters. We also found the correlation between core radius and age, which has been studied by many authors. A few young clusters have the two-body relaxation times greater than their ages, indicating that they have not been well dynamically relaxed. We argued that these young clusters have not established the thermal equilibrium.
The YMCs (age Myr and mass ) show obvious aggregation around the split in the southern part of the M31 disk, suggesting a high efficiency of star formation, possibly triggered by a recent passage of a satellite galaxy (M32) through M31 disk.
References
- Anders et al. (2004) Anders, P., Bissantz, N., Fritze-v. Alvensleben, U., & de Grijs, R. 2004, MNRAS, 347, 196
- Anders & Fritze-v. Alvensleben (2003) Anders, P., & Fritze-v. Alvensleben, U. 2003, A&A, 401, 1063
- Barmby et al. (2006) Barmby, P., Ashby, M. L. N., Bianchi, L., et al. 2006, ApJ, 650, L45
- Barmby et al. (2002) Barmby, P., Holland, S., & Huchra, J. P. 2002, AJ, 123, 1937
- Barmby et al. (2000) Barmby, P., Huchra, J., Brodie, J., et al. 2000, AJ, 119, 727
- Barmby et al. (2007) Barmby, P., McLaughlin, D. E., Harris, W. E., Harris, G. L. H., & Forbes, D. A. 2007, AJ, 133, 2764
- Barmby et al. (2009) Barmby, P., Perina, S., Bellazzini, M., et al. 2009, AJ, 138, 1667
- Beasley et al. (2004) Beasley, M. A., Brodie, J. P., Strader, J., et al. 2004, AJ, 128, 1623
- Bertin & Arnouts (1996) Bertin, E., & Arnouts, S. 1996, A&AS, 117, 393
- Bessell & Brett (1988) Bessell, M. S., & Brett, J. M. 1988, PASP, 100, 1134
- Block et al. (2006) Block, D. L., Bournaud, F., Combes, F., et al. 2006, Nature, 443, 832
- Bohlin et al. (1988) Bohlin, R. C., Cornett, R. H., Hill, J. K., Hill, R. S., & Stecher, T. P. 1988, ApJ, 334, 657
- Bohlin et al. (1993) Bohlin, R. C., Deutsch, E. W., McQuade, K. A., et al. 1993, ApJ, 417, 127
- Boutloukos et al. (2003) Boutloukos, S. G. & Lamers, H. J. G. L. M. 2003, MNRAS, 338, 717
- Bruzual & Charlot (2003) Bruzual, A. G., & Charlot, S. 2003, MNRAS, 344, 1000
- Caldwell et al. (2009) Caldwell, N., Harding, P., Morrison, H., et al. 2009, AJ, 137, 94
- Caldwell et al. (2011) Caldwell, N., Schiavon, R., Morrison, H., Rose, J. A., & Harding, P. 2011, AJ, 141, 61
- Cardelli et al. (1989) Cardelli, J. A., Clayton, G. C., & Mathis, J. S. 1989, ApJ, 345, 245
- Carpenter (2001) Carpenter, J. M. 2001, AJ, 121, 2851
- Charlot et al. (1996) Charlot, S., Worthey, G., & Bressan, A. 1996, ApJ, 457, 625
- Chernoff & Shapiro (1987) Chernoff, D. F., & Shapiro, S. L. 1987, ApJ, 322, 113
- Cohen et al. (2005) Cohen, J. G., Matthews, K., & Cameron, P. B. 2005, ApJ, 634, L45
- Davidge et al. (2012) Davidge, T. J., McConnachie, A. W., Fardal, M. A., et al. 2012, ApJ, 751, 74
- de Grijs et al. (2003) de Grijs, R., Fritze-v. Alvensleben, U., Anders, P., et al. 2003, MNRAS, 342, 259
- de Grijs & Parmentier (2007) de Grijs, R., & Parmentier, G. 2007, ChJAA, 7, 155
- de Jong (1996) de Jong, R. S. 1996, A&A, 313, 377
- Elson (1991) Elson, R. A. W. 1991, ApJS, 76, 185
- Elson et al. (1989) Elson, R. A. W., Freeman, K. C., & Lauer, T. R. 1989, ApJ, 347, L69
- Fall (2004) Fall, S. M. 2004, ASPC, 322, 399
- Fall & Chandar (2012) Fall, S. M., & Chandar, R. 2012, ApJ, 752, 96
- Fan et al. (1996) Fan, X., Burstein, D., Chen, J., et al. 1996, AJ, 112, 628
- Fan et al. (2010) Fan, Z., de Grijs, R., & Zhou, X. 2010, ApJ, 725, 200
- Fan et al. (2006) Fan, Z., Ma, J., de Grijs, R., Yang Y., & Zhou X. 2006, MNRAS, 371, 1648
- Fan et al. (2008) Fan, Z., Ma, J., de Grijs, R., & Zhou, X. 2008, MNRAS, 385, 1973
- Fan et al. (2009) Fan, Z., Ma, J., & Zhou X. 2009, Res. Astron. Astrophys., 9, 993
- Fusi Pecci et al. (2005) Fusi Pecci, F., Bellazzini, M., Buzzoni, A., et al. 2005, AJ, 130, 554
- Galleti et al. (2009) Galleti, S., Bellazzini, M., Buzzoni, A., Federici, L., & Fusi Pecci, F. 2009, A&A, 508, 1285
- Galleti et al. (2007) Galleti, S., Bellazzini, M., Federici, L., Buzzoni, A., & Fusi Pecci, F. 2007, A&A, 471, 127
- Galleti et al. (2006) Galleti, S., Federici, L., Bellazzini, M., Buzzoni, A., & Fusi Pecci, F. 2006, A&A, 456, 985
- Galleti et al. (2004) Galleti, S., Federici, L., Bellazzini, M., Fusi Pecci, F., & Macrina, S. 2004, A&A, 426, 917
- Gascoigne & Kron (1952) Gascoigne, S. C. B., & Kron, G. E. 1952, PASP, 64, 196
- Gieles et al. (2007) Gieles, M., Lamers, H. J. G. L. M., & Portegies-Zwart, S. F. 2007, ApJ, 668, 268
- Girardi et al. (2002) Girardi, L., Bertelli, G., Bressan, A., et al. 2002, A&A, 391, 195
- Gordon et al. (2006) Gordon, K. D., Bailin, J., Engelbracht, C. W., et al. 2006, ApJ, 638, L87
- Hodge (1961) Hodge, P. W. 1961, ApJ, 133, 413
- Huchra et al. (1991) Huchra, J. P., Brodie, J. P., & Kent, S. M. 1991, ApJ, 370, 495
- Jester et al. (2005) Jester, S., Schneider, D. P., Richards, G. T., et al. 2005, AJ, 130, 873
- Jiang et al. (2003) Jiang, L., Ma, J., Zhou, X., et al. 2003, AJ, 125, 727
- Johnson et al. (2012) Johnson, L. C., Seth, A. C., Dalcanton, J. J., et al. 2012, ApJ, 752, 95
- Kang et al. (2012) Kang, Y., Rey, S.-C., Bianchi, L., et al. 2012, ApJS, 199, 37
- Kaviraj et al. (2007) Kaviraj, S., Rey, S.-C., Rich, R. M., Yoon, S.-J., & Yi, S. K. 2007, MNRAS, 381, L74
- King (1966) King, I. R. 1966, AJ, 71, 64
- Kroupa (2001) Kroupa, P. 2001, MNRAS, 322, 231
- Kurth et al. (1999) Kurth, O. M., Fritze-v. Alvensleben, U., & Fricke, K. J. 1999, A&AS, 138, 19
- Lamers et al. (2005) Lamers, H. J. G. L. M., Gieles, M., Bastian, N., et al. 2005, A&A, 441, 117
- Landolt (1983) Landolt, A. U., 1983, AJ, 88, 439
- Larsen & Richtler (1999) Larsen, S. S., & Richtler, T. 1999, A&A, 345, 59
- Ma et al. (2009a) Ma, J., de Grijs, R., Fan, Z., et al. 2009a, Res. Astron. Astrophys., 9, 641
- Ma et al. (2009b) Ma, J., Fan, Z., de Grijs, R., et al. 2009b, AJ, 137, 4884
- Ma et al. (2011) Ma, J., Wang, S., Wu, Z., et al. 2011, AJ, 141, 86
- Ma et al. (2012) Ma, J., Wang, S., Wu, Z., et al. 2012, AJ, 143, 29
- Ma et al. (2007) Ma, J., Yang, Y., Burstein, D., et al. 2007, ApJ, 659, 359
- Ma et al. (2006) Ma, J., Zhou, X., Burstein, D., et al. 2006, A&A, 449, 143
- Mackey & Gilmore (2003) Mackey, A. D., & Gilmore, G. F. 2003, MNRAS, 338, 85
- Mackey et al. (2007) Mackey, A. D., Wilkinson, M. I., Davies, M. B., & Gilmore, G. F. 2007, MNRAS, 379, 40
- Massey (2006) Massey, P., Olsen, K. A. G., Hodge, P. W., et al. 2006, AJ, 131, 2478
- McConnachie et al. (2005) McConnachie, A. W., Irwin, M. J., Ferguson, A. M. N., et al. 2005, MNRAS, 356, 979
- Mclaughlin & van der Marel (2005) McLaughlin, D. E., & van der Marel, R. P. 2005, ApJS, 161, 304
- Nantais et al. (2006) Nantais, J. B., Huchra, J. P., & Barmby, P. 2006, AJ, 131, 1416
- Narbutis et al. (2008) Narbutis, D., Vansevičius, V., Kodaira, K., Bridžius, A., & Stonkutė, R. 2008, ApJS, 177, 174
- Peacock et al. (2010) Peacock, M. B., Maccarone, T. J., Knigge, C., et al. 2010, MNRAS, 402, 803
- Perina et al. (2009) Perina, S., Barmby, P., Beasley, M. A., et al. 2009, A&A, 494, 933
- Perina et al. (2010) Perina, S., Cohen, J. G., Barmby, P., et al. 2010, A&A, 511, A23
- Perina et al. (2011) Perina, S., Galleti, S., Fusi Pecci, F., et al. 2011, A&A, 531, 155
- Perrett et al. (2002) Perrett, K. M., Bridges, T. J., Hanes, D. A., et al. 2002, AJ, 123, 2490
- Piskunov et al. (2008) Piskunov, A. E., Schilbach, E., Kharchenko, N. V., Röser, S., & Scholz, R.-D. 2008, A&A, 477, 165
- Portegies et al. (2010) Portegies Zwart, S., McMillan, S., & Gieles, M. 2010, ARA&A, 48, 431
- Racine (1991) Racine, R. 1991, AJ, 101, 865
- Rey et al. (2007) Rey, S.-C., Rich, R. M., Sohn, S. T., et al. 2007, ApJS, 173, 643
- Salpeter (1955) Salpeter, E. E. 1955, ApJ, 121, 161
- San et al. (2010) San Roman, I., Sarajedini, A., & Aparicio, A. 2010, ApJ, 720, 1674
- Schulz et al. (2002) Schulz, J., Fritze-v. Alvensleben, U., Möller, C. S., & Fricke, K. J. 2002, A&A, 392, 1
- Sérsic (1968) Sérsic, J.-L. 1968, Atlas de Galaxias Australes (Cordoba: Obs. Astronomico)
- Spitzer (1958) Spitzer, L. Jr. 1958, ApJ, 127, 17
- Spitzer & Harm (1958) Spitzer, L. Jr. & Harm, R. 1958, ApJ, 127, 544
- Stetson (1987) Stetson, P. B. 1987, PASP, 99, 191
- Tanvir et al. (2012) Tanvir, N. R., Mackey, A. D., Ferguson, A. M. N., et al. 2012, MNRAS, 422, 162
- Vansevičius et al. (2009) Vansevičius, V., Kodaira, K., Narbutis, D., et al. 2009, ApJ, 703, 1872
- Wang et al. (2010) Wang, S., Fan, Z., Ma, J., de Grijs, R., & Zhou, X. 2010, AJ, 139, 1438
- Wilkinson et al. (2003) Wilkinson, M. I., Hurley, J. R., Mackey, A. D., Gilmore, G. F., & Tout, C. A. 2003, MNRAS, 343, 1025
- Williams & Hodge (2001) Williams, B. F., & Hodge, P. W. 2001, ApJ, 548, 190
- Zhou et al. (2003) Zhou, X., Jiang, Z., Ma, J., et al. 2003, A&A, 397, 361
| Object | ||||||||||||||||
|---|---|---|---|---|---|---|---|---|---|---|---|---|---|---|---|---|
| (mag) | (mag) | (mag) | (mag) | (mag) | (mag) | (mag) | (mag) | (mag) | (mag) | (mag) | (mag) | (mag) | (mag) | (mag) | (′′) | |
| B006D-D036 | 20.07 | 19.46 | 18.99 | 18.76 | 18.75 | 18.61 | 18.51 | 18.44 | 18.32 | … | 18.38 | 18.29 | … | 18.10 | … | 5.0 |
| 0.142 | 0.121 | 0.049 | 0.056 | 0.066 | 0.066 | 0.059 | 0.063 | 0.074 | … | 0.108 | 0.115 | … | 0.130 | … | ||
| B010D | 20.89 | 20.03 | 19.79 | 19.28 | 19.23 | 18.99 | 18.96 | 18.78 | 18.68 | 18.63 | 18.54 | 18.57 | 18.45 | 18.37 | 18.11 | 4.2 |
| 0.254 | 0.161 | 0.045 | 0.038 | 0.039 | 0.034 | 0.048 | 0.040 | 0.045 | 0.052 | 0.072 | 0.059 | 0.100 | 0.078 | 0.124 | ||
| B012D-D039 | … | 20.14 | 19.46 | 19.19 | 19.14 | 18.83 | 18.85 | 18.73 | 18.55 | 18.47 | 18.36 | 18.34 | 18.25 | 17.98 | 18.01 | 5.0 |
| … | 0.261 | 0.058 | 0.087 | 0.093 | 0.080 | 0.113 | 0.114 | 0.111 | 0.119 | 0.110 | 0.117 | 0.139 | 0.105 | 0.167 | ||
| B014D | … | 19.80 | 19.64 | 19.40 | 19.21 | 19.04 | 18.79 | 18.73 | 18.59 | 18.43 | 18.33 | 18.16 | 18.41 | 18.02 | 17.89 | 5.0 |
| … | 0.158 | 0.066 | 0.099 | 0.080 | 0.074 | 0.067 | 0.070 | 0.072 | 0.074 | 0.093 | 0.067 | 0.128 | 0.097 | 0.148 | ||
| B015D-D041 | … | 19.51 | 19.26 | 18.92 | 18.84 | 18.61 | 18.46 | 18.34 | 18.03 | 17.98 | 18.04 | 17.86 | 17.91 | 17.65 | 17.65 | 5.0 |
| … | 0.135 | 0.051 | 0.067 | 0.057 | 0.053 | 0.059 | 0.058 | 0.052 | 0.061 | 0.077 | 0.060 | 0.098 | 0.068 | 0.107 | ||
| B017D | 20.22 | 19.44 | 18.98 | 18.51 | 18.32 | 18.09 | 17.97 | 17.87 | 17.68 | 17.53 | 17.41 | 17.22 | … | 17.14 | 17.32 | 6.7 |
| 0.216 | 0.154 | 0.042 | 0.051 | 0.046 | 0.042 | 0.055 | 0.048 | 0.057 | 0.059 | 0.075 | 0.062 | … | 0.099 | 0.157 | ||
| B018-G071 | 19.81 | 18.78 | 18.32 | 17.93 | 17.88 | 17.80 | 17.45 | 17.39 | 17.20 | 17.13 | 16.84 | 16.95 | 16.79 | 16.71 | 16.86 | 5.8 |
| 0.274 | 0.052 | 0.061 | 0.083 | 0.048 | 0.037 | 0.037 | 0.033 | 0.026 | 0.041 | 0.045 | 0.034 | 0.048 | 0.081 | 0.125 | ||
| B019D | … | 19.81 | 20.18 | 19.90 | 19.48 | 19.23 | 18.96 | 18.79 | 18.51 | 18.44 | 18.18 | 18.39 | 18.15 | 17.84 | 17.95 | 5.0 |
| … | 0.176 | 0.139 | 0.179 | 0.140 | 0.128 | 0.124 | 0.111 | 0.108 | 0.101 | 0.099 | 0.103 | 0.130 | 0.103 | 0.163 | ||
| B035D | 21.08 | 19.74 | 19.14 | 18.91 | 18.67 | 18.56 | 18.41 | 18.35 | 18.13 | 18.10 | 18.05 | 18.01 | 18.18 | 17.94 | 18.08 | 5.0 |
| 0.399 | 0.192 | 0.032 | 0.047 | 0.040 | 0.040 | 0.048 | 0.046 | 0.053 | 0.054 | 0.081 | 0.060 | 0.117 | 0.120 | 0.177 | ||
| B040-G102 | 18.68 | 17.73 | 17.64 | 17.65 | 17.54 | 17.48 | 17.37 | 17.23 | 17.18 | 17.18 | 16.94 | 17.16 | 16.98 | 16.93 | 16.90 | 5.8 |
| 0.097 | 0.020 | 0.030 | 0.056 | 0.036 | 0.027 | 0.037 | 0.027 | 0.019 | 0.038 | 0.055 | 0.040 | 0.054 | 0.112 | 0.124 |
| Object | FUV | NUV | |||||||||||||
|---|---|---|---|---|---|---|---|---|---|---|---|---|---|---|---|
| (mag) | (mag) | (mag) | (mag) | (mag) | (mag) | (mag) | (mag) | (mag) | (mag) | (mag) | (mag) | (mag) | (mag) | (mag) | |
| B006D-D036 | 21.50 | 20.87 | … | … | 18.69 | … | … | 19.72 | 18.44 | 18.30 | 18.10 | 17.99 | … | … | … |
| 0.100 | 0.060 | … | … | 0.050 | … | … | 0.114 | 0.069 | 0.077 | 0.090 | 0.134 | … | … | … | |
| B010D | … | … | … | … | 18.92 | … | … | 20.80 | 19.11 | 18.62 | 18.40 | 18.27 | … | … | … |
| … | … | … | … | 0.050 | … | … | 0.224 | 0.114 | 0.120 | 0.127 | 0.171 | … | … | … | |
| B012D-D039 | … | … | … | … | 19.05 | … | … | 20.60 | 19.03 | 18.48 | 18.13 | 17.81 | … | … | … |
| … | … | … | … | 0.050 | … | … | 0.187 | 0.052 | 0.068 | 0.085 | 0.123 | … | … | … | |
| B014D | … | 22.81 | … | … | 18.53 | … | … | 20.54 | 19.05 | 18.49 | 18.14 | … | … | 15.79 | 15.72 |
| … | 0.380 | … | … | 0.050 | … | … | 0.131 | 0.044 | 0.057 | 0.072 | … | … | 0.133 | 0.224 | |
| B015D-D041 | … | … | … | … | 18.70 | … | … | 20.39 | 18.70 | 18.01 | 17.71 | 17.42 | … | 15.92 | 15.72 |
| … | … | … | … | 0.050 | … | … | 0.183 | 0.091 | 0.098 | 0.108 | 0.131 | … | 0.265 | 0.151 | |
| B017D | … | … | … | … | 18.23 | … | … | 20.05 | 18.32 | 17.77 | 17.39 | 17.17 | 15.21 | … | … |
| … | … | … | … | 0.050 | … | … | 0.132 | 0.048 | 0.057 | 0.066 | 0.088 | 0.094 | … | … | |
| B018-G071 | … | 22.19 | 18.47 | 18.25 | 17.53 | 17.00 | 16.38 | 19.39 | 17.85 | 17.22 | 16.82 | 16.63 | 15.46 | 14.78 | 14.60 |
| … | 0.140 | 0.080 | 0.050 | 0.050 | 0.050 | 0.050 | 0.088 | 0.059 | 0.063 | 0.067 | 0.076 | 0.094 | 0.086 | 0.112 | |
| B019D | … | … | … | … | 18.93 | … | … | 21.14 | 19.38 | 18.61 | 18.11 | 17.59 | 16.07 | 15.73 | 14.79 |
| … | … | … | … | 0.050 | … | … | 0.246 | 0.043 | 0.064 | 0.082 | 0.110 | 0.112 | 0.112 | 0.112 | |
| B035D | 22.37 | 22.95 | … | … | 18.48 | … | … | 20.05 | 18.68 | 18.27 | 17.91 | 17.58 | 15.99 | 15.35 | 15.18 |
| 0.340 | 0.310 | … | … | 0.050 | … | … | 0.162 | 0.111 | 0.121 | 0.135 | 0.164 | 0.094 | 0.112 | 0.130 | |
| B040-G102 | 19.84 | 19.30 | 17.42 | 17.69 | 17.30 | 16.92 | 16.63 | 18.32 | 17.38 | 17.19 | 17.05 | 16.98 | 16.07 | 14.96 | 15.51 |
| 0.030 | 0.020 | 0.046 | 0.022 | 0.010 | 0.022 | 0.022 | 0.048 | 0.035 | 0.039 | 0.045 | 0.059 | 0.112 | 0.086 | 0.130 |