Authorship Identification in Bengali Literature: a Comparative Analysis
Abstract
Stylometry is the study of the unique linguistic styles and writing behaviors of individuals. It belongs to the core task of text
categorization like authorship identification, plagiarism detection etc. Though reasonable
number of studies have been conducted in English language, no major work has been done so far in Bengali. In this work, We will present a
demonstration of authorship identification of the documents written in Bengali. We adopt a set of fine-grained stylistic
features for the analysis of the text and use them to develop two different models:
statistical similarity model consisting of three measures and their combination, and machine learning model with Decision Tree, Neural
Network and SVM. Experimental results show that SVM outperforms other state-of-the-art methods after 10-fold cross validations. We also
validate the relative importance of each stylistic feature to show that some of them remain consistently significant in every model used in
this experiment.
Keywords: Stylometry, Authorship Identification, Vocabulary Richness, Machine Learning.
1 Introduction
Stylometry is an approach that analyses text in text mining e.g., novels, stories, dramas that the famous author wrote, trying to measure the author’s style, rhythm of his pen, subjection of his desire, prosody of his mind by choosing some attributes which are consistent throughout his writing, which plays the linguistic fingerprint of that author. Authorship identification belongs to the subtask of Stylometry detection where a correspondence between the predefined writers and the unknown articles has to be established taking into account various stylistic features of the documents. The main target in this study is to build a decision making system that enables users to predict and to choose the right author from a specific anonymous authors’ articles under consideration, by choosing various lexical, syntactic, analytical features called as stylistic markers. Wu incorporate two models—(i) statistical model using three well-established similarity measures- cosine-similarity, chi-square measure, euclidean distance, and (ii) machine learning approach with Decision Tree, Neural Network and Support Vector Machine (SVM).
The pioneering study on authorship attributes identification using word-length histograms appeared at the very end of nineteen century Malyutov (2006). After that, a number of studies based on content analysis Krippendorff (2003), computational stylistic approach Stamatatos et al. (1999), exponential gradient learn algorithm Argamon et al. (2003), Winnow regularized algorithm Zhang et al. (2002), SVM based approach Pavelec et al. (2007) have been proposed for various languages like English, Portuguese (see Stamatatos (2009) for reviews). As a beginning of Indian language Stylometry analysis, Chanda et al. (2010) started working with handwritten Bengali texts to judge authors. Das and Mitra (2011) proposed an authorship identification task in Bengali using simple n-gram token counts. Their approach is restrictive when considering authors of the same period and same genre. The texts we have chosen are of the same genre and of the same time period to ensure that the success of the learners would infer that texts can be classified only on the style, not by the prolific discrimination of text genres or distinct time of writings. We have compared our methods with the conventional technique called vocabulary richness and the existing method proposed by Das and Mitra (2011) in Bengali. The observation of the effect of each stylistic feature over 10-cross validations relies on that fact that some of them are inevitable for authorship identification task especially in Bengali, and few of the rare studied features could accelerate the performance of this mapping task.
2 Proposed Methodology
The system architecture of the proposed stylometry detection system is shown in Figure 1. In this section, we briefly describe different components of the system architecture and then analytically present the set of stylistic features.

2.1 Textual analysis
Basic pre-processing before actual textual analysis is required so that stylistic markers are clearly viewed to the system for further analysis. Token-level markers discussed in the next subsection are extracted from this pre-processed corpus. Bengali Shallow parser111http://ltrc.iiit.ac.in/analyzer/bengali has been used to separate the sentence and the chunk boundaries and to identify parts-of-speech of each token. From this parsed text, chunk-level and context-level markers are also demarcated.
2.2 Stylistic features extraction
Stylistic features have been proposed as more reliable style markers than for example, word-level features since the stylistic markers are sometime not under the conscious control of the author. To allow the selection of the linguistic features rather than n-gram terms, robust and accurate text analysis tools such as lemmatizers, part-of-speech (POS) taggers, chunkers etc are needed. We have used the Shallow parser, which gives a parsed output of a raw input corpus. The stylistic markers which have been selected in this experiment are discussed in Table 1. Most of the features described in Table 1 are self-explanatory. However, the problem occurs when identifying keywords (KW) from the articles of each author which serve as the representative of that author. For this, we have identified top fifty high frequent words (since we have tried to generate maximum distinct and non-overlapped set of keywords) excluding stop-words in Bengali for each author using method. Note that, all the features are normalized to make the system independent of document length.
| No. | Feature | Explanation | Normalization | |
| Token Level | 1. | L(w) | Average length of the word | Avg. len.(word)/ Max len.(word) |
| Intersection of the keywords | ||||
| 2. | of Author R and the test | |||
| document | ||||
| Intersection of the keywords | ||||
| 3. | of Author A and the test | |||
| document | ||||
| Intersection of the keywords | ||||
| 4. | of Author O and the test | |||
| document | ||||
| 5. | HL | Hapex Legomena (No of | count(HL)/count(word) | |
| words with frequency=1) | ||||
| 6. | Punc. | No of punctuations | count(punc)/count(word) | |
| Phrase Level | 7. | NP | Detected Noun Phrase | count(NP)/count of all phrase |
| 8. | VP | Detected Verb Phrase | count(VP)/count of all phrase | |
| 9. | CP | Detected Conjunct Phrase | count(CP)/count of all phrase | |
| 10. | UN | Detected unknown word | count(POS)/count of all phrase | |
| 11. | RE | Detected reduplications | count(RDP+ECHO)/count of | |
| and echo words | all phrase | |||
| Context Level | 12. | Dig | Number of the dialogs | Count(dialog)/ No. of |
| sentences | ||||
| 13. | L(d) | Average length of the dialog | Avg. words per dialog/ No. of | |
| sentences | ||||
| 14. | L(p) | Average length of the | Avg. words per para/ No. of | |
| paragraph | sentences |
2.3 Building classification model
Three well-known statistical similarity based metrics namely Cosine-Similarity (COS), Chi-Square measure (CS) and Euclidean Distance (ED) are used to get their individual effect on classifying documents, and their combined effort (COM) has also been reported. For machine-learning model, we incorporate three different modules: Decision Trees (DT)222See5 package by Quinlan, http://www.rulequest.com/see5-info.html, Neural Networks (NN)333Neuroshell – the commercial software package, http://www.neuroshell.com/ and Support Vector Machine (SVM). For training and classification phases of SVM, we have used YamCha444http://chasen-org/ taku/software/yamcha/ toolkit and TinySVM- 0.07555http://cl.aist-nara.ac.jp/taku-ku/software/TinySVM classifier respectively with pairwise multi-class decision method and the polynomial kernel.
3 Experimental Results
3.1 Corpus
Resource acquisition is one of the challenging obstacles to work with electronically resource constrained languages like Bengali. However, this system has used 150 stories in Bengali written by the noted Indian Nobel laureate Rabindranath Tagore666http://www.rabindra-rachanabali.nltr.org. We choose this domain for two reasons: firstly, in such writings the idiosyncratic style of the author is not likely to be overshadowed by the characteristics of the corresponding text-genre; secondly, in the previous research Chakaraborty and Bandyopadhyay (2011), the author has worked on the corpus of Rabindranath Tagore to explore some of the stylistic behaviors of his documents. To differentiate them from other authors’ articles, we have selected 150 articles of Sarat Chandra Chottopadhyay and 150 articles777http://banglalibrary.evergreenbangla.com/ of a group of other authors (excluding previous two authors) of the same time period. We divide 100 documents in each cluster for training and validation purpose and rest for testing. The statistics of the entire dateset is tabulated in Table 2. Statistical similarity based measures use all 100 documents for making representatives the clusters. In machine learning models, we use 10-fold cross validation method discussed later for better constructing the validation and testing submodules. This demonstration focuses on two topics: (a) the effort of many authors on feature selection and learning and (b) the effort of limited data in authorship detection.
| Clusters | Authors | No. of documents | No. of tokens | No. of unique tokens |
| Rabindranath | ||||
| Cluster 1 | Tagore | 150 | 6,862,580 | 4,978,672 |
| (Author R) | ||||
| Sarat Chandra | ||||
| Cluster 2 | Chottopadyhay | 150 | 4,083,417 | 2,987,450 |
| (Author A) | ||||
| Cluster 3 | Others | 150 | 3,818,216 | 2,657,813 |
| (Author O) |
3.2 Baseline system (BL)
In order to set up a baseline system, we use traditional lexical-based methodology called vocabulary richness (VR) Holmes (2004) which is basically the type-token ratio , where is the size of the vocabulary of the sample text and is the number of tokens which forms the simple text. By using nearest-neighbor algorithm, the baseline system tries to map each of the testing documents to one author. We have also compared our approach with the state-of-the-art method proposed by Das and Mitra (2011). The results of the baseline systems are depicted using confusion matrices in Table 3.
| Vocabulary richness (VR) | Das and Mitra (2011) | |||||||
| R | A | O | e(error) in % | R | A | O | e(error) in % | |
| R | 26 | 14 | 10 | 48% | 31 | 9 | 10 | 38% |
| A | 17 | 21 | 12 | 58% | 18 | 30 | 2 | 40% |
| O | 16 | 20 | 14 | 72% | 10 | 6 | 34 | 32% |
| Avg. error | 56% | Avg. error | 36.67% | |||||
3.3 Performances of two different models
The confusion matrices in Table 4 describe the accuracy of the statistical measures and the results of their combined voting. The accuracy of the majority voting technique is 67.3% which is relatively better than others. Since the attributes tested are continuous, all the decision trees are constructed using the fuzzy threshold parameter, so that the knife-edge behavior for decision trees is softened by constructing an interval close to the threshold. For neural network, many structures of the multilayer network were experimented with before we came up with our best network. Backpropogation feed forward networks yield the best result with the following architecture: 14 input nodes, 8 nodes on the first hidden layer, 6 nodes on the second hidden layer, and 6 output nodes (to act as error correcting codes). Two output nodes are allotted to a single author (this increases the Hamming distance between the classifications - the bit string that is output with each bit corresponding to one author in the classification- of any two authors, thus decreasing the possibility of misclassification). Out of 100 training samples, 30% are used in the validation set which determines whether over-fitting has occurred and when to stop training. It is worth noting that the reported results are the average of 10-fold cross validations. We will discuss the comparative results of individual cross validation phase in the next section. Table 5 reports the error rate of individual model in three confusion matrices. At a glance, machine learning approaches especially SVM (83.3% accuracy) perform tremendously well compared to the other models.
| Statistical similarity models | ||||||||||||||||
| Cosine similarity | Chi-square measure | Euclidean distance | Majority voting | |||||||||||||
| (COS) | (CS) | (ED) | (COM) | |||||||||||||
| R | A | O | e(%) | R | A | O | e(%) | R | A | O | e(%) | R | A | O | e(%) | |
| R | 30 | 12 | 8 | 40 | 34 | 9 | 7 | 32 | 27 | 15 | 8 | 46 | 34 | 7 | 9 | 28 |
| A | 15 | 27 | 8 | 46 | 14 | 30 | 6 | 40 | 18 | 26 | 6 | 48 | 11 | 32 | 7 | 36 |
| O | 12 | 9 | 29 | 42 | 9 | 8 | 33 | 34 | 17 | 6 | 27 | 46 | 6 | 11 | 33 | 34 |
| Avg. error | 42.7 | Avg. error | 35.3 | Avg. error | 46.6 | Avg. error | 32.7 | |||||||||
| Machine Learning models | ||||||||||||
| Decision Tree | Neural Networks | Support Vector Machine | ||||||||||
| R | A | O | e(%) | R | A | O | e(%) | R | A | O | e(%) | |
| R | 35 | 8 | 6 | 28 | 38 | 9 | 3 | 24 | 44 | 3 | 3 | 12 |
| A | 7 | 37 | 6 | 26 | 10 | 35 | 5 | 30 | 8 | 40 | 2 | 20 |
| O | 6 | 5 | 39 | 22 | 9 | 5 | 36 | 28 | 2 | 7 | 41 | 18 |
| Avg. error | 25.3 | Avg. error | 27.3 | Avg. error | 16.7 | |||||||
3.4 Comparative analysis
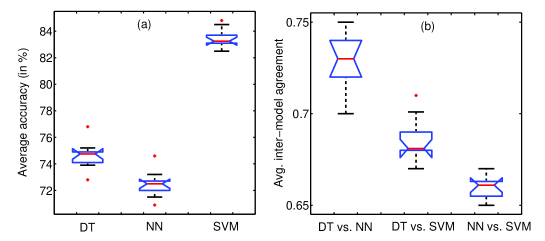
The performance of any machine learning tool highly depends on the population and divergence of training samples. Limited dataset can overshadowed the intrinsic productivity of the tool. Because of the lack of large number of dataset, we divide the training data randomly into 10 sets and use 10-fold cross validation technique to prevent overfitting for each machine learning model. The boxplot in Figure 2(a) reports the performance of each model on 10-fold cross validation phrase with mean accuracy and variance. In three cases, since the notches in the box plots overlap, we can conclude, with certain confidence, that the true medians do not differ. The outliers are marked separately with the dotted points. The difference between lower and upper quartiles in SVM is comparatively smaller than the others that shows relative low variance of accuracies in different iterations.
We also measure the pairwise agreement in mapping three types of authors using Cohen’s Kappa coefficient Cohen (1960). In Figure 2(b), the high correlation between Decision Tree and Neural Network models, which is considerably high compared to the others signifies that the effects of both of these models in author-document mapping task are reasonably identical and less efficient compared to SVM model.
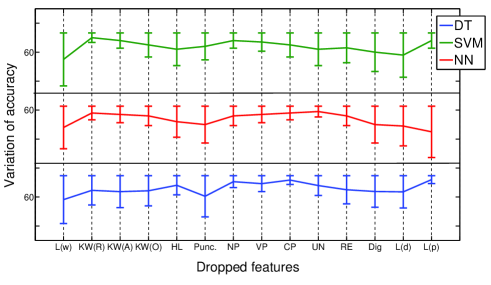
As a pioneer of studying different machine learning models in Bengali authorship task, it is worth measuring the relative importance of individual feature in each learning model that gets some features high privilege and helps in feature ranking. We have dropped each feature one by one and pointed out its relative impact on accuracy over 10-fold cross validations. The points against each feature in the line graphs in Figure 3 show percentage of accuracy when that feature is dropped, and the magnitude of the corresponding error bar measures the difference between final accuracy (when all features present) and accuracy after dropping that feature. All models rely on the high importance of length of the word in this task. All of them also reach to the common consensus of the importance of KW(R), KW(A), KW(O), NP and CP. But few of the features typically reflect unpredictable signatures in different models. For instance, length of the dialog and unknown word count show larger significance in SVM, but they are not so significant in other two models. Similar characteristics are also observed in Decision tree and Neural network models.
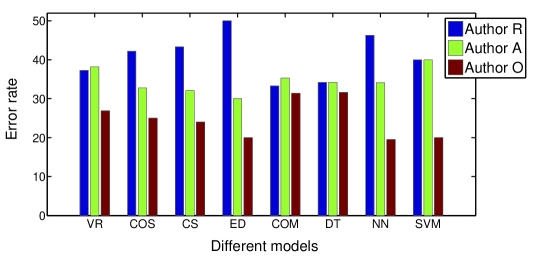
Finally, we study the responsibility of individual authors for producing erroneous results. Figure 4 depicts that almost in every case, the system has little overestimated the authors of documents as author R. It may occur due to the acquisition of documents because the documents in cluster 2 and cluster 3 are not so diverse and well-structured as the documents of Rabindranath Tagore. Developing appropriate corpus for this study is itself a separate research area specially when dealing with learning modules, and it takes huge amount of time. The more the focus will be on this language, the more we expect to get diverge corpus of different Bengali writers.
4 Conclusion and Future work
This paper attempts to demonstrate the mechanism to recognize three authors in Bengali literature based on their style of writing (without taking into account the author’s profile, genre or writing time). We have incorporated both statistical similarity based measures and three machine learning models over same feature sets and compared them with the baseline system. All of the machine learning models especially SVM yield a significantly higher accuracy than other models. Although the SVM yielded a better numerical performance, and are considered inherently suitable to capture an intangible concept like style, the decision trees are human readable making it possible to define style. While more features could produce additional discriminatory material, the present study proves that artificial intelligence provides stylometry with excellent classifiers that require fewer and relevant input variables than traditional statistics. We also showed that the significance of the used features in authorship identification task are relative to the used model. This preliminary study is the journey to reveal the intrinsic style of writing of the Bengali authors based upon which we plan to build more robust, generic and diverge authorship identification tool.
References
- Argamon et al. (2003) Argamon, S., Šarić, M., and Stein, S. S. (2003). Style mining of electronic messages for multiple authorship discrimination: first results. In KDD ’03: Proceedings of the ninth ACM SIGKDD international conference on Knowledge discovery and data mining, pages 475–480. ACM.
- Chakaraborty and Bandyopadhyay (2011) Chakaraborty, T. and Bandyopadhyay, S. (2011). Inference of fine-grained attributes of bengali corpus for stylometry detection. pages 79–83.
- Chanda et al. (2010) Chanda, S., Franke, K., Pal, U., and Wakabayashi, T. (2010). Text independent writer identification for bengali script. In Proceedings of the 2010 20th International Conference on Pattern Recognition, ICPR ’10, pages 2005–2008, Washington, DC, USA. IEEE Computer Society.
- Cohen (1960) Cohen, J. (1960). A Coefficient of Agreement for Nominal Scales. Educational and Psychological Measurement, 20(1):37–46.
- Das and Mitra (2011) Das, S. and Mitra, P. (2011). Author identification in bengali literary works. In Proceedings of the 4th international conference on Pattern recognition and machine intelligence, PReMI’11, pages 220–226, Berlin, Heidelberg. Springer-Verlag.
- Holmes (2004) Holmes, D. (2004). Review: Attributing authorship: An introduction. LLC, 19(4):528–530.
- Krippendorff (2003) Krippendorff, K. (2003). Content Analysis: An Introduction to Its Methodology. SAGE Publications.
- Malyutov (2006) Malyutov, M. B. (2006). General theory of information transfer and combinatorics. chapter Authorship attribution of texts: a review, pages 362–380. Springer-Verlag, Berlin, Heidelberg.
- Merriam (1998) Merriam, T. (1998). Heterogeneous authorship in early shakespeare and the problem of henry v. Literary and Linguistic Computing, 13(1):15–27.
- Pavelec et al. (2007) Pavelec, D., Justino, E. J. R., and Oliveira, L. S. (2007). Author identification using stylometric features. Inteligencia Artificial, Revista Iberoamericana de Inteligencia Artificial, 11(36):59–66.
- Rudman (1997) Rudman, J. (1997). The State of Authorship Attribution Studies: Some Problems and Solutions. Computers and the Humanities, 31(4):351–365.
- Stamatatos (2009) Stamatatos, E. (2009). A survey of modern authorship attribution methods. J. Am. Soc. Inf. Sci. Technol., 60(3):538–556.
- Stamatatos et al. (1999) Stamatatos, E., Fakotakis, N., and Kokkinakis, G. (1999). Automatic authorship attribution. In Proceedings of the ninth conference on European chapter of the Association for Computational Linguistics, pages 158–164. Association for Computational Linguistics.
- Vapnik (1995) Vapnik, V. N. (1995). The nature of statistical learning theory. Springer-Verlag New York, Inc., New York, NY, USA.
- Zhang et al. (2002) Zhang, T., Damerau, F., and Johnson, D. (2002). Text chunking based on a generalization of winnow. Journal of Machine Learning Research, 2:615–637.