The first optical light from the supernova remnant G182.4+4.3 located in the Galactic anti-centre region
Abstract
We report the discovery of optical filamentary and diffuse emission from G182.4+4.3 using 1.5-m Russian-Turkish telescope. We present the optical CCD images obtained with H filter revealing the presence of mainly filamentary structure at the northwest, filamentary and diffuse structure at the centre, south and north regions of the remnant. The bright optical filaments located in northwest and south regions are well correlated with the prominent radio shell of the remnant strongly suggesting their association. From the flux-calibrated CCD imaging, the average [S ii]/H ratio is found to be 0.9 and 1.1 for south and northwest regions, which clearly indicates that the emission originates from the shock heated gas. We also present the results of X-ray data obtained from XMM-Newton that show diffuse emission with a very low luminosity of erg s-1 at a distance of 3 kpc in 0.310 keV energy band. Furthermore, we find a surprisingly young age of 4400 yr for this remnant with such a large radius of 22 pc.
keywords:
ISM: individual objects: G182.4+4.3 ISM: supernova remnants Optical: ISM X-rays: ISM.1 Introduction
There are 274 Galactic supernova remnants (SNRs) catalogued in Green (2009) by their radio emission. Most of them are located in the Galactic plane where the density of gas and dust is very high which make the observation, except for radio band, of SNRs hard due to strong interstellar extinction and reddening effects in their line of sight. This difficulty can be surmounted by using narrow-band filters such as H, [S ii], [N ii] and [O iii] centered on characteristic emission lines on deep exposures. A number of Galactic SNRs are detected especially with H filter (e.g. Fesen & Milisavljevic (2010); Mavromatakis, Xilouris & Boumis (2007); Boumis et al. (2009); Stupar, Parker & Filipovi (2007); Stupar & Parker (2009)), in which they usually have peculiar morphological structures. Some of them have filamentary structure while others have filamentary and diffuse structures together or arc (shell) structures. Stupar & Parker (2011) reported a catalogue of 24 known Galactic SNRs uncovered in H light in the Anglo-Australian Observatory/United Kingdom Schmidt Telescope (AAO/UKST) H survey of the southern Galactic plane. The optical observations of Galactic SNRs enable us to study the physical conditions in the remnant and the ambient medium, such as variation of chemical composition, density and evolutionary state.
Galactic SNR G182.4+4.3 located in the anti-centre region has been detected at 1400 MHz, 2675 MHz, 4850 MHz, and 10450 MHz with the Effelsberg 100-m telescope in radio bands by Kothes, Fürst & Reich (1998). They reported that the remnant has a shell structure with a radio spectral index of = (S), about 50 arcmin in size, very low radio surface brightness (7.5 Watt m-2 Hz-1 sr-1 at 1 GHz), and is in Sedov expansion stage. Expanding into an ambient medium of low density indicated that its location was in front of the outer spiral arm III. H i line observations of neutral hydrogen showed that the column density towards the remnant must be 41021 cm-2. Considering its low ambient density and distance to be 3 kpc, they argued that z-height of the remnant was about 230 pc and concluded that it was most likely the remnant of a Type Ia supernova explosion. They have searched the ROSAT all sky survey at the position of this remnant and detected no visible X-ray emission (corresponding upper limit of 6.2 counts s-1). Assuming an initial explosion energy of erg, they obtained ambient density , swept-up mass M☉, electron temperature keV, age 3800 yr, and shock velocity km .
There is no optical identification of G182.4+4.3 in literature so far. In this paper, we report the first detection of optical emission from G182.4+4.3 both filamentary and diffuse structure in H. We also studied XMM-Newton data to investigate its properties in X-ray bands and combine optical imaging and X-ray observation to present a better view of this SNR.
The paper is organized as follows: Observations and data reduction are described in Section 2. Based on the CCD imaging analysis together with X-ray results, we discuss the filamentary and diffuse structure and the plasma parameters of the SNR in Section 3. We give our conclusion in Section 4.
2 Observations and data reduction
2.1 Optical Imaging
Optical CCD imaging observations of G182.4+4.3 were taken on 2011 February 05, March 02 and 2012 February 19, with low resolution spectrograph TFOSC (TUG Faint Object Spectrograph and Camera) equipped with 20482048 back-illuminated camera with a pixel size of 15 15 in a 13.513.5 arcmin2 field of view (FOV) attached to the Cassegrain focus of the 1.5-m Russian-Turkish joint telescope (RTT150)111Details on the telescope and the spectrograph can be found at http://www.tug.tubitak.gov.tr. at TÜBİTAK National Observatory (TUG) Türkiye, Antalya. The optical images were obtained with H, [S ii] and their continuum filters. The characteristics of these interference-filters are summarized in Table 1. The images were reduced by using standard iraf (Image Reduction Analysis Facility) routines for background subtraction, flat-fielding, trimming and continuum subtraction. The spectroscopic standard star HR5501 (Hamuy et al., 1992, 1994) was used for the absolute flux calibration. We write the coordinate information into the FITS header of the individual images with world coordinate system (WCS) tools. The weather conditions during these imaging observations were poor.
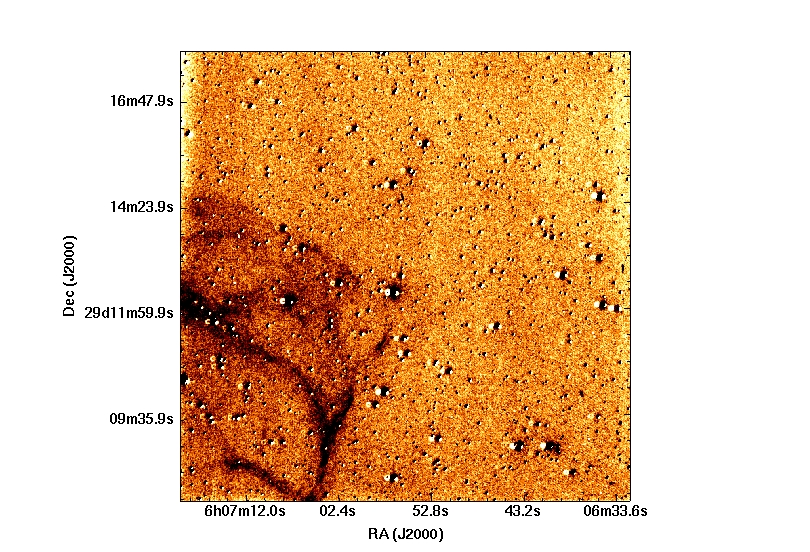
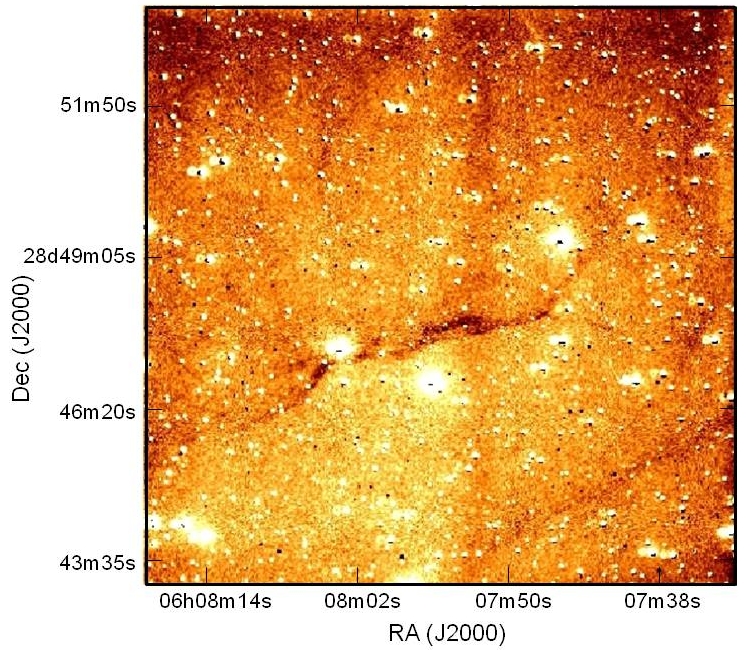
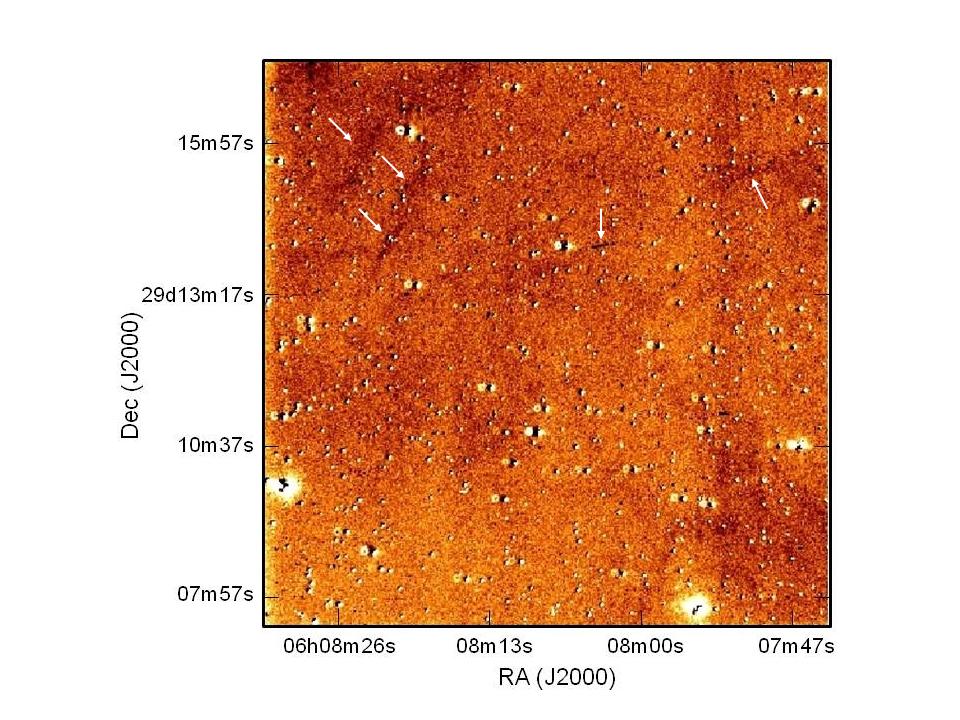
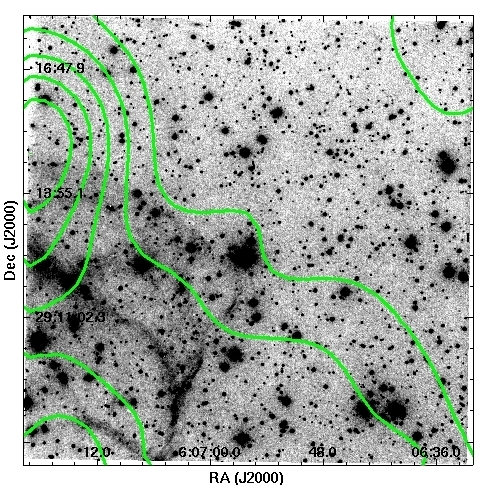
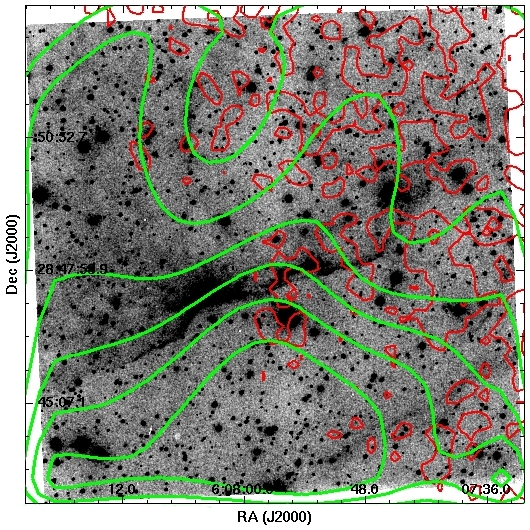
Due to its large size, we divided the whole remnant into several fragments and observed each fragment with H filter with short exposure time of 100 s. We obtained optical emission only from four regions, namely north (N), northwest (NW), center (C) and south (S). We focused our study on these four regions to obtain images with H, [S ii] and their continuum filters with relatively long exposures (900 s). Continuum subtracted H images of NW, S, C and N regions are given in Fig. 1, 2 and 3.
We also took the long-slit spectra by locating the slit on the brightest filament in S region on 2011 November 07 with an exposure time of 7200 s, with the spectroscopic mode of the TFOSC attached to Cassegrain focus of the RTT150. Unfortunately, due to poor observing conditions the obtained spectra did not allow us to get reliable results.
2.2 X-ray and radio-continuum observations
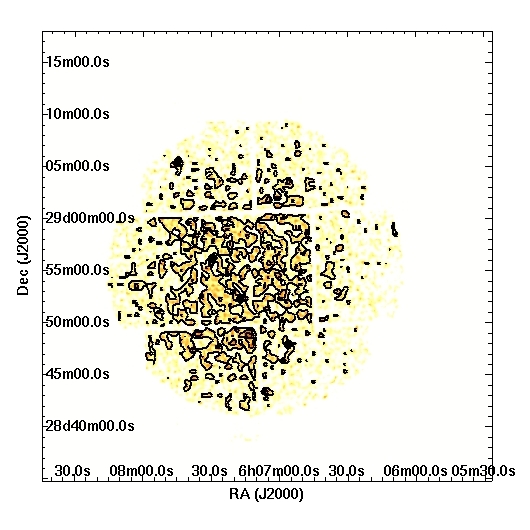
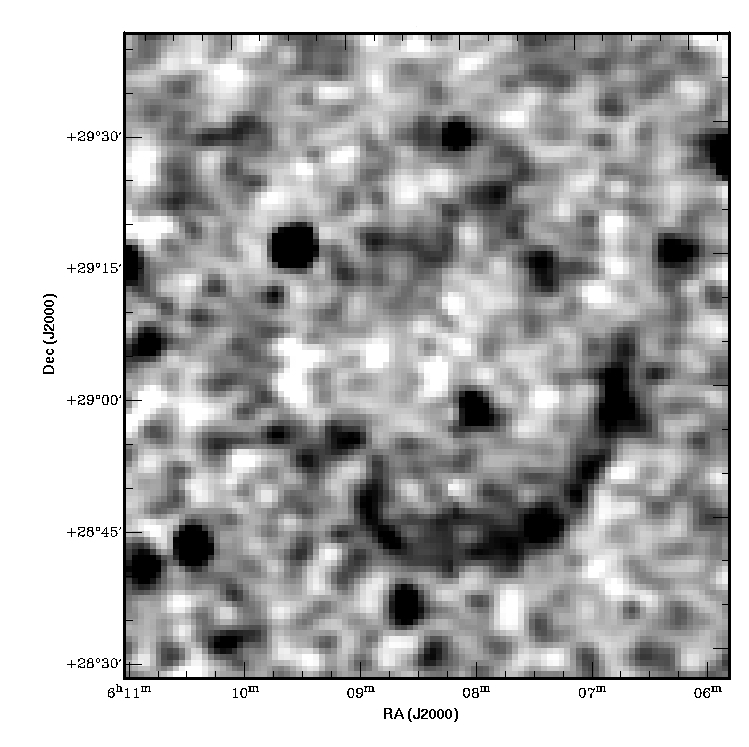
XMM-Newton (Jansen et al., 2001) observed G182.4+4.3 on 2001 Jun 15, under the observation ID 50406540 and exposure time of 23 ks. XMM-Newton has three X-ray telescopes (Aschenbach, 2002), one equipped with EPIC-PN (Strüder et al., 2001) and two with EPIC-MOS (Turner et al., 2001) CCD detectors in the focal plane. The data were reduced and analyzed using the xmm-newton sas222Science Analysis Software (sas), http://xmm.vilspa.esa.es/sas/, version 1.52.8. Calibrated event files for the EPIC-MOS1, EPIC-MOS2 and EPIC-PN detectors were produced using sas task emchain and epchain and following standard procedures. EPIC-MOS2 image in 0.310 keV energy band of the G182.4+4.3 is given in Fig. 4.
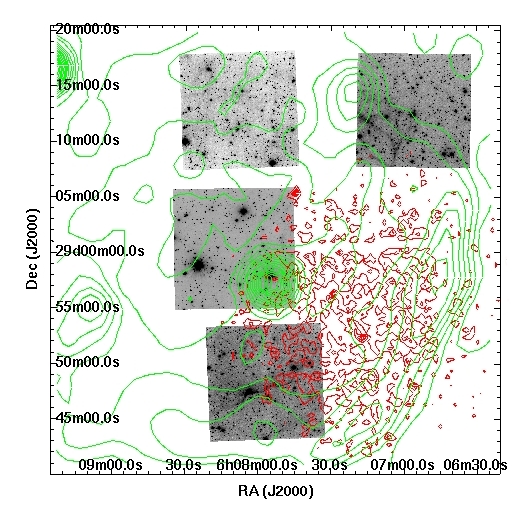
The overall radio structure of the G182.4+4.3 at 4850 MHz with the Effelsberg 100-m telescope (R. Kothes, private communication) is given in Fig. 5. As seen from the figure, the radio shell is most prominent in the south-west direction, this is because the prominent part of the shell is expanding towards the Galactic plane into higher density medium while the top shell is expanding away from the plane into very low density medium (Kothes & Brown, 2009).
We overlaid the H mosaic image of the observed regions with radio-continuum contour image taken from 4850 MHz Effelsberg data and X-ray contour image from XMM-Newton data to see if there is an association between the optical, radio and X-ray emission. As seen from the Fig. 6, there is a good correlation between optical and radio emission in NW and S regions. Due to poor observing conditions, for N and C regions the correlation is not seen clearly. The optical emission of S region correlates with both the radio and X-ray emission. N, NW and C regions are stand out of the FOV of XMM-Newton.
3 Results and Discussion
We present the first CCD images of G182.4+4.3 together with the results from XMM-Newton archival data analysis.
The H image of NW region shows mainly filamentary structure while that of other regions show both filamentary and diffuse structure, see Fig. 1, 2 and 3. As seen from Fig. 1, strong multiple filaments overlapping with the surrounding diffuse emission are visible only in the lower left part of NW region. In S region, see Fig. 2, a strong and long filamentary structure extending from the southeast edge of the field up to the northwest edge is visible. There is also a weaker filament extending parallel to the previous one in the southwest edge of this region. In the upper part of the prominent filament a strong diffuse emission is visible. In C region (see Fig. 3, upper panel), there is a curved weak filament extending from south to northwest as well as a fainter diffuse emission. The reason of the weakness of the emission may be the presence of very bright stars in this field. N region (see Fig. 3, bottom panel) seems much complex compared to other regions in H emission. There are several small scale filaments embedded in diffuse emission in this region. The filaments seen in the NW and S regions are very well correlated with the prominent radio shell of the remnant.
The [S ii]/H ratio greater than 0.5 is used as a standard discriminator for shock heated gas and hence indicative of SNRs (Fesen, Blair & Kirshner, 1985). We obtained [S ii]/H ratio to be 0.90.1 and 1.10.1 for S and NW regions, respectively. These ratios indicate that the emission originates from the ionization of shock heated gas resulted from collision.
We detected a diffuse and faint X-ray emission coming from the remnant as seen from the Fig. 4 and obtained a background-subtracted count rate of 0.04 counts s-1. Even with this low-count X-ray detection, we tried to get some information on the X-ray nature of G182.4+4.3 using the EPIC-MOS1 spectrum. We extracted the spectrum from a circular region with a radius of 8.3 arcmin centered at , . The spectrum was grouped with a minimum of 30 counts bin-1 and we used statistics. The spectrum was best-fitted with VPSHOCK model which is suitable for modelling plane-parallel shocks in young SNRs where plasma has not reached the ionization equilibrium (Borkowski, Lyerly & Reynolds, 2001), modified by Galactic absorption via the WABS multiplicative model (Morrison & McCammon, 1983) using xspec v11.3 (Arnaud, 1996). While model fitting, the absorbing column density (), electron temperature () and ionization parameter () were set free while all elements were fixed at their solar abundances (Anders & Grevesse, 1989). This fitting gave us cm-2, keV, cm-3s and a low X-ray luminosity () in 0.310 keV energy band to be erg s-1 at a distance of 3 kpc with an acceptable reduced value of 1.11 (64.5/58 d.o.f.). Using the emission measure (, where and are number densities of electrons and protons respectively, and is the X-ray emitting volume, and assuming ) we obtain a significantly low electron density of 0.024 . The mass of the X-ray emitting gas is calculated to be from , where is mass of a hydrogen atom. From t=/ the age of G182.4+4.3 is calculated to be 4400 yr which is consistent with the age that Kothes, Fürst & Reich (1998) found from ROSAT data. From the size distribution of the SNRs in the Magellanic Clouds, Badenes, Maoz & Draine (2010) showed that the distributions of close to uniform between r10 pc and r30 pc. They argued that a uniform size distribution arises from the physics of SNR evolution, Sedov expansion model for SNRs, and the distributions of densities in the ambient medium. Thus, being at t4400 yr age and having r22 pc, G182.4+4.3 is likely to be in the Sedov phase. A 4400 yr old SNR with a given original supernova mass, can expand to such a large size in a low density medium. The location of G182.4+4.3 is high from the Galactic plane (230 pc), it has a very low radio surface brightness and is faint in X-rays indicating that the remnant is expanding in a low density medium. The low electron density obtained from X-ray spectral analysis which is consistent with that of ROSAT data also supports this idea. Regarding its large radius and young age, G182.4+4.3 resembles the shell type Galactic SNRs G93.3+6.9 (DA530) and G156.2+5.7. G93.3+6.9 is located at 420 pc above the Galactic plane at a distance of 3.8 kpc and has a diameter of D=26 pc (Landecker et al., 1999). It is at the age of 5000 yr and expanding in a very low-density medium (0.05 cm-3). It has a very low radio surface brightness and its X-ray emission is extremely faint (Landecker et al., 1999). The other example G156.2+5.7 is located at z130 pc, at a distance of 3 kpc and is expanding in a low-density medium (0.01 cm-3) (Pfeffermann, Aschenbach & Predehl, 1991). Its optical observations suggest that it is interacting with clumpy interstellar medium (Gerardy & Fesen, 2007). It has low radio surface brightness however, it is bright in X-rays. Kothes, Fürst & Reich (1998) compared G182.4+4.3 with the G156.2+5.7 in this respect. They argued that the difference in the X-ray luminosities of G182.4+4.3 and G156.2+5.7 may be resulted from the difference in the ratio between the mass of the clouds and the mass of the intercloud medium. They concluded that G182.4+4.3 expanded into a medium with low density and a low fraction of clouds. Propagation of an SNR shock wave into a cool dense interstellar medium leads to H emission. The filamentary H emission emanating from this remnant suggests that there might be clumps of clouds in the medium in which SNR is expanding. Furthermore the different scale and structures of the filaments together with the diffuse emission may indicate the presence of small or large scale inhomogeneities in the interstellar clouds. However, in the FOV of XMM-Newton (see Fig 4), the cloud density might be very low leading to a faint X-ray emission.
From the optical spectra of SNRs, the electron density can be estimated by using the flux ratio of [S ii](6716/6731) (, 2006). The estimated electron density leads to obtain the pre-shock cloud density (see Fesen & Kirshner (1980)). Future spectral observations of this remnant could give detailed information about the inhomogeneities in the SNR and its ambient medium.
4 Conclusion
We detected optical filamentary and diffuse emission for the first time for G182.4+4.3 with several short or long scale filaments found in the N, NW, C and S regions. The strong optical filaments located in NW and S regions match with the prominent radio shell at 4850 MHz Effelsberg data of the remnant suggesting their association. A very strong emission of [S ii] relative to H [[S ii]/H0.9, 1.1] obtained from imaging suggests that the emission originates from the shock heated gas. Finally, we estimated X-ray properties of this remnant using XMM-Newton archival data. The X-ray spectrum of G182.4+4.3 shows that the plasma is of thermal origin in non-equilibrium ionization state and requires a temperature of 0.9 keV. The best-fitting of the spectrum implies that the SNR is very young (4400 yr), expanding in a very low density medium (0.024 ), it has a low X-ray emitting mass () and very low X-ray luminosity ( erg s-1 in 0.310 keV).
Acknowledgments
We are grateful to M. Filipovic for his constructive comments and suggestions on the manuscript. We thank to TÜBİTAK for a partial support in using RTT150 (Russian-Turkish 1.5-m telescope in Antalya) with project number 09ARTT150-458-0. We also thank to A. Akyüz for providing us some of the interference filters and R. Kothes for providing us the 4850 MHz Effelsberg data. The authors acknowledge support by the Akdeniz University Scientific Research Project Management. AS is supported by TÜBİTAK PostDoctoral Fellowship.
References
- Anders & Grevesse (1989) Anders E., Grevesse N., 1989, Geochimica Cosmochimica Acta, 53, 197
- Arnaud (1996) Arnaud K. A., 1996, in Jacoby G. H., Barnes J., eds, ASP Conf. Ser. Vol. 101, Astronomical Data Analysis Software and Systems V. Astron. Soc. Pac., San Francisco, p. 17
- Aschenbach (2002) Aschenbach B., 2002, in Gorenstein P., Hoover R. B., eds, Proc. SPIE Vol. 4496, X-Ray Optics for Astronomy: Telescopes, Multilayers, Spectrometers, and Missions. SPIE, Bellingham, p. 8
- Badenes, Maoz & Draine (2010) Badenes C., Maoz D., Draine B. T., 2010, MNRAS, 407, 1301
- Borkowski, Lyerly & Reynolds (2001) Borkowski K. J., Lyerly W. J., Reynolds S. P., 2001, ApJ, 548, 820
- Boumis et al. (2009) Boumis P., Xilouris E. M., Alikakos J., Christopoulou P. E., Mavromatakis F., Katsiyannis A. C., Goudis C. D., 2009, A&A, 499, 789
- Fesen & Kirshner (1980) Fesen R. A., Kirshner R. P., 1980, ApJ, 242, 1023
- Fesen, Blair & Kirshner (1985) Fesen R. A., Blair W. P., Kirshner R. P., 1985, ApJ, 292, 29
- Fesen & Milisavljevic (2010) Fesen R. A., Milisavljevic D., 2010, AJ, 140, 1163
- Gerardy & Fesen (2007) Gerardy C. L., Fesen R. A., 2007, MNRAS, 376, 929
- Green (2009) Green D.A., 2009, Bulletin of the Astronomical Society of India, 37, 45
- Hamuy et al. (1992) Hamuy M., Walker A.R., Suntzeff N.B., Gigoux P., Heatcote R., Phillips M.M., 1992, PASP, 104, 533
- Hamuy et al. (1994) Hamuy M., Suntzeff N.B., Heathcote R., Walker A.R., Phillips M.M., 1994, PASP, 106, 566
- Jansen et al. (2001) Jansen F. et al., 2001, A&A, 365, L1
- Kothes, Fürst & Reich (1998) Kothes R., Fürst E., Reich W., 1998, A&A, 331, 661
- Kothes & Brown (2009) Kothes R., Brown J., 2009, Proceedings of the International Astronomical Union, IAU Symposium, 259, 75
- Landecker et al. (1999) Landecker T. L., Routledge D., Reynolds S. P., Smegal R. J., Borkowski K. J., Seward F. D., 1999, ApJ, 527, 866
- Mavromatakis, Xilouris & Boumis (2007) Mavromatakis F., Xilouris E. M., Boumis P., 2007, A&A, 461, 991
- Morrison & McCammon (1983) Morrison R., McCammon D., 1983, ApJ, 270, 119
- (20) Osterbrock D. E., Ferland G. J., 2006, Astrophysics of the Gaseous Nebulae and Active Galactic Nuclei. University Science Book, Sausalito, California, p. 123
- Pfeffermann, Aschenbach & Predehl (1991) Pfeffermann E., Aschenbach B., Predehl P., 1991, A&A, 246, L28
- Strüder et al. (2001) Strüder L. et al., 2001, A&A, 365, L18.
- Stupar, Parker & Filipovi (2007) Stupar M., Parker Q. A., Filipovi M. D., 2007, MNRAS, 374, 1441
- Stupar & Parker (2009) Stupar M., Parker Q.A., 2009, MNRAS, 394, 1791
- Stupar & Parker (2011) Stupar M., Parker Q.A., 2011, MNRAS, 414, 2282
- Turner et al. (2001) Turner M. J. L. et al., 2001, A&A, 365, L27.
| Filter | Wavelength | Exposure times (s) |
| (FWHM) () | ||
| H | 6563 (88) | 900 |
| H cont. | 6446 (130) | 900 |
| [S ii] | 6728 (70) | 900 |
| [S ii] cont. | 6964 (300) | 900 |