Crystal Growth in the Presence of Surface Melting:
Novel Behavior of the Principal Facets of Ice
K. G. Libbrecht and M. E. Rickerby
Department of Physics, California Institute of Technology
Pasadena, California 91125
Abstract. We present measurements of the growth rates of the principal facet surfaces of ice from water vapor as a function of supersaturation over the temperature range C. Our data are well described by a dislocation-free layer-nucleation model, parameterized by the attachment coefficient as a function of supersaturation The measured parameters and for the basal and prism facets exhibit a complex behavior that likely originates from structural changes in the ice surface with temperature, in particular the onset and development of surface melting for C. From we extract the terrace step energy as a function of temperature for both facet surfaces. As a basic property of the equilibrium ice surface, the step energy may be amenable to calculation using molecular dynamics simulations, potentially yielding new insights into the enigmatic surface structure of ice near the triple point.
1 Introduction
Surface melting occurs when the near-surface atomic or molecular layers of a crystalline solid are not as tightly bound as the deeper layers, causing the near-surface layers to lose their ordered structure (for a review see [1]). The result is an amorphous “premelted” layer, also called a quasi-liquid layer, that exists in equilibrium at the solid surface. The structure of the quasi-liquid layer is strongly temperature dependent, and its thickness typically diverges as the melting point is approached. Surface melting is a common phenomenon in metals and other simple crystalline materials, and it has been especially well studied in ice [2, 3, 4].
In general the effects of surface melting on crystal growth have been little explored, although clearly the structural changes associated with surface melting can have a profound effect on surface molecular dynamical processes [5, 6]. Since our theoretical understanding of surface melting is relatively poor, we sought to examine how changes in surface structure with temperature affect crystal growth behavior.
It has long been long suspected that surface melting plays an important role in the growth dynamics of ice crystals from water vapor [7, 8, 9]. Although ice is a monomolecular crystal with a simple hexagonal structure under normal atmospheric conditions, ice crystals forming from water vapor exhibit an exceedingly rich spectrum of plate-like and columnar morphologies as a function of temperature and supersaturation over the temperature range C [9, 10, 11]. Since the premelted layer in ice develops over this same temperature range [2, 3, 4], the prevailing thinking holds that the temperature-dependent effects of surface melting on ice crystal growth are responsible for the observed morphological complexities, together with instabilities arising from diffusion-limited growth and other effects [9]. To date, however, this long-held hypothesis has remained largely untested by quantitative experimental data.
As part of our investigation, we made precise measurements of the growth rates of small faceted ice crystals from water vapor under carefully controlled conditions, in order to better quantify and parameterize the intrinsic ice growth behavior. To this end we measured growth rates of the basal (0001) and prism (1̄100) ice surfaces as a function of water vapor supersaturation and temperature over the temperature range C, thus covering the onset and development of surface melting. Our measurements were made at low background pressure to reduce the effects of particle diffusion through the surrounding gas, so the growth was mainly limited by surface attachment kinetics.
2 Ice Crystal Growth Measurements
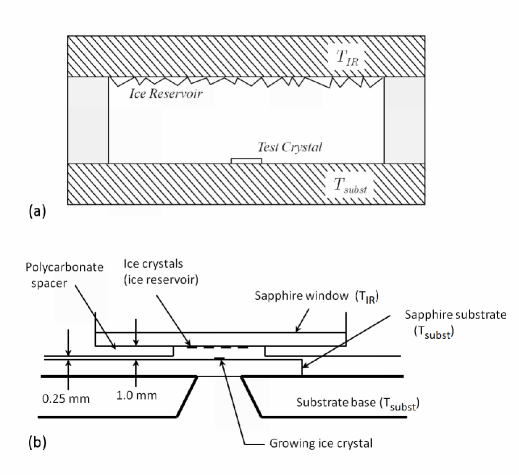
The goal of our ice growth experiments was to examine the growth of individual ice crystal facets in a carefully controlled environment, and an idealized schematic diagram of our experimental set-up is shown in Figure 1a. The top surface of the experimental chamber consists of a thermal conductor at a uniform temperature and a layer of ice crystals on its lower surface serves as a source of water vapor. At the beginning of each measurement, a single test crystal is placed near the center of the bottom substrate surface held at temperature . The ice reservoir and the substrate are separated by thermally insulating walls with a vertical spacing of 1.0 mm. The temperature difference determines the effective water vapor supersaturation seen by the test crystal.
During a typical experimental run, we continuously nucleated ice crystals in a much larger outer chamber containing ordinary laboratory air (see [12]), where they grew while slowly falling to the bottom of the chamber. Typically of these micron-scale crystals were growing within the outer chamber at any given time, and the fall times were approximately 3-5 minutes. This cloud of slowly growing crystals served as the source of seed crystals for our growth measurements.
To select a test crystal, an inlet valve on the top of a smaller inner chamber was opened, and air carrying suspended ice crystals was drawn from the outer chamber through the inner chamber. The operator rotated the substrate while observing the test region under the ice reservoir (see Figure 1), thus examining crystals that randomly landed on the substrate. When a suitable test crystal was identified, the inlet valve was closed and the pressure in the inner chamber was reduced to mbar.
Once the pressure was stable, the operator first adjusted and observed the test crystal growing or evaporating slightly in order to determine the point, which typically took a few minutes. After this, was slowly increased to grow the test crystal. The thickness of the crystal – defined as the distance between the substrate and the parallel top facet – was determined using optical interferometry, while optical imaging was used to record the crystal size and morphology in the substrate plane. These data, along with the temperature difference were all recorded as the crystal grew. After a few minutes, when the overall crystal size exceeded m, the crystal was evaporated away along with any other crystals on the substrate, and another crystal was selected.
One important aspect of our experiment was the accuracy of the water vapor supersaturation seen by each test crystal. Our typical precision in setting was C, and drifts in occurring during a typical measurement were comparable. This overall temperature uncertainty corresponded to an uncertainty in the point for each crystal of percent. If extra care was taken to determine the point and stabilize the temperature at the initial stage of a growth run, then this uncertainty could be reduced perhaps a factor of two further.
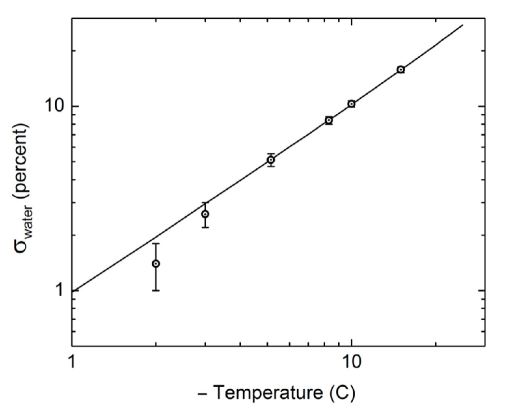
We checked our calculated supersaturation, based on the measured by nucleating water droplets on the substrate (in the absence of any test crystals) and measuring at which the droplets were neither evaporating nor growing. From this we extracted the supersaturation of water relative to ice as a function of temperature, shown in Figure 2. Accurately determining the droplet stability point became difficult at the higher temperatures, and this difficultly likely explains the systematic trend away from seen in Figure 2. The fact that our measurements, using no free parameters, were in good agreement with the accepted suggests that the water vapor supersaturation was quite well known in these experiments.
Only crystal facets parallel to, and thus not in contact with, the substrate were used to determine the intrinsic crystal growth parameters. Facets that intersected the substrate often grew at somewhat higher rates, especially at low owing to substrate interactions that reduced the normal nucleation barriers on these facets [15].
Broad-band interferometry was used when measuring the basal facets, as described in [12, 13], allowing an absolute measurement of the crystal thickness. This technique worked well for thin plate-like crystals, but was less effective when measuring the growth of the prism facets, owing to the greater distance between the top facet and the substrate. Thus all the prism facet measurements were taken using laser interferometry as described in [19].
For example, Figure 3 shows two images of a single ice prism taken at different times. The central laser spot oscillated between dark and bright as the crystal thickness increased, resulting from the interference of reflections from the sapphire/ice and ice/vacuum interfaces. These brightness changes were used to measure the growth velocity of the top prism facet. For these data the initial crystal morphology was assumed to be a simple hexagonal prism, so imaging of the crystal yielded an estimate of the initial crystal thickness.
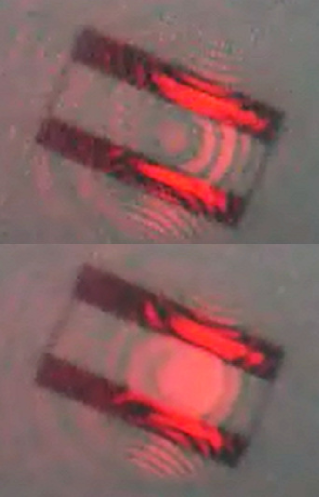
While our crystal size measurements were straightforward in most cases [12], we did run into some initial problems using laser interferometry on smaller crystals. In addition to the central “bulls-eye” fringes seen in Figure 3, one can also see a number of smaller laser fringes that we have come to calling “false” fringes, resulting from multiple reflections within the crystal. The false fringes tend to dominate the laser interference pattern when the top facet is small, and the resulting bright/dark transitions are not always obvious to interpret. We came to realize that in an earlier version of this experiment [19], we sometimes inadvertently used the false fringes when measuring prism facet growth, thus leading to erroneous results. The basal growth measurements in [19] were not compromised by this problem, since the basal facet surfaces were large enough to produce clean laser fringes.
Some other important aspects of the experiment included: 1) Our test crystals were small, typically m in overall size. Thin plates were typically m thick. The background air pressure in the test chamber was typically mbar. Using small crystals and low background pressures was important to reduce the effects of particle diffusion, as described further below; 2) We used only crystals with simple morphologies and well formed facets, and each crystal was discarded after growth. Evaporating and regrowing crystals was found to result in generally lower quality data; 3) Low outgassing materials were used to construct our experimental chamber, and the thermal control hardware (including thermoelectric modules, thermally conducting grease, and associated wiring) was all mounted outside the vacuum envelope. The chamber was also baked between each run to remove any volatile chemical residues. We believe that chemical impurities were responsible for some discrepancies in our earlier results [19], and these problems have been remedied for the current experiment; 4) Our test crystals were freshly made in a clean environment and transported within minutes to our test chamber with minimal processing, as described above. This also helped minimize any buildup of chemical impurities on the ice surfaces. With all these precautions, we believe that we have adequately reduced many systematic errors that appear to have been present in previous ice growth experiments [9, 16].
The goal of our measurements was to determine the intrinsic growth rates of the principal facets of ice, which we write in terms of the surface attachment coefficient using where is the growth velocity normal to the surface, is a kinetic velocity derived from statistical mechanics [9], and is the water vapor supersaturation immediately above the growing ice surface. The maximum allowed growth velocity has (albeit with some caveats; see [9]), while faceted surfaces generally have
We also found it useful to define a “measured” attachment coefficient derived entirely from experimentally measured quantities using where is the supersaturation far from the crystal. To lowest order, the measured is given by
| (1) |
as described in [9, 12], where , is an effective crystal radius, is the background air pressure, m, and bar. If the measured crystal growth is predominantly kinetics limited, then and If the growth is mainly limited by particle diffusion through the background gas, however, then
Examples showing the growth of the basal facets of two ice crystals are shown in Figure 4, where the measured growth velocities have been converted to . At low background pressures, we see that the growth is predominantly limited by attachment kinetics, at least for small crystals at low supersaturations. For essentially all our data, we found that the growth was well described by a layer nucleation model [17], and to describe the growth we adopted a simplified parameterization of the intrinsic attachment coefficient where and are parameters that depend on temperature but not on supersaturation, and is the supersaturation at the crystal surface.
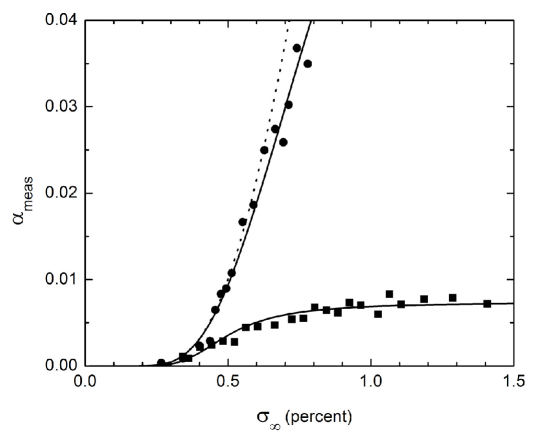
At high background air pressures and high supersaturations, the growth becomes distorted by particle diffusion effects. In Figure 4, the solid lines show fits with = and for the low-pressure and high-pressure crystals, respectively (with supersaturations in percent). The intrinsic attachment coefficient is also plotted as a dotted line in this figure. Note that we have displayed and in the same plot frame in Figure 4, even though these can be significantly different quantities. Our measurements directly yield , while our goal is to extract from these measurements.
We explored the hypothesis that may itself depend on pressure, as the background gas could affect the surface molecular dynamics that determines If the gas contains chemically active components, then these will adsorb on the ice surface and affect its growth, as is well known for the case of chemical impurities in air [18].
For pure gases such as nitrogen and oxygen, however, as well as clean air, it is generally assumed that does not depend on the gas pressure. Comparisons of growth data taken in air at one bar and at 25 mbar, like the examples shown in Figure 4, support this conclusion. While the diffusion effects depend strongly on pressure, we found no evidence that was changed by the presence of the background gas. We therefore made the implicit assumption in our data that measurements of made in clean air are equivalent (after accounting for diffusion effects) to the ideal case of ice growth from a gas of pure water vapor.
Although the diffusion distortions are relatively small at the low background pressures used, we nevertheless found it important to correct for these effects, and a detailed description of our correction procedure is described in [15]. Essentially, the correction produced an estimate of using the known along with the air pressure and measured growth rates of all the facets as inputs. From this, the intrinsic attachment coefficient was then obtained from
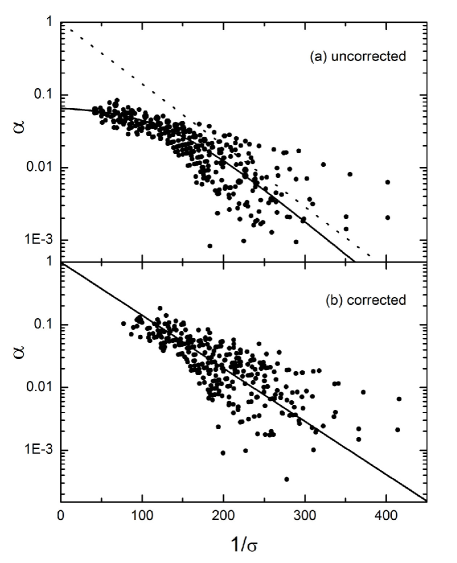
This data correction procedure allowed us to remove the residual diffusion effects and convert to . Figure 5 shows a set of basal growth data taken at C, both without (top) and with (bottom) the diffusion correction. Note that no adjustable parameters were use in this conversion.
Plotting as a function of as in Figure 5b shows how the parameters and are coupled in our measurements. The slope in Figure 5b gives while the intercept at is equal to Correcting for diffusion effects was essential for determining accurately, since this parameter was necessarily arrived at from an extrapolation of the data to For all our basal growth measurements, and for our prism growth measurements with C, the data were well described using as shown in the example in Figure 5. In these cases we set and fit for only, which reduced the uncertainty in the determinations.
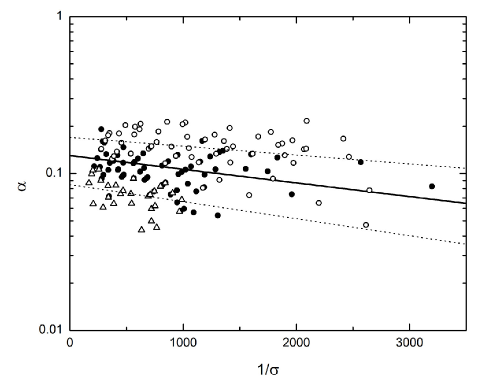
For prism growth measurements at temperatures C, it became clear that would no longer fit the observations. Figure 6 shows one example of corrected growth data at C. For these measurements we fit both and to the data. We found that was low with these data, so coupling between the parameters was not a serious problem, allowing both parameters to be measured reliably.
In addition to a much lower Figure 6 also demonstrates small systematic variations between three different data sets acquired during three separate measurement runs. The high and low runs (open points) were done while testing different substrate surface treatments, while the central run (solid points) was done with a clean sapphire substrate. We suspect that the variations seen in Figure 6 resulted mainly from residual chemical vapors in the test chamber, associated with the surface treatments, depositing on the top ice surface and affecting its growth. Nearly all our data were taken using a substrate that was thoroughly cleaned before each run, with no additional surface treatments.
Residual chemical impurities of this nature are an unavoidable uncertainty in all ice growth experiments, since one cannot be certain how clean is clean enough. Furthermore we have seen situations were chemical impurities blocked the surface growth and thus reduced , as well as circumstances where impurities reduced the nucleation barrier and thus increased . We have used quantitative experiments to examine how surface chemistry can affect ice crystal growth [18], and we believe that the current experiment is sufficiently clean that residual chemical effects are not a serious systematic problem. The final error bars in our measurements were adjusted to account for residual systematic errors of this kind, as estimated empirically from run-to-run variations seen throughout all our data.
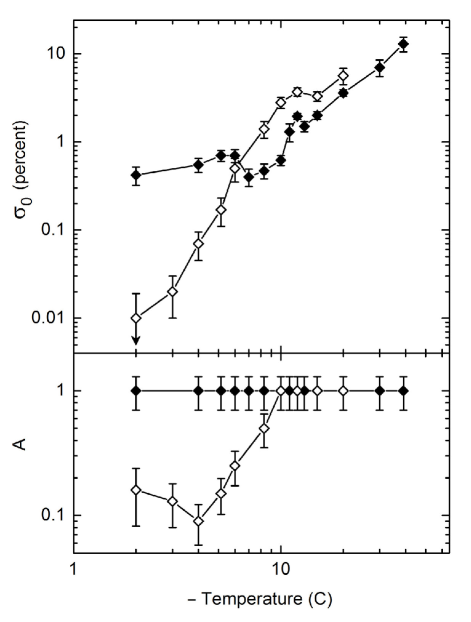
For both ice facets, and over the entire temperature range measured, we found that our data are well described by the functional form indicative of a dislocation-free layer-nucleation model. From measurements of over 200 crystals, we produced the final measurements of and shown in Figure 7, which is the principal result from this experiment. The current set of measurements includes only data points for C; lower-temperature points in Figure 7 were taken from [19], which was a previous version of this experiment. For those cases where we assumed in our fits, as described above, we assigned error bars to in Figure 7 that give an estimate of the overall experimental uncertainty in this assumed value.The ranges of surface supersaturations over which data were collected for these measurements are shown in Figure 8.
Roughly 5-10 percent of the crystals sampled grew much more rapidly than the norm, especially at low supersaturations, suggesting that the usual nucleation barrier was substantially reduced [15, 20]. We suspect that dislocations or perhaps isolated surface chemical impurities affected the growth of these crystals, and they were discarded from our data set before fitting to produce the measurements in Figure 7.
Another set of crystals, again roughly 5-10 percent of those sampled, grow anomalously slowly, and these crystals were also discarded from our fits. In essence, we performed “robust” fits to our data – first fitting the entire data set, then removing a small number of “outlier” crystals before redoing the fits. This step was necessary because the outlier crystals grew substantially differently from the norm and thus adversely affected the fits.
We have witnessed similar outlier effects in other ice growth experiments, suggesting that this is a persistent and somewhat uncontrollable problem. Managing this problem was possible only by measuring a large number of crystals to define the overall distribution of growth behaviors, thus allowing us to identify and remove highly unusual cases. We believe that the final results in Figure 7 accurately represent the growth of chemically clean, dislocation-free ice facet surfaces.
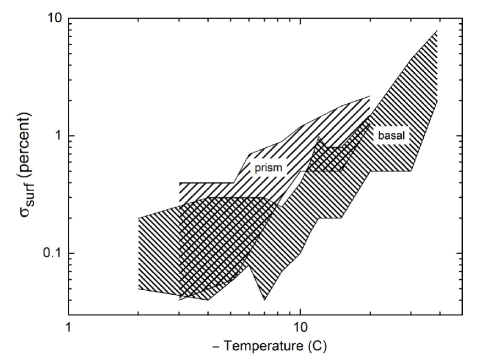
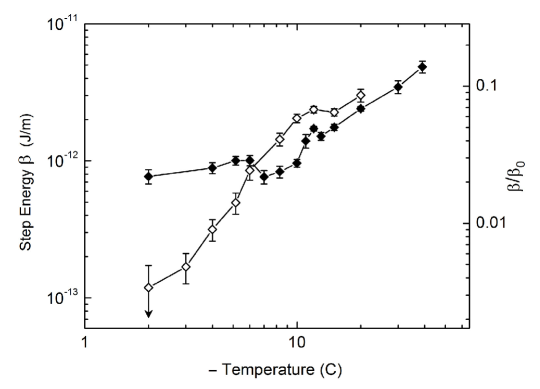
Because the crystal growth we observed was everywhere well described by a layer-nucleation model, the measured supersaturation parameter can be used to calculate the terrace step energy as a function of temperature for both facet surfaces using
where is the area of a molecule on the surface. This relation comes from classical 2D nucleation theory [17, 19]. A plot of from our data is shown in Figure 9. We note from the scale on the right side of Figure 9 that is much smaller than J/m, the product of the surface energy J/m2 of the ice/vapor interface and the nominal molecular step height nm, which is an upper limit on the step energy [19].
3 Discussion and Interpretation
A comparison of the results from the present experiment with analogous results from earlier ice growth experiments is beneficial for advancing the state-of-the-art for these measurements. A careful scrutiny of the published results reveals that in many older experiments a number of systematic errors were not adequately managed (for a summary, see [9, 16]). Diffusion effects especially distort the ice growth behavior, and this fact was not always adequately appreciated in prior experiments.
Removing diffusion effects to reliably determine is especially difficult in experiments done at pressures near one bar. Precise diffusion modeling would be necessary to extract and we believe that sufficiently accurate modeling techniques have not yet been demonstrated. Furthermore, our analysis shows that diffusion effects are important even at quite low pressures, and that the corrections become larger with larger crystals and at higher supersaturations. By identifying, reducing, and modeling this and other systematic effects, we believe that the current measurements are a substantial improvement over previous attempts to determine
Interpreting our results, summarized by the parameterization of shown in Figure 7, presents a significant challenge. Our theoretical understanding of the surface structural changes that accompany surface melting is itself rather poor. How these structural changes in turn affect the crystal growth dynamics is clearly a complex many-body problem. We offer the following conclusions and observations:
1) Our first conclusion, as stated above, is that the measured attachment coefficients for both principal facets are well described by a dislocation-free layer-nucleation model with the simplified parameterization We find it quite remarkable that for both facets the growth dynamics of can be summed up so concisely by the functions and This is true even going through the transition from essentially no significant surface melting to a fully developed quasiliquid layer. Although the equilibrium structure of the ice surface changes dramatically over this temperature range, as does the equilibrium vapor pressure, the functional form remains unchanged as the ice growth is everywhere described by a layer nucleation model. The dominant change with temperature is seen in the nucleation parameter , accompanied by a relatively modest change in on the prism facet.
2) The measured immediately yields the terrace step energy from an application of classical 2D nucleation theory, as described above. We note that the step energy is a fundamental property of the ice surface, in much the same way that the surface energy is a fundamental quantity. It is also an equilibrium property, even though it was derived here from the dynamical process of crystal growth. As an equilibrium, molecular-scale quantity, the step energy may be amenable to calculation using perturbation techniques or molecular dynamics simulations. Considerable progress has been made in investigations of ice surface melting using molecular dynamics simulations [21, 22], so perhaps step energies can be calculated using similar methods. The observed strong temperature dependence in may thus yield important insights into how surface melting affects the ice surface structure, in particular the interface between the crystalline solid and the quasi-liquid surface layers. The step energy can also be used to infer some features of the equilibrium crystal shape, which to date has not been reliably measured for ice [23].
3) The growth behaviors of the basal and prism facets are remarkably different, especially at temperatures above C. In particular, at the highest temperatures we see in a temperature regime where we would expect to find a thick quasi-liquid layer on the ice surface. This is consistent with the growth behavior of ice from liquid water, where the basal surface grows much more slowly than the prism surface at low supercoolings. Quantitatively relating the crystal growth rates from water vapor and from liquid water may be a tractable theoretical problem, since the surface attachment kinetics is likely similar for these two cases. To our knowledge, however, the kinetic coefficient for ice growth from liquid water has not yet been determined, as growth measurements are usually limited by heat diffusion effects.
4) For both facets we see an overall trend that decreases with increasing . As the temperature increases, we suggest that surface restructuring smooths out the terrace edge, thereby lowering the step energy. The trend with temperature is particularly simple on the basal facet for C, where we expect the complicating effects from surface melting are small. These low temperatures may be best suited for molecular dynamics simulations, so extending the prism facet data to similarly low temperature would be beneficial.
5) The small bump in at C is a significant and robust feature in our data, and we suggest that this feature identifies the onset of significant surface melting (significant with regard to its effect on crystal growth dynamics) on the (0001) surface at this temperature. The mechanism that might produce this bump, however, is unknown. This onset temperature agrees with that measured by [4], which is a surface melting measurement using an ice surface preparation similar to that used in the current experiment. The observed shoulder in near C may be a related phenomenon. More generally, we see that the behavior of for both facets is most complex in the temperature range C C, and we suggest that this range includes the onset and development of surface melting on both facets. At lower temperatures surface melting is largely absent, while at higher temperatures the quasi-liquid layer is fully developed.
6) The change in near C is especially noteworthy, as it reverses the general trend with temperature seen in for both facets. One possibility is that surface melting initially results in a more disordered basal surface with a reduced step energy, producing the dip in near C. At higher temperatures, however, we suggest that the quasi-liquid layer (QLL) becomes more fully developed, producing a relatively sharp QLL/ice interface. This sharper interface may then result in a more distinct terrace step and a higher step energy.
7) We note that our measurements of do not lead one immediately to an explanation of the well-known morphology diagram describing ice growth from water vapor [9]. In fact, the opposite is true. At C, for example, we find at all which is at odds with the occurrence of very thin plate-like crystals at this temperature. The explanation for this and other morphological discrepancies seems to lie in the fact that our measurements give only for flat facet surfaces. The edge of a thin plate, however, is not a flat facet surface. The molecularly flat prism facet in this case is typically only some hundreds of molecules wide (assuming an edge radius of curvature of approximately one micron), and it is the dynamics on this surface that determines the edge growth velocity. Earlier one of us put forth the hypothesis of structure-dependent attachment kinetics, suggesting that changes depending on the local crystal morphology, and in particular that is reduced on thin edges [24]. We believe that including this hypothesis can connect the present measurements with the morphology diagram, although many details remain unknown at present.
In summary, we have measured the ice crystal growth velocities of the principal facets of ice from water vapor for what approaches the ideal case – that of perfect crystalline surfaces growing in near equilibrium with pure water vapor. We find that data such as these can be used both as a probe of the temperature dependence of surface melting and as a measure of the effects of surface melting on crystal growth dynamics. This work was supported in part by the California Institute of Technology and the Caltech-Cambridge Exchange (CamSURF) program.
References
- [1] Tartaglino, U. et al., “Melting and nonmelting of solid surfaces and nanosystems,” Phys. Rep. 411, 291-321 (2005).
- [2] Dash, J. G., Rempel, A. W., and Wettlaufer, J. S., “The physics of premelted ice and its geophysical consequences,” Rev. Mod. Phys. 78, 695-741 (2006)
- [3] Wei, X. et al, “Sum-frequency spectroscopic studies of ice interfaces,” Phys. Rev. B 66 085401 (2002).
- [4] Dosch, H., Lied, A., and Bilgram, J. H., “Glancing-angle X-ray scattering studies of the premelting of ice surfaces,” Surf. Sci. 327, 145-164 (1995).
- [5] Bienfait, M., “Roughening and surface melting transitions: consequences on crystal growth,” Surf. Sci. 272, 1-9 (1992).
- [6] Venables, J. A., “Atomic processes in crystal growth,” Surf. Sci. 299/300, 798-817 (1994).
- [7] Kuroda, T., and Lacmann, R., “Growth kinetics of ice from the vapour phase and its growth forms,” J. Cryst. Growth 56, 189-205 (1982).
- [8] Kobayashi, T., and Kuroda, T., “Snow crystals”, in Morphology of Crystals–Part B, edition I, Sunagawa (Tokyo: Terra Scientific) 645-743 (1987).
- [9] Libbrecht, K. G., “The physics of snow crystals,” Rep. Prog. Phys., 68, 855-895 (2005).
- [10] Bailey, M., and Hallett, J., “Growth rates and habits of ice crystals between -20C and -70C,” J. Atmos. Sci. 61, 514-544 (2004).
- [11] Takahashi, T., et al., “Vapor diffusional growth of free-falling snow crystals between -3 and -23 C,” J. Meteor. Soc. Japan 69, 15-30 (1991).
- [12] Libbrecht, K. G., “An improved apparatus for measuring the growth of ice crystals from water vapor between -40C and 0C,” arXiv:1109.1511 (2011).
- [13] Libbrecht, K. G., and Rickerby, M. E., “Measurements of Growth Rates of (0001) Ice Crystal Surfaces,” arXiv:1110.5828 (2011).
- [14] Mason, B. J., “The physics of clouds,” Oxford/Clarendon Press (1971).
- [15] Libbrecht, K. G., “Managing systematic errors in ice crystal growth experiments,” arXiv:1208.5064 (2012).
- [16] Libbrecht, K. G., “A critical look at ice crystal growth data,” arXiv:cond-mat/0411662 (2004).
- [17] Saito, Y., “Statistical Physics of Crystal Growth,” World Scientific Books (1996).
- [18] Libbrecht, K. G., and Bell, R., “Chemical influences on ice crystal growth from vapor,” arXiv:1101.0127 (2010).
- [19] Libbrecht, K. G., “Growth rates of the principal facets of ice between -10C and -40C,” J. Cryst. Growth 247, 530 (2003).
- [20] Libbrecht, K. G.,“Precision measurements of ice crystal growth rates,” arXiv:cond-mat/0608694 (2006).
- [21] Nada, H., van der Eerden, J. P., and Furukawa, Y., “A clear observation of crystal growth of ice from water in a molecular dynamics simulation with a six-site potential model of H2O,” J. Cryst. Growth 266, 297-302 (2004).
- [22] Carignano, M. A., Shepson, P. B., and Szleifer, I., “Molecular dynamics simulations of ice growth from supercooled water,” Mol/ Phys. 103, 2957–2967 (2005).
- [23] Libbrecht, K. G., “On the equilibrium shape of an ice crystal,” arXiv:1205.1452 (2012).
- [24] Libbrecht, K. G., “Explaining the formation of thin ice-crystal plates with structure-dependent attachment kinetics,” J. Cryst. Growth 258, 168-175 (2003).